Journal of the NACAA
ISSN 2158-9429
Volume 12, Issue 2 - December, 2019
Soil Biological Response to Best Management Practices
- Sundermeier, A. , Extension Educator, The Ohio State University Extension
Shedekar, V.S., Postdoctoral Researcher, The Ohio State University
ABSTRACT
It is now possible to accurately measure the soil biological response to best management practices. A site selected in south central Ohio compared tillage with a two-crop rotation to no-till with cover crops and a three-crop rotation (best management), and baseline sod. Biological indicators of PLFA total microbial biomass, bacteria, fungi, arbuscular mycorrhizal fungi, and respiration were all analyzed. In all comparisons, tillage had low biological measurements. The most striking result was tillage with 84ng/g total fungi, sod with 378 ng/g, and no-till with 620 ng/g. Best management practices can improve soil biology.
INTRODUCTION
A diversity of living organisms exists in the soil and are influenced by practices that effect soil functions. The biology of the soil can now be measured and quantified through laboratory soil health testing. Identifying and quantifying different soil organisms requires sophisticated methods and instruments that most soil labs do not have. The PLFA (phospholipid fatty acid) laboratory analysis is a very good indicator of soil biology (Gugino et al., 2009). The primary goal of this manuscript is to demonstrate how biological indicators can be used to demonstrate the differences in different management systems. Simple illustrations and interpretations are provided as guidelines to be used for extension programming.
METHODS
Sample sites were selected in south central Ohio to represent three distinct soil management systems implemented in soils with similar characteristics.
Tillage: This site represents a typical soil management system for this area. Crop rotation consists of corn and soybean. Tillage operations include chisel plow, disk chisel, and soil finisher. Remaining residue at time of planting would be less than 30% coverage of soil.
No-till: This site is unique and a model for ideal best management practices in soil management. Crop rotation consists of corn, soybean, and wheat. There are no tillage operations. Cover crops are utilized whenever possible within the grain crop rotation. A multi-species mixture (grasses, legumes, and brassica) of 10 or more cover crops are planted in August after wheat harvest. Corn is no-till planted into chemically terminated cover crops in the spring. Cereal rye is broadcast into standing corn in early September. The following spring, soybeans are planted into cereal rye which is crimped and rolled then chemically terminated. Winter wheat is planted after soybean harvest. This soil management system has been practiced for over 20 years at this site.
Sod: This site represents a baseline soil property which is an example of the natural environment of the area. This site has been undisturbed for over 10 years and consists of fescue grass cover which has been baled.
Three randomized soil samples were collected from each field on the same day in late September 2018 at all sites. Soil moisture was near field capacity from the previous week rainfall. Soil temperature was 65 degrees Farenheit. These soil conditions are ideal for measuring soil biological response to best management practices (Grigar et al., 2018).
The three soil samples from each field were composited into a single sample, packed with dry ice and shipped directly to Ward Laboratory, (Ward Laboratories, Inc.) for analysis.
RESULTS
The microbial biomass was assessed with the PLFA test (Figure 1). A well-functioning, healthy soil would contain higher amounts of microbes which provide nutrients to crops and naturally control some soil-borne pests and diseases (Tugel et al., 2000). The tillage treatment measured 1,490 ng/g total biomass compared to 4,710 ng/g in sod and 5,240 ng/g in no-till. Tillage destroys the soil environment needed to maintain soil microbes. Best management practices with no-till can exceed microbial biomass amounts found in baseline sod, resulting in a very healthy productive soil.
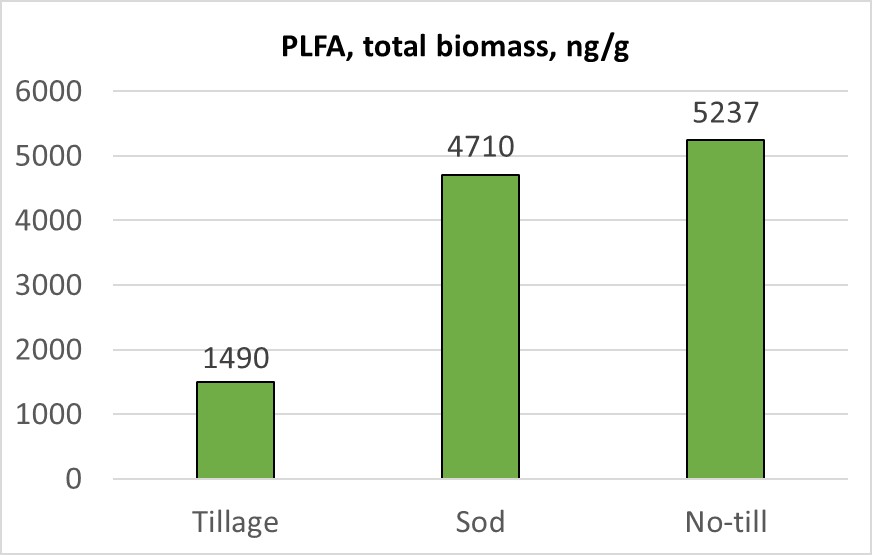
Figure 1. Phospholipid fatty acid (PFLA) measurements expressed as ng/g.
The relative proportions of fungi and bacteria under the three soil management systems are shown in Figure 2. The no-till system was associated with the greatest amount of total bacterial (2757 ng/g) as well as fungal biomass (620 ng/g), followed by sod (2578 ng/g bacteria) (378 ng/g fungi) and the lowest in tillage (739 ng/g bacteria) (84 ng/g fungi). Compared to a tilled system, sod and no-till system had 4 times more fungal biomass, and 7 times more bacterial biomass. Furthermore, the ratio of fungal to bacterial biomass ranged from 0.11 in tilled system, to 0.15 in sod, and 0.22 in no-till system. As the ratio of fungi to bacteria increases, soil microbiome become more efficient in utilizing carbon and nutrients. Such carbon-efficient systems are also likely to release less carbon dioxide to the atmosphere (White and Barbercheck, 2017). The results suggest that an undisturbed system such as no-till greatly enhances fungal biomass as well as the total microbial activity.
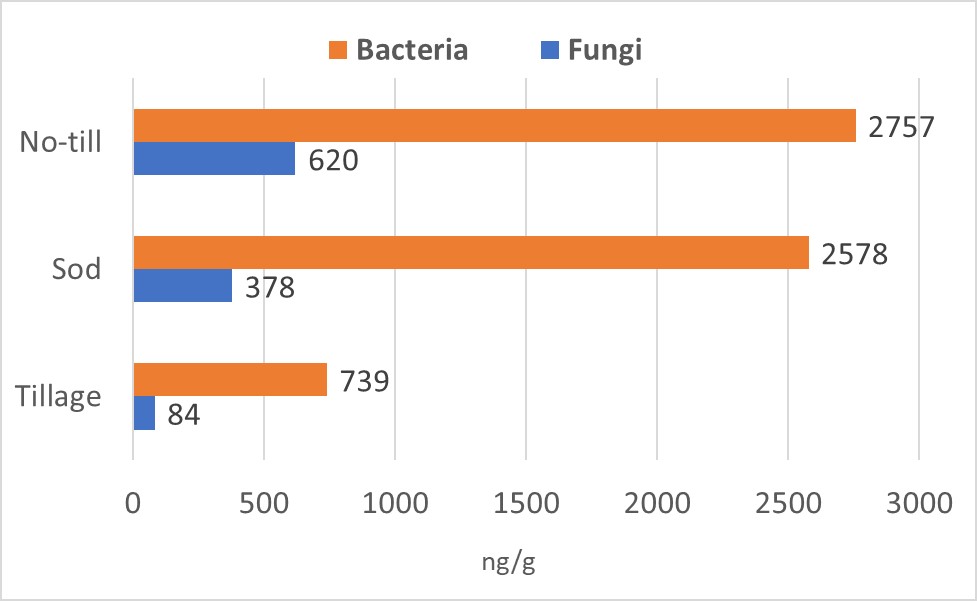
Figure 2. Bacteria and Fungi measurements expressed as ng/g.
Arbuscular Mycorrhizal Fungi (AMF) are important to healthy plant growth. These fungi live on plant roots and grow out into the soil to capture nutrients which roots cannot access. Fungi depend on the plant for sugars for survival. By not disrupting the soil, AMF can multiply rapidly (Figure 3). The tillage treatment measured 29 ng/g AMF. While sod had 150 ng/g and no-till had 153 ng/g AMF. The AMF need to build a network of hyphae to reach soil nutrients. Tillage destroys this network resulting in low AMF measurements (White and Barbercheck, 2017).
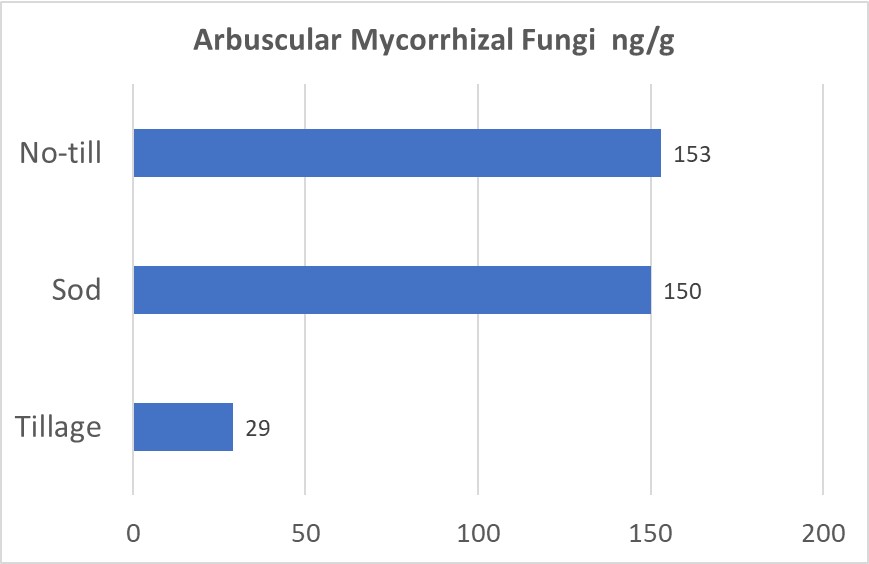
Figure 3. Arbuscular Mycorrhizal Fungi measurements expressed as ng/g.
Soil biological response can be measured using a soil respiration test. Soil samples are dried and rewetted then allowed to incubate for 24 hours to measure carbon dioxide respiration. Living soil microbes produce carbon dioxide through aerobic respiration. The amount of carbon dioxide release is directly proportional to the microbial biomass in the soil (Figure 4). The concentration of carbon dioxide under tillage treatment measured 19.8 ppm, 42.9 ppm in sod, and 41.6 ppm in no-till system respectively. These results further demonstrate the stark contrast in microbial biomass between a tilled versus no-till system.
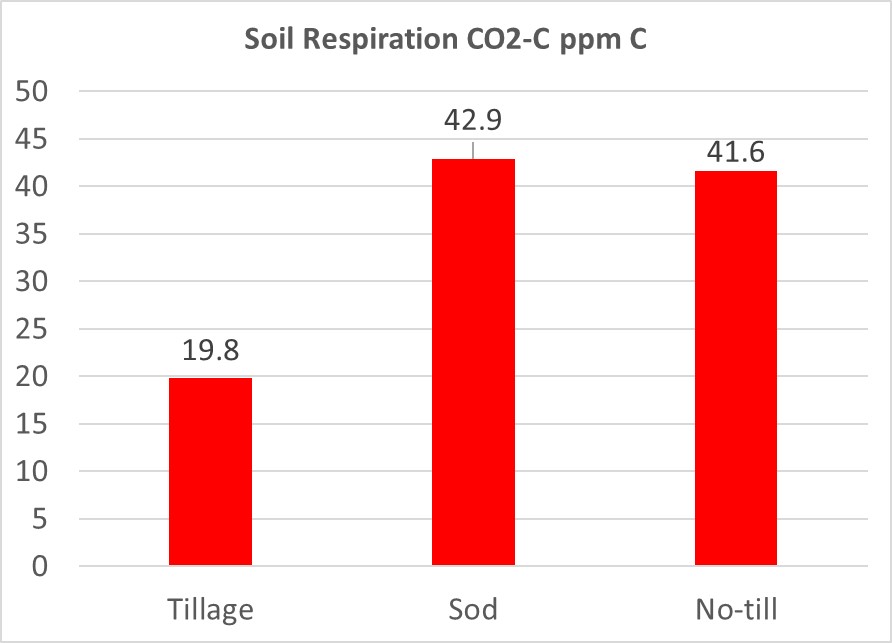
Figure 4. Soil Respiration burst test (24 hour) measurements expressed as parts per million carbon.
DISCUSSION
Measuring the biology of the soil allows one to determine the potential ability of the soil to supply nutrients and improve productivity. By analyzing phospholipid fatty acids (PLFA), the living microbial biomass and its components can be determined. Since microbial communities in the soil can change rapidly, one can compare soil management systems to determine best management practices to promote microbial activity. Tillage disrupts the hyphae of fungi established in the soil (Grigar et al., 2018). These illustrations can help draw the following conclusions:
- A PLFA test can clearly distinguish between a disturbed versus undisturbed soil management system.
- An undisturbed system such as no-till promotes microbial and fungal biomass that is several times greater that that in a disturbed system such as conventional tillage system.
- The undisturbed systems (no-till and sod) were associated with greater ratios of fungal to bacterial biomass, compared to tilled systems.
- A no-till system also promotes AMF compared to a tilled system.
- A biologically active and fungal dominated system is more efficient in cycling the carbon and nutrients, resulting in lower carbon dioxide respiration rates (USDA NRCS, n.d.). Thus, carbon dioxide can be used as an indicator of biological activity as well as the efficiency of the system.
- Respiration rates were greater in the undisturbed fields (no-till and sod) than the tilled field.
REFERENCES
Grigar, J., Hatfield, J.L. and R. Reeder, R. (2018). Transitional No-till: What is it and How Does It Differ From “True No-till”. Crops and Soils Magazine, November – December 2018.
Gugino, B.K., Idowu, O.J., Schindelbeck, R.R., van Es, H.M., Moebius-Clune, B.N., Wolfe, D.W., Thies, J.E., and Abawi, G.S. (2009). Cornell Soil Health Assessment Training Manual. Edition 2.0. Ithaca: Cornell University, 2009.
Tugel, A.J., Lewandowski, A.M., and Happe-vonArb, D. (2000). Eds. Soil Biology Primer. Rev. ed. Ankeny, Iowa: Soil and Water Conservation Society, 2000.
USDA NRCS Soil Health. https://www.nrcs.usda.gov/wps/portal/nrcs/main/soils/health/
Ward Laboratories, Inc. PLFA Soil Test Information. https://www.wardlab.com/soil-health-services.php
White, C., and Barbercheck, M. (2017). Managing Soil Health: Concepts and Practices, 2017. https://extension.psu.edu/managing-soil-health-concepts-and-practices