Journal of the NACAA
ISSN 2158-9429
Volume 13, Issue 1 - June, 2020
Utah TRAPs - An Online Tool for Weather and Pest Information
- Murray, M.S., Integrated Pest Management Specialist, Utah State University
ABSTRACT
Agricultural producers and landscape managers are busier than ever, dealing with an array of regulations, pesticide changes, and labor issues. One way for them to be more efficient is through the use of weather data for predicting crop management practices. Utah TRAPs (Temperature Resource and Alerts for Pests) is a suite of online tools designed to address these needs. It was developed in partnership between the Utah State University Integrated Pest Management Program and the Utah Climate Center. It consists of a mobile-friendly website, text/email alerts, and a dedicated mobile app. Data for the TRAPs tools is generated from 25 Utah orchard weather stations and 70 additional weather stations located in four western U.S. states. Utah TRAPs is a decision-aid system with real-time, site-specific information that helps growers improve pest management, reduce pesticide drift, implement frost protection practices, and schedule irrigation. Crop producers, hobby growers, and researchers use the tools, resulting in reduced pesticide sprays, reduced costs, and increased yields.
Introduction
Timely, relevant, and site-specific information on weather conditions and pest activity helps agricultural producers with decision-making, allowing them to be profitable (Damos, 2015). For example, codling moth, a major pest of apples, can cause 10 to 25% loss of yield due to poor management (about $4,000 to $10,000 loss per acre; Olatinwo and Hoogenboom, 2014). Another example is that producers of spring-blooming perennial crops often need to use expensive machinery to reduce frost-related losses. Running a single wind machine costs $45 per hour for fuel, and machines may run up to 100 hours in spring. With each machine covering 12 to 15 acres, the springtime operating costs on a 50-acre farm, using local weather forecasts (rather than site-specific temperatures), could reach as high as $18,000 (Utah fruit producer, personal communication, August 2019).
Pest management practices that are accurately-timed are more effective than those that are calendar-based because accurate timing ensures not only that the target pest is susceptible to treatment, but results in fewer unnecessary pesticide applications. This is especially important given the changing climate, which over time, is likely to impact timing of pest development.
Over the past several decades, predictive models have been developed for many insect pests and plant diseases; however, site-specific access to this information has not always been available (Damos, 2015). Insect pest models are based on degree days, which are a measurement of heat units, calculated from daily or hourly minimum and maximum temperatures (Herms, 2004). This technique is used for management timing of a number of insect pests in fruits, vegetables, field crops, and woody ornamentals. Plant disease models have also been developed, using temperature, precipitation, and other variables, to predict situations that are conducive to infection (Magarey et al., 2007). It is especially important that producers have the ability to access this information wherever they have internet access, either from a computer or in the field (Kerrigan and Keating, 2011; Walter, 2011).
The Utah Integrated Pest Management Program (IPM) at Utah State University (USU) serves to help agricultural producers and landscape managers efficiently and profitably manage plant pests and reduce losses related to adverse weather conditions. These goals ultimately contribute to the IPM Program’s mission of reducing harmful pesticide inputs and protecting human and environmental health. Through personal communications with various producers and land managers in Utah, USU recognized a demand for access to timely weather and pest management information. With IPM Program staff and resources stretched thin, we sought out opportunities to streamline costs without compromising service to our stakeholders.
In 2010, we formed a partnership with the Utah Climate Center (UCC) to discuss weather-related tools offered through the UCC website. A product was developed called Utah TRAPs (Temperature Resource and Alerts for Pests). Over the next several years, it was revised and expanded, and is now a highly used decision-aid tool delivered to stakeholders in multiple ways, including direct web access, an email/text alert system, and a mobile app. Utah TRAPs has helped over 500 producers in four western U.S. states plus thousands of backyard and hobby producers lower their production costs, reduce pesticide use, and generate healthy crops and landscapes.
Development of Utah TRAPs
Utah TRAPs is overseen by an advisory committee of stakeholders in crop production and research. Through bi-annual meetings, the committee provides input on needs and changes, selects locations for new weather stations and coordinates their installation, and tests and evaluates new online tools and updates. The committee has also helped garner support for TRAPs via donations from producers. Additional support for Utah TRAPs was obtained through grants from USDA-NIFA, the Utah Department of Agriculture and Food, and USU Extension.
The FGNet Orchard Weather Stations
Utah TRAPs utilizes data from a variety of weather networks across Utah, as well as from USU-owned weather stations. Over the past two decades, the Utah IPM Program and the UCC have installed new weather stations and updated existing stations in 25 orchards in the state, known collectively as “FGNet”. Collecting data from the stations evolved from a cumbersome, dial-in connection to each station once per week (called FTP, or file transfer protocol), to a once daily telemetry connection via high monthly fee, to its current state of real-time data download at a minimal cost, where eight weather stations communicate through a single telemetry connection.
The stations are built on a climbable and sturdy triangular tower, enabling them to accommodate the equipment necessary to receive and transmit data from a variety of ports (Figure 1a). They use a battery and solar panel for power, secure 4G modem, datalogger, and all have the same suite of sensors, which include air, bud, and soil temperature; relative humidity; precipitation; leaf wetness; wind speed and direction; solar radiation; and soil moisture. UCC technicians calibrate all station sensors once per year, and other than accidental damage, the stations have been maintenance-free for the last four years.
Data from each station is applicable to approximately 100 to 500 orchard acres (depending on topography), with the existing FGNet stations serving 2,500 to 12,500 acres. In addition, six weather stations also utilize a “pod system” that includes four additional temperature sensors located throughout the field or orchard. The “pods” are linked to the primary station, increasing the precision of predicting pest activity or frost conditions where microclimates occur. Data from FGNet is run through a series of automated and manual quality control checks before being used for Utah TRAPs.
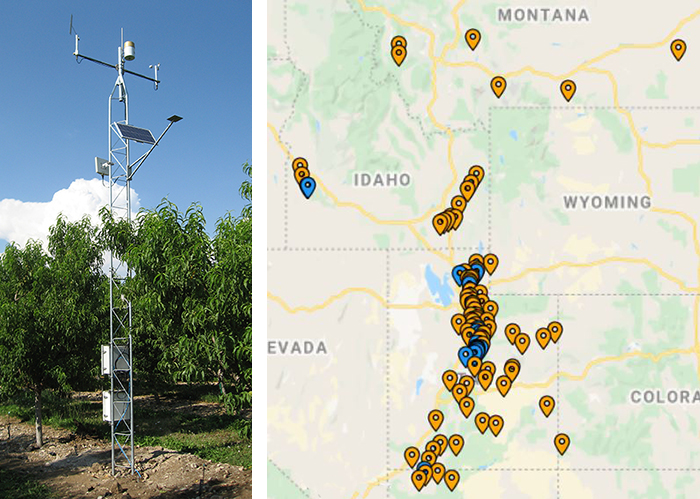
Figure 1a (left). Example of an FGNet orchard station, showing climbable tower and sensors both above and within the tree canopy.
Figure 1b. (right). Weather stations offered on Utah TRAPs (currently, 95 stations). Blue markers represent the 25 FGNet orchard stations.
Utah TRAPs Tools
Utah TRAPs Online
The Utah TRAPs website opens to a Google-based map of stations (FGNet plus 70 additional stations from other networks; Figure 1b). After selecting a station, the user can then select either weather data or pest management information. Weather data is presented in user-friendly formats of interactive charts and tables (Figure 2). Users can also download the complete set of data variables.
One of the most highly used pages shows up-to-the-minute weather conditions. Producers such as tree fruit growers must know when to protect flowers from frost, so when low temperature threats arise each spring, these growers monitor their orchard weather station page closely to help inform their decision regarding whether or not to operate their costly wind machines. Later in the growing season, agricultural producers and landscape managers watch this page for wind speed and wind direction for spraying decisions (to reduce drift), and for precipitation and evapotranspiration values for irrigation decisions.
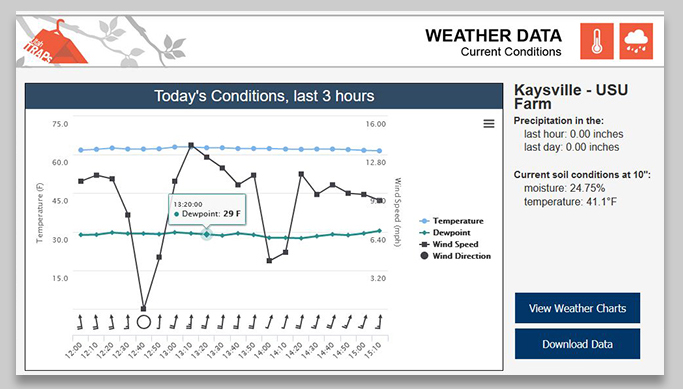
Figure 2. Example of a Utah TRAPs weather station Current Conditions web page, showing interactive graph of data.
Utah TRAPs also provides pest management information using degree-day models for 12 insect pests and one disease, plus degree-day activity timings for 72 pests of woody ornamentals. After a user selects a station and a pest, the results page displays the current and past pest activity and treatment status, based on accumulated degree days. The results also include four weeks of forecasted predictions, where the first seven days represent the National Weather Service forecast and the remaining three weeks are from 30-year temperature averages.
If a pest management recommendation occurs on a certain date, an icon will display, and when clicked, a box will display with more information (Figure 3). The site’s management recommendations include timing information for pest monitoring and treatment, and stresses the use of lower-toxicity pesticide options. Users are then referred to USU’s specific crop production guides for pesticide recommendations based on toxicity, efficacy, and modes of action.
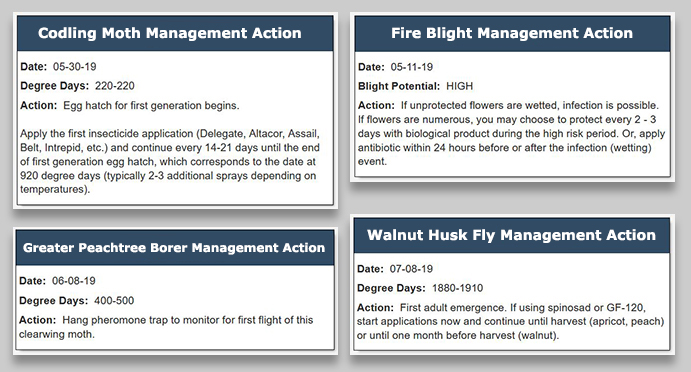
Figure 3. Examples of management actions associated with certain insect degree-day or plant disease models from the Utah TRAPs website. The recommendations stress pest monitoring and the use of lower-toxicity products to reduce pesticide use and protect human and environmental health.
Utah TRAPs Alerts
An alert system was added in 2015, primarily geared to tree fruit producers to provide notifications of fruit pest events and frost alerts (Figure 4). Users set up an account and can schedule customized text or email messages that provide alerts for multiple pest actions or an impending temperature threshold. The pest alert message includes a treatment or monitoring date for the selected insect or disease, plus basic management options. To maximize efficiency, users can keep the same customization over multiple years by setting start and end dates for each alert type. As of February 2020, 96 commercial producers and 72 others use the alert system.
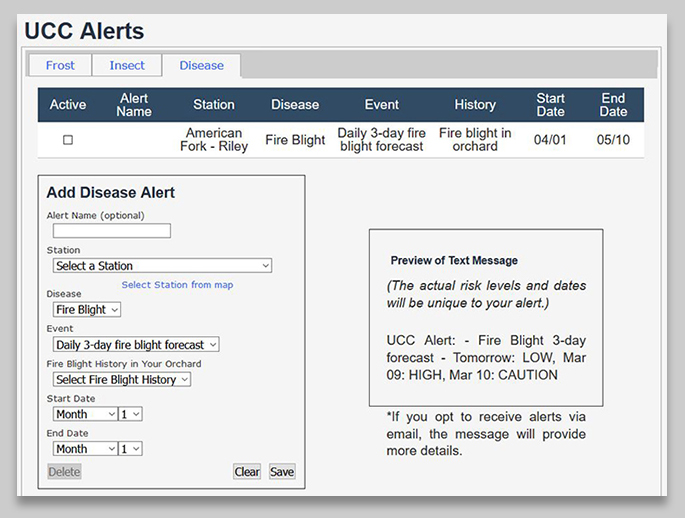
Figure 4. Utah TRAPs alert system page, showing example of a customized plant disease alert.
Utah TRAPs App
A USU survey of tree fruit growers was conducted in 2014 (n=55), revealing that a majority (82%) of respondents own smart phones, and when asked about their use of the Utah TRAPs website, almost 90% said they would also prefer to access the information via a mobile app. Consequently, we sought and received USDA-NIFA funding to develop a companion app which was then released in 2017 (Figure 5). The app is available for Apple and Android, and is found under search terms, “Utah traps.”
The app was designed to be simple yet highly functional, offering an array of information in a high-speed format (internet connection via Wi-Fi or LTE required). The app provides growers with a reliable and simple way to monitor for frost protection in the middle of the night, or to look up real-time pest management recommendations from home, at the farm, or from any other location. The app also includes five-day weather forecasting to help growers decide the best day to implement the given pest management recommendations, as temperature and wind conditions can influence spray applications. As of March 2020, the in-app survey (n=72 respondents) shows that 93% use the app up to two times per week, 86% use it for frost monitoring, and 72% use it for pest management information.
![]()
Figure 5. Utah TRAPs iconography, with website header shown at top, app launch page shown at left, and icon for the Apple and Android app stores shown at right.
Dissemination
The Utah TRAPs tools are promoted in a variety of ways. USU Extension agents are updated on the tools annually at in-service training sessions, where they also learn how to incorporate them into their own IPM programs. Producers have been trained at hands-on computer workshops, as well as through multiple IPM events, grower meetings, and annual crop conferences. The information is also disseminated via the Utah IPM Pest Advisories, which are seasonal newsletters emailed to a subscriber list (11,350 as of winter 2020), and Facebook. And finally, a rack card advertising Utah TRAPs is provided to the public at trade shows, conferences, all Utah Extension county offices, and at select garden centers.
Evaluation
Utah TRAPs has been evaluated through surveys delivered to the subscribers of the Utah IPM Pest Advisories every other year. In addition, we have received feedback through a survey link within the TRAPs app, and from a direct survey of users of the alert system. All surveys were developed using the Qualtrics software. Website use is evaluated using Google Analytics.
As baseline information, a 2009 survey delivered by the Utah IPM Program found that at that time, fewer than 10% of tree fruit growers used weather data or degree-days to make crop management decisions, and almost 90% felt that site-specific information would help improve their bottom line. About a year after the first release of the Utah TRAPs website, the 2012 Utah IPM Pest Advisory survey (n=127 commercial producers) found that there was interest in using the site for the purposes of frost monitoring (38%), soil moisture monitoring (27%), and pest management recommendations (72%).
The impacts shown in Figure 6 are mean results from the Utah IPM Program surveys in 2016 and 2018, delivered to subscribers of our pest advisories (9,450 in 2016 and 10,776 in 2018), with an 8% (n=756) and 10% (n=1,078) response rate, respectively. The average of the two surveys found that 60% use the TRAPs website and 38% reported using the TRAPs app on a regular basis. The survey results showed that TRAPs users increased their knowledge of proper pesticide timing to reduce waste and improve efficacy, pest monitoring options and timings, and the importance of not spraying during bloom. TRAPs also helped to reduce pesticide usage, as some users reported reducing their use of broad-spectrum pesticides or switching to lower-toxicity options. Many users also reduced costs as a result of timely pest management recommendations and temperature and soil moisture monitoring. And finally, users reported healthier plants, more marketable crops, and higher yields.
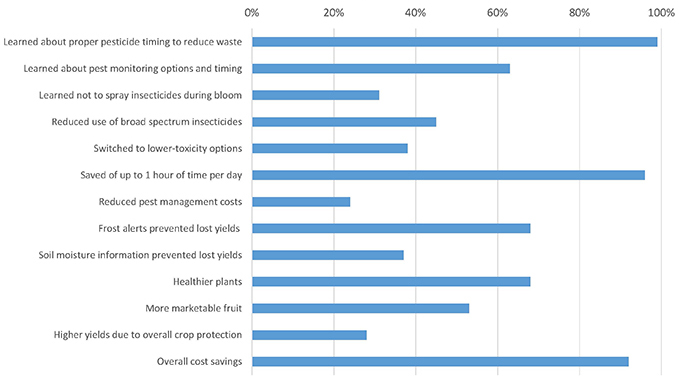
Figure 6. Average impacts from 2016 (8% response; n=756) and 2018 (10% response; n=1,078) surveys by the Utah IPM Program to subscribers of the IPM pest advisories. Respondents were asked whether the use of Utah TRAPs improved their knowledge, changed their pesticide use, changed operational costs, or affected yields.
The final measure of evaluation is website usage. Google analytics shows that as of December 2019, the Utah TRAPs webpage is the most-often visited component of the entire Utah Climate Center website. From 2010 to 2019, the average number of monthly page views (from March to August) increased almost six-fold, from 180 to 1,200 users.
Conclusions
Weather data is essential to support healthy crops and profitability for producers and landscape managers. Easily-accessible products from weather data can help producers protect plants from frost or drought conditions, reduce pesticide inputs, and ultimately improve fruit yields (Sherman and Gent, 2014). The online decision-aid tool, Utah TRAPs, is widely accessible, easy to use, and the only service of its kind in Utah and the surrounding Intermountain West. Commercial and backyard producers from Utah, Colorado, Idaho, Oregon, Montana, and Wyoming use the tools to improve pest management and other production practices.
Users have reported reduced pesticide sprays, improved yields, and cost-savings by optimizing inputs for pest management, frost protection, and irrigation. The economic impact of the frost alert system and TRAPs is estimated to save crop producers about $90/acre (through the reduction of two pesticide sprays and optimizing frost-protection wind machine use). Beyond the public use, data from Utah TRAPs also assists researchers from USU and several western U.S. states in projects related to irrigation, plant chilling requirements, plant hardiness, and pest management.
Literature Cited
Damos, P. (2015). Modular structure of web-based decision support systems for integrated pest management. A review. Agron. Sustain. Dev. 35, 1347–1372. https://doi.org/10.1007/s13593-015-0319-9
Herms, D.A. (2004). Using degree-days and plant phenology to predict pest activity. In V. Krischik and J. Davidson (Eds.), IPM (Integrated Pest Management) of Midwest Landscapes pp. 49-59. Minnesota Agricultural Experiment Station Publication 58-07645, 316 pp. http://www.nurserycropscience.info/ipm/scouting-monitoring/technical-pubs/herms-2004-using-degree-days-plant-phenology-to.pdf
Kerrigan, Karen, and Raymond Keating. (2011). Saving time and money with mobile apps. Small Business and Entrepreneurship Council. 25 pp. https://sbecouncil.org/2011/06/03/new-report-mobile-apps-saving-small-businesses-more-than-a-billion-hours-annually/
Magarey, R. D., G. A. Fowler, D. M. Borchert, T. B. Sutton, M. Colunga-Garcia, and J. A. Simpson. (2007). NAPPFAST: An internet system for the weather-based mapping of plant pathogens. Plant Disease 91:4, 336-345.
https://doi.org/10.1094/PDIS-91-4-0336
Olatinwo, Rabiu and Gerrit Hoogenboom. (2014). Weather-based pest forecasting for efficient crop protection. In Dharam P. Abrol (Ed.), Integrated Pest Management pp 59-78. Academic Press, 576 pp. https://doi.org/10.1016/B978-0-12-398529-3.00005-1
Sherman, Jennifer and David H. Gent. (2014). Concepts of sustainability, motivations for pest management approaches, and implications for communicating change. Plant Disease. 98:8, 1024-1035.
https://doi.org/10.1094/PDIS-03-14-0313-FE
Walter, John. (2011). More and more smartphones go to the field (online survey). Successful Farming Magazine. http://www.agriculture.com/news/technology/me-smartphones-go-to-field-this-spring_6-ar15872