Journal of the NACAA
ISSN 2158-9429
Volume 13, Issue 1 - June, 2020
Determining Irrigation Scheduling for Vegetable Crops Using the Blue Dye Test
- Hollifield, S., County Agent, University of Georgia
Candian, J.S., Post-doctoral Research Associated, University of Georgia
da Silva, A.L.B.R., Assistant Professor / Extension Specialist, University of Georgia
ABSTRACT
Sandy and loamy sand soils have low water holding capacities and require frequent irrigation events to potentiate yield. Proper scheduling of irrigation events in vegetable fields, with drip irrigation, can be simply identified using a blue-dye indicator, which is injected to color the soil. The objective of this educational demonstration project was to assist and educate growers, in the scheduling of irrigation events, using the blue dye test method. Conducted in a 42-acre field located in Brooks County, GA, the blue-dye test evaluated six treatments representing irrigation timings at 15, 20, 25, 30, 40, and 60 minutes. Irrigation was applied at 500 gpm and 60 psi, while blue-dye indicator was injected after system pressurization. Treatments were replicated 4 times in a complete randomize design. Replications were considered a bed 100-ft. long. After irrigation, trenches were open along the soil profile and measurements of the wet zone were made. Soil measurements recorded the depth between bed surface and deepest dye observation, maximum wetted width located in wet zone, and greatest distance between sides of wetted zone below an emitter. Downward soil water movement linearly increased with irrigation timing. After 40 and 60 minutes of irrigation, blue-dye indicator was measured at 12.5-in and 15-in of soil depth, respectively. This indicates water was moving below bell pepper root zone (12-in of soil depth), under 60 minutes of irrigation. Bell pepper plants are typically planted in double-rows 9 inches from the drip line. Lateral soil water movement had a plateau at 9.5 inches from the drip line with 40 minutes of irrigation. Therefore, irrigation events exceeding 40 minutes only represented downward water movement. Seeking to optimize irrigation scheduling, growers can reduce row-spacing from the drip line to 8 inches. The success of a blue-dye test is visual and can be easily conducted by extension agents.
INTRODUCTION
In Brooks County, producers grow approximately 6,250 acres of commercial vegetables annually (Wolfe and Stubbs, 2018). Most of the vegetables produced are grown in commercial fields consisting of sandy loam and sandy soil types, where commercial vegetable production can be challenging. Sand particles are large and coarse, which allow water drain quickly (Mccarty et al., 2016), and when added to the shallow root system of vegetable crops, this constantly challenges growers to monitor and maintain adequate moisture and nutrients.
Depending on air temperatures and other environmental factors, vegetable crops grown in sandy soils are likely to become dry soon after an irrigation or rainfall event (da Silva et al., 2019). Also, vegetables produced in sandy soils often times exhibit nutrient deficiencies due to high levels of nutrients leached when irrigation is not properly managed (Laird et al., 2010). In general, vegetable growers must closely manage fertility programs with the timing of irrigation events and rainfall occurrences to avoid plant stresses and yield reductions (Incrocci et al., 2017).
During the 2019 production season, the UGA – Extension office in Brooks County addressed additional irrigation questions and concerns in commercial bell pepper fields. Most growers were concerned about water movement throughout the soil profile after irrigation events. Therefore, to educate growers on proper scheduling of irrigation events, a blue-dye field test was conducted. This is a practical method to visualize water movement in the soil (Simonne et al., 2017), consisting of the injection of a water-soluble dye through the drip irrigation system to provide a visual report of water movement in the root zone. In collaboration with growers, the first blue-dye commercial field test in Georgia was conducted with the objective to determine irrigation scheduling for bell pepper production in sandy soils.
MATERIALS AND METHODS
The experiment was conducted in a 42-acre commercial bell pepper field in Morven, GA (31º01’37.2” N, -83º28’48.0” W; Figure 1) in 2019. Soil in the experimental area is classified as sandy soil with poor water holding capacity (USDA, 2020). Collaboration with growers allowed to simulate production conditions and measured results for soil water movement that was indicative of those occurring during crop production.
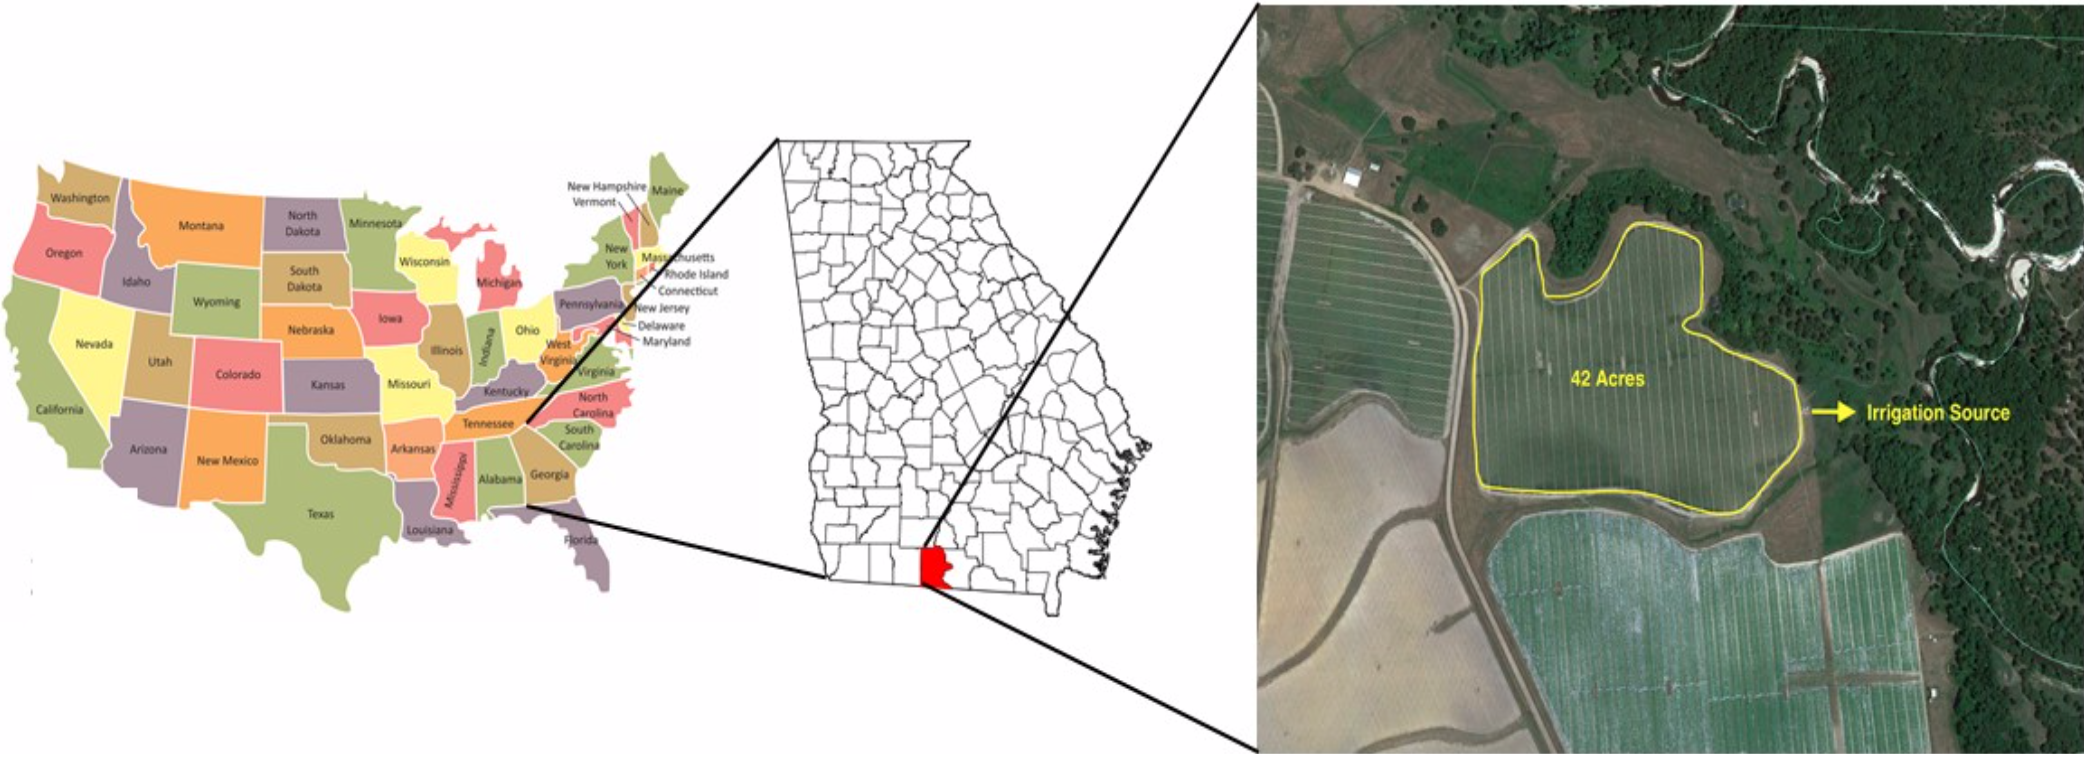
Figure 1. Physical location and area of blue dye test experiment.
Experimental design
The blue-dye test evaluated six treatments representing irrigation events of 15, 20, 25, 30, 40, and 60 minutes. Treatments were replicated 4 times in a randomized complete block design. Plots were considered a 100-ft. long bed, with single irrigation drip tape in the center of the bed with shut off valves to control irrigation events. Timing was monitored using a stopwatch. Figure 2 shows the bed dimensions of bell pepper used, which are the common dimensions used in vegetable production.
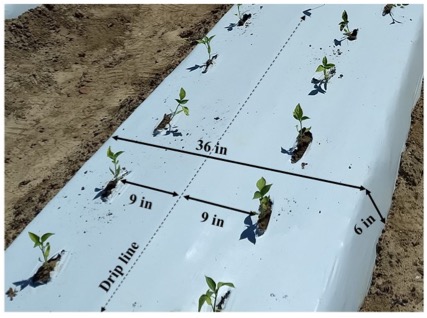
Figure 2. Dimensions of a typical vegetable crop bed with plastic mulching planted with bell pepper in Georgia.
A soluble blue-dye indicator (Dynamark U.V., Windfield Solutions, St. Paul, MN) was poured into a water tank (Figure 3) at a blue-dye indicator and water ratio of 1:50. Blue dyed solution was injected in the irrigation water to color the soil after system pressurization. Irrigation was applied at 500 gpm and 60 psi. Since irrigation volume applied dictates the distribution of water in the soil, not the irrigation timing, pressure and water flow were monitored throughout the duration of the test.
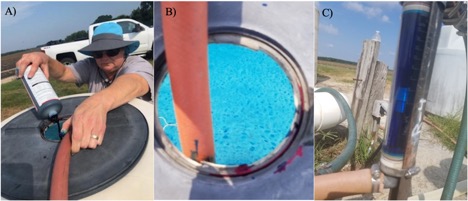
Figure 3. Application of blue dye indicator in the water tank (A), mixing of blue dye indicator and water in the water tank (B), and injection of solution in the irrigation water using a fertigation pump (C).
Data collection
At the completion of the blue-dye test, trenches were dug throughout the soil profile of each plot. Immediately after digging, dye patterns appeared below emitters but were not as apparent (Figure 4). The contrast between the dye areas and the soil became more noticeable as the bed dried. Therefore, measurements of the wet zone were made and recorded 24 hours after the test began. Measurements of the wet zone included: the distance between bed surface and deepest dye observation, maximum wetted width found in wet zone, and distance from bed surface down to measured width (Figure 4), with all data were measured in inches.
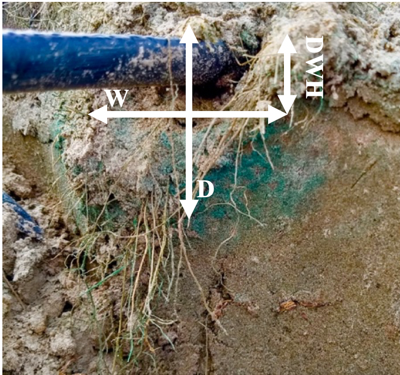 Figure 4. Effect of the blue dye on the distance between bed surface and deepest dye observation (D), maximum wetted width found in wet zone (W), and distance from bed surface down to measured width (DHW). The picture was taken right after the 15 minutes irrigation treatment.
Statistical analysis
All data were analyzed using the R-Studio (RStudio Team, 2015). An analysis of variance (ANOVA) followed by linear and quadratic regression analyses when P values were ≤ 0.05 for each measured variable was conducted with irrigation timing (i.e., 15, 20, 25, 30, 40, and 60 minutes) as a fixed effect.
RESULTS
Distance between bed surface and deepest dye observation
There was a significant linear regression for the distance between bed surface and deepest dye observation (p < 0.001), where downward soil water movement linearly increased with irrigation timing (Figure 5A). Due to the sandy soil texture, such a result was expected. After 15 minutes of irrigation, the blue dye indicator was measure at 7.3-in of soil depth, but after 40 and 60 minutes of irrigation, the blue-dye indicator was measured at 12.5-in and 15-in of soil depth, respectively (Figure 6).
Maximum wetted width in the wet zone
There was a significant quadratic regression for the maximum wetted width in the wet zone (p < 0.004), in which lateral soil water movement maximized with 46 min at 9.5 inches (Figure 5B). In average, the maximum wetted width in the wet zone was 9-in and it was found in the irrigation treatments of 40 and 60 minutes (Figure 6). Because sandy soils lateral soil water movement is considerably lower than the downward soil water movement, results indicate that irrigation events longer than 40 minutes have no effect on the lateral water movement and will only potentiate the downward soil water movement.
Distance from bed surface down to measured width
There was a significant linear regression for the distance from bed surface down to measured width (p < 0.001). The depth of the largest width of wet zone increased with irrigation timing (Figure 5C). The shortest width of 3.5-in was measured after 15 minutes of irrigation, while 5.5-in and 6.3-in were measured for the 40- and 60- minutes irrigation treatment, respectively (Figure 6).
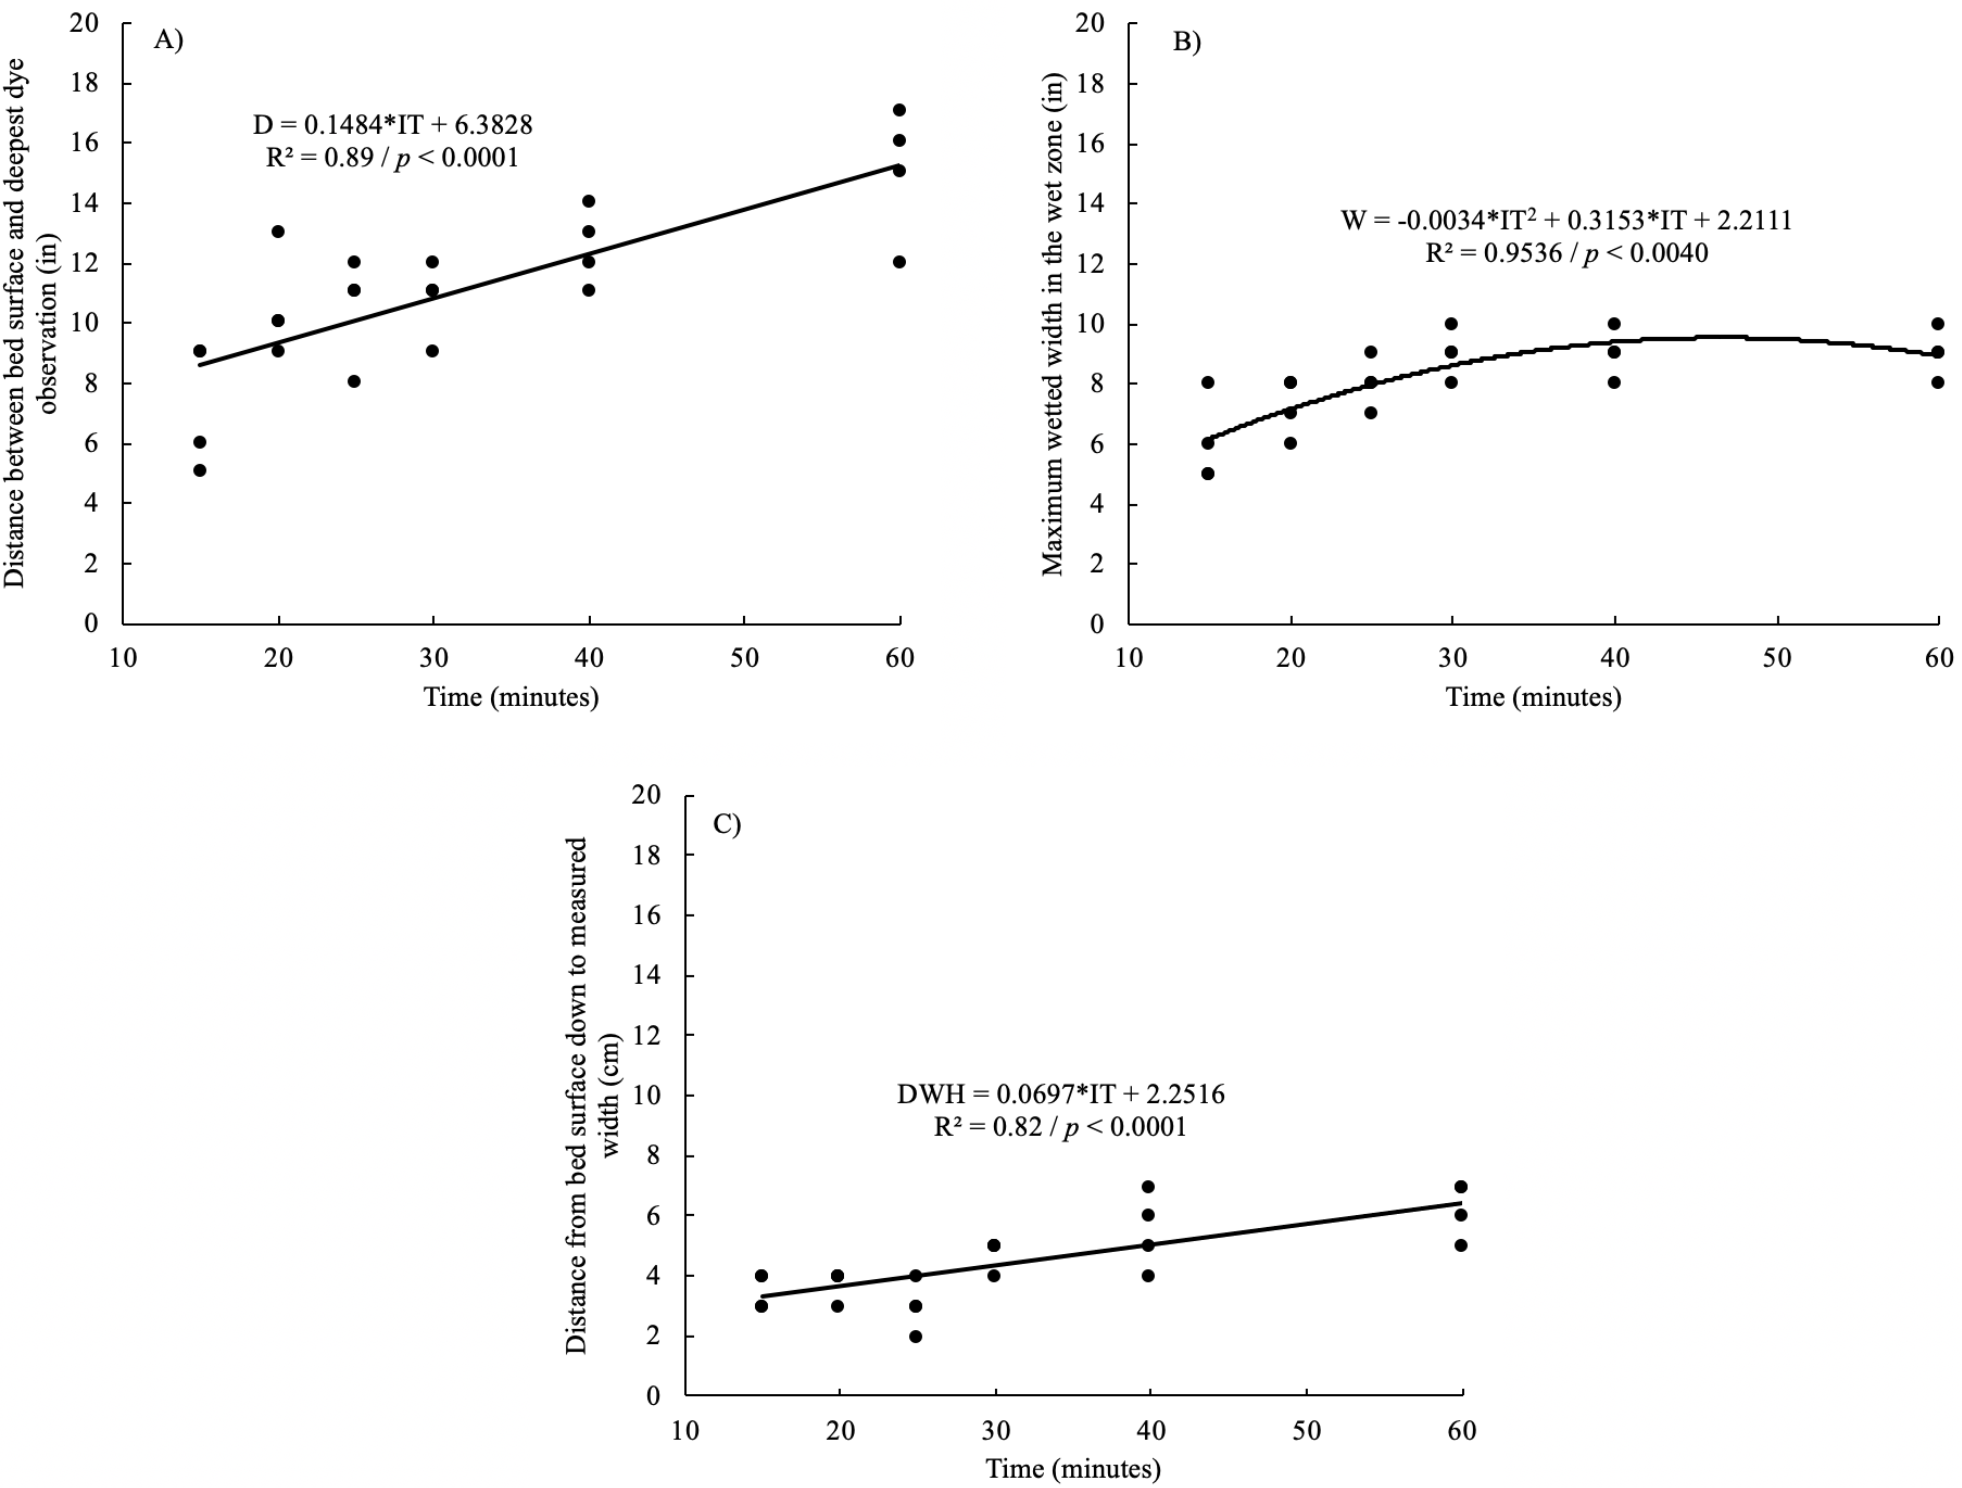
Figure 5. Regression analysis for the distance between bed surface and deepest dye observation (A), maximum wetted width in the wet zone (B), and distance from bed surface down to measured width (C). Note: D means distance between bed surface and deepest dye observation, W means maximum wetted width in the wet zone, DWH means distance from bed surface down to measured width, and IT means irrigation time.
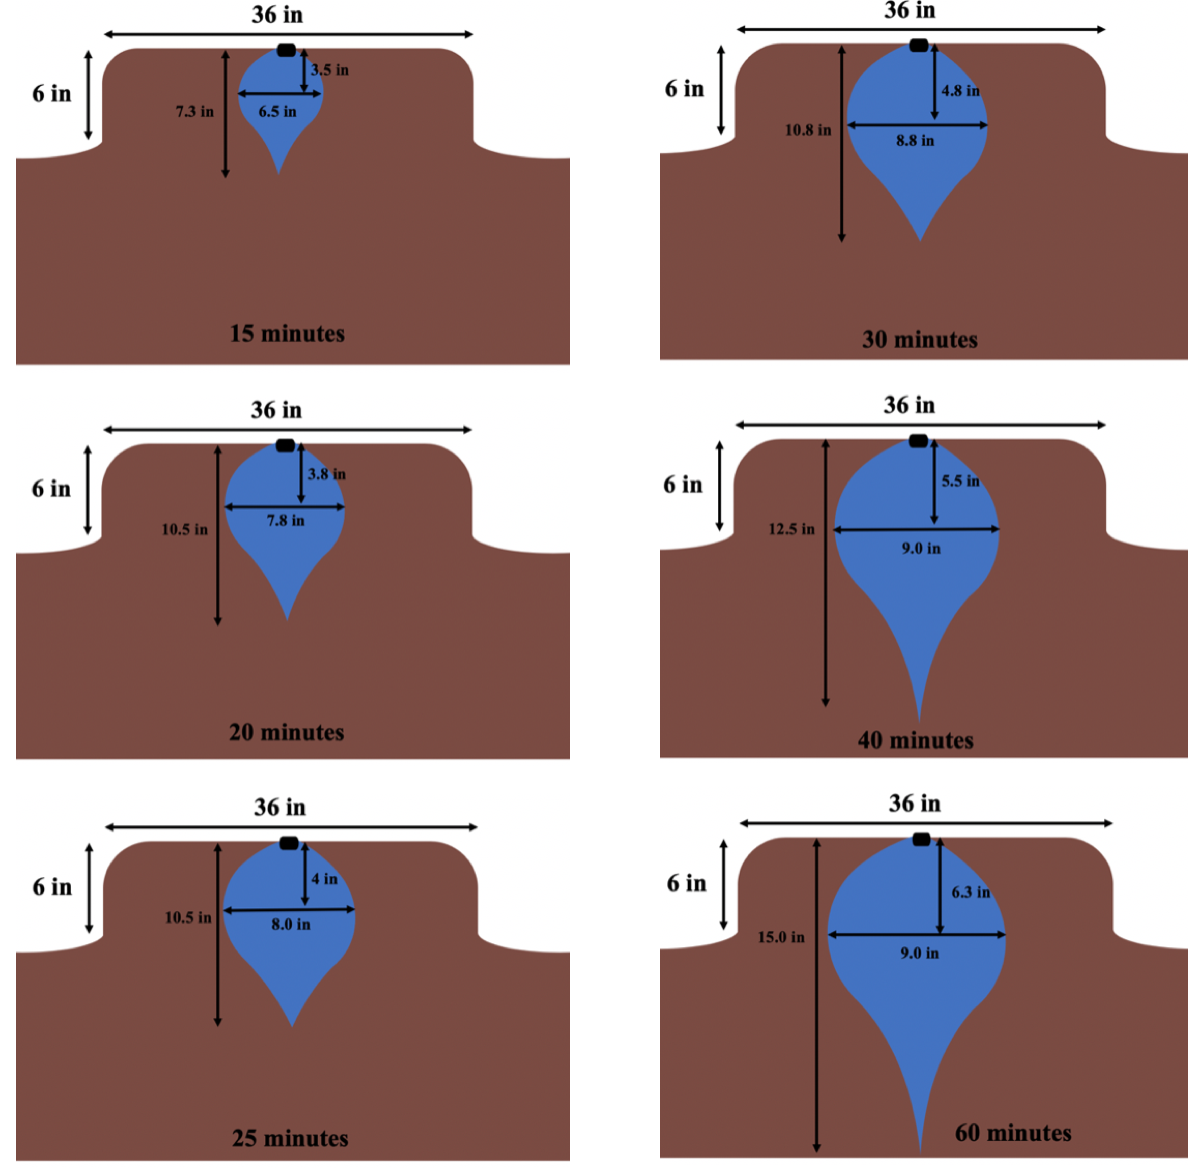
Figure 6. Average measured distance between bed surface and deepest dye observation, maximum wetted width in the wet zone, and distance from bed surface down to measured width for the 15, 20, 25, 30, 40, and 60 minutes of irrigation.
DISCUSSION
Scheduling irrigation events are always a challenge for vegetable growers in sandy soils. The shallow root zone of vegetable crops and the low soil water holding capacity of coarse-textured soils require growers to accurately manage irrigation events. This helps to ensure proper moisture availability and avoid nutrient leaching (da Silva et al., 2019). The blue dye test demonstrated to be practical and accurate in assisting growers on manage irrigation.
While bell pepper is commonly grown in raised beds with plastic mulching and drip irrigation, where plants are set in double rows spaced 9-in each from the center drip tape line to maximize plant population (Figure 1), bell pepper root zone is mostly located between 8 to 12 inches of soil depth (Saefuddin and Saito, 2019). Our results indicated that irrigation events over 40 minutes were moving water below the bell pepper root zone. Further, irrigation events over 40 minutes could not move water laterally much longer than 9-in from the drip line. Therefore, the blue dye test indicated that 60-minute daily irrigation events used by growers, should be reduced to irrigation events of 40 minutes conducted twice a day. In addition, reducing the spacing bell pepper rows of the drip line from 9- to 8- inches would optimize the irrigation management so water application would properly target the entire root zone.
CONCLUSIONS
Typical observation of irrigation events provides qualitative information, but quantitative measures provided by the blue-dye test are needed to improve irrigation management. The detailed data analysis and results obtained from this field test provided growers with precise information needed for improved irrigation management. An additional result of the blue-dye test data was that growers can decrease fall bell pepper plant row spacing, from 9 inches off the drip line to 8 inches from the drip line. Growers may decide to make this management decision to optimize irrigation scheduling because data revealed lateral water movement plateaued at 9.5 inches from the drip line. By demonstrating the depth and width of water movement in the plant bed, and the amount of water that can be held in the root zone, growers can more effectively determine how to manage and split irrigation events. In addition, this soil profile information assists growers in finding the balance between irrigating and fertigating, to provide necessary plant moisture and nutrients, and decreasing off-site water movement. Overall, the improvement of irrigation management practices in vegetable production saves water usage and reduces production costs. All vegetable crops can be successfully grown in sandy soils, but irrigation management is critical. The blue-dye field study provides a simple and practical method to visualize water movement throughout the soil profile.
ACKNOWLEDGMENTS
The study was funded by the University of Georgia Cooperative Extension, and authors would like to acknowledge Mr. Brandon DeWitt, our grower collaborator, for his support and assistant with field operations
REFERENCES
da Silva, A.L.B.R., Coolong, T., and Diaz-Perez, J. C. (2019). Principles of Irrigation and Scheduling for Vegetable Crops in Georgia. University of Georgia Cooperative Extension Bulletin 1511.
Incrocci, L., Massa, D., and Pardossi, A. (2017). New Trends in the Fertigation Management of Irrigated Vegetable Crops. Horticulturae, 3:37.
Laird, D., Fleming, P., Wang, B., Horton, R., and Karlen, D. (2010). Biochar impact on nutrient leaching from a Midwestern agricultural soil. Geoderma, 158, pp. 436-442.
McCarty, L.B., Hubbard, L.R., and Quisenberry, V. (2016). Soil Drainage. In: Applied Soil Physical Properties, Drainage, and Irrigation Strategies. Springer, Cham.
RStudio Team (2015). RStudio: Integrated Development for R. RStudio, Inc., Boston, MA.
Saefuddin, R., and Saito, H. (2019). Performance of a ring-shaped emitter for subsurface irrigation in bell pepper (Capsicum annum L.) cultivation. Paddy Water Environment, 17:101–107.
Simonne, E., Studstill, D., Dukes, M., Duval, J., Hochmuth, R., McAvoy, G., Olczyk, T., Olson, S., and Lamb, E. (2017). How to Conduct an On-Farm Dye Test and Use the Results to Improve Drip Irrigation Management in Vegetable Production. UF/IFAS Extension EDIS HS980.
USDA, (2020). Soil survey. Web of soil - soil survey Brooks County, Georgia. https://websoilsurvey.sc.egov.usda. gov/App/WebSoilSurvey.aspx.
Wolfe, K., and Stubbs, K. (2018). 2017 Georgia farm gate value report. Center for Agribusiness and Economic Development, University of Georgia, Athens, Georgia, available at: http://caes2.caes.uga.edu/center/caed/pubs/documents/2016CAEDFarmGateValueReport.pdf.