Journal of the NACAA
ISSN 2158-9429
Volume 13, Issue 2 - December, 2020
Assessing the Needs of the Agriculture & Natural Resources Industry in Coshocton County, Ohio
- Marrison, D. L., Associate Professor, The Ohio State University
ABSTRACT
Needs assessments are a critical tool for agricultural extension educators to utilize as they determine the educational needs of their community. This article summarizes a county-based needs assessment developed and conducted in Ohio. The purpose of this assessment was to gauge the subject matter interest for educational programs, producers’ preferred communication channels, and the optimal timing of extension events. One-hundred forty-two individuals responded to the assessment. The information received from this survey will help the Educator develop education programming, county-based research projects, and will serve as an impetus to seek extramural funding.
Introduction:
Extension educators use formal clientele and community needs assessments to identify areas of program concentration and ensure that limited resources are used effectively (Seevers et al., 2007). In an article published in the Journal of Agricultural Education, Harder (Harder, Lamm & Strong, 2009) remarked that Cooperative Extension's role as a relevant provider of nonformal education is dependent upon its ability to improve and adjust in response to internal and external pressures. Needs assessments can aid in Extension's efforts to deliver quality educational programs by pinpointing priority areas in need of improvement (Harder et al.). In short, needs assessments are conducted to determine the needs of the people for whom the organization or system exists (Witkin & Altschuld, 1995).
In September 2018, the author was hired as the OSU Extension Educator for Agriculture & Natural Resources for Coshocton County, Ohio. One of his primary goals was to conduct a comprehensive review of the agricultural community in order to build his Extension outreach and research program.
The first step in the review process was to review the 2017 Census of Agriculture to understand the overall demographics of the county’s agricultural industry. The census reports that Coshocton County has 1,191 farms with a total of 182,555 acres of cropland, woodland, and pastures. Seventy-eight percent of the operations have 50 acres or less. Only 6% farm over 500 acres.
Thirty-seven percent of the producers are classified as full-time farmers and the average age of the principal operators is 54.4 years of age. The average net farm income per farm is $20,966.
The major commodities, ranked based on acreage, are pasture, hay, corn, soybean, wheat, vegetables, and Christmas Trees. Hay is the most commonly grown crop, as 720 farms or 60% raise hay. In comparison, corn, the second leading crop, is grown by 20.8%. Coshocton County has great livestock diversity, with over 7.2 million meat chickens, 71,000 hogs, 21,413 head of cattle, and over 6,000 small ruminants. Forty-six percent of Coshocton County farms (n=542) raise cattle.
The second step was to conduct a formal needs assessment of agricultural producers. The purpose of this assessment was to understand what types of extension education programs would be of interest, what communication channels they preferred, and the optimal timing of extension program and events. Furthermore, the assessment sought to gain insight into how OSU Extension could better serve the needs of the agricultural industry in Coshocton County.
Methods:
The educator conducted a literature review and attempted to find an existing, reliable, and valid survey instrument that was suitable for conducting a needs assessment in a county with a large diversity of agricultural commodities. The search did not result in a ready to use survey. However, the educator was able to obtain a handful of instruments to use as a guide when developing this survey. After developing the assessment, it was reviewed with four farmers to test its comprehension level and for ease of completion.
The survey asked general demographic information such as type of farmer, location, and the type and number of crops & livestock raised. Respondents were asked to indicate which types of extension programs would be of interest to them as producers. A variety of topics were provided in the areas of crop management, commercial horticulture, consumer horticulture, farm management, livestock management, and natural resources. They were also asked to share their interest in thirteen different specialized programs traditionally offered by OSU Extension.
The respondents were also asked to share their preference on the timing of extension programs and the manner(s) by which they wished to be informed about these programs. They were also asked six qualitative questions to better understand what they value about current Extension programming, what could strength the extension program, and what barriers might be limiting the effectiveness of OSU Extension.
Figure 1 and 2 show the survey instrument.
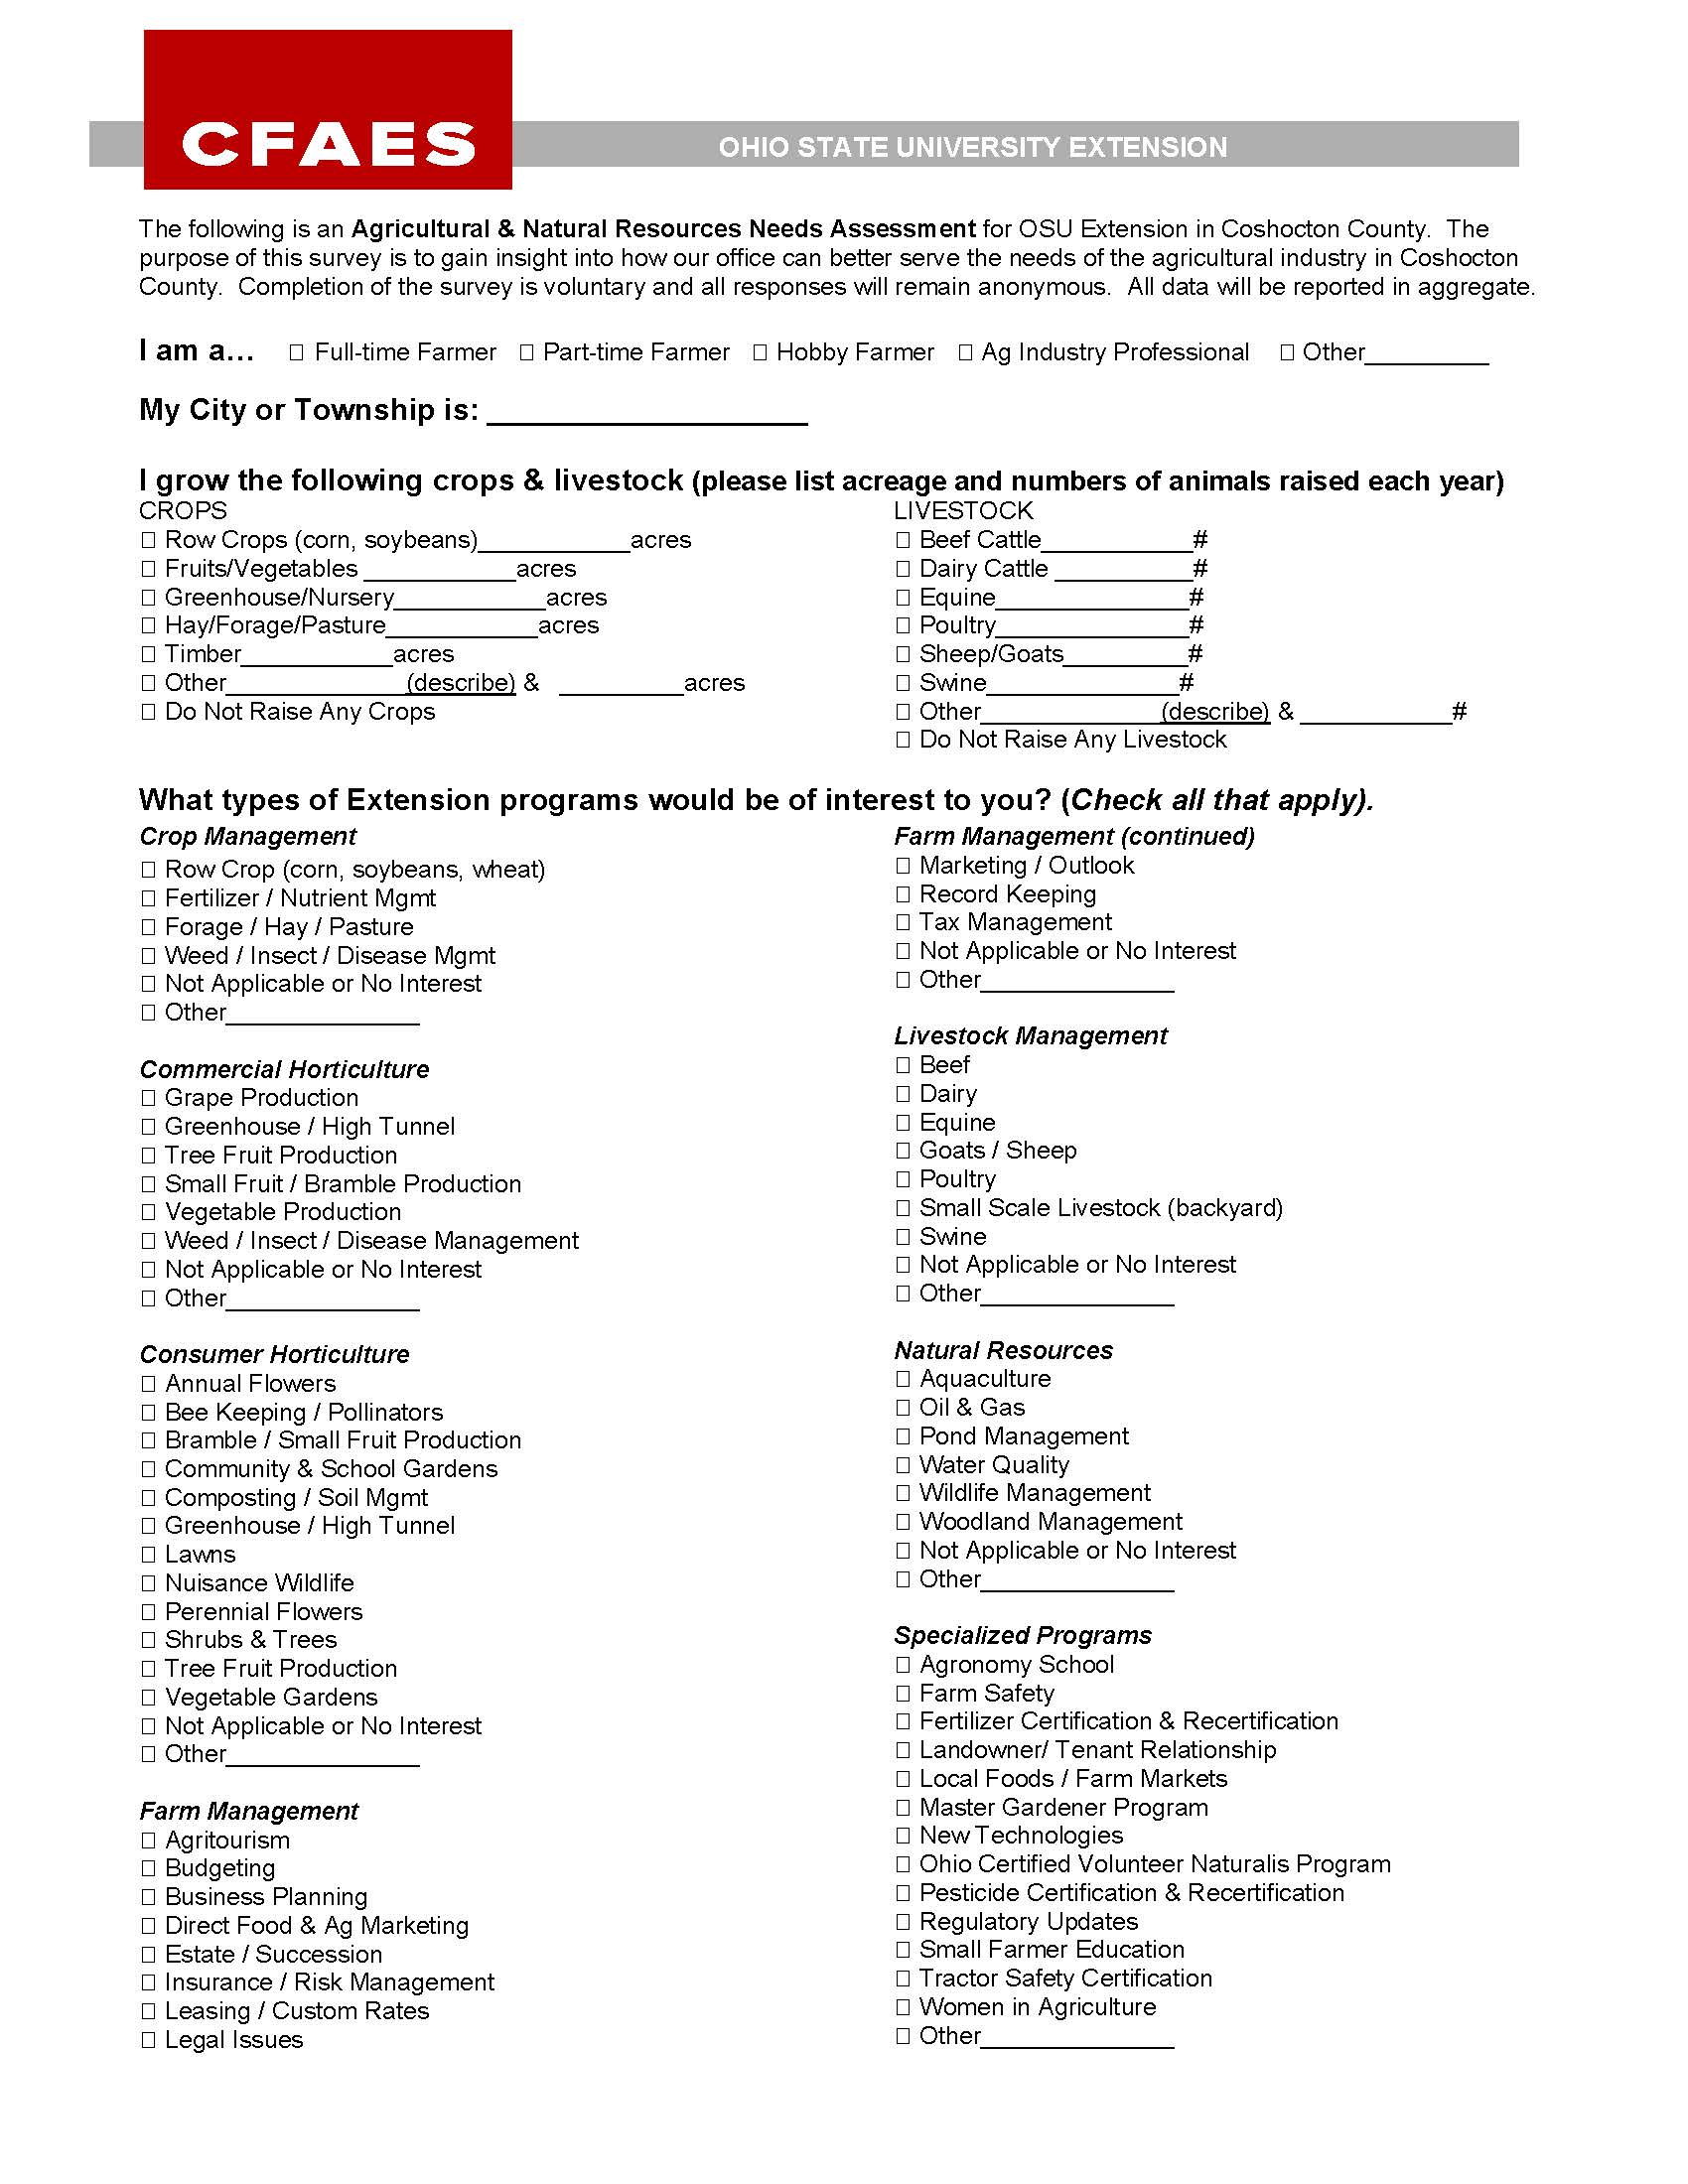
Figure 1: Coshocton County Ag & Natural Resources Needs Assessment, 1st page
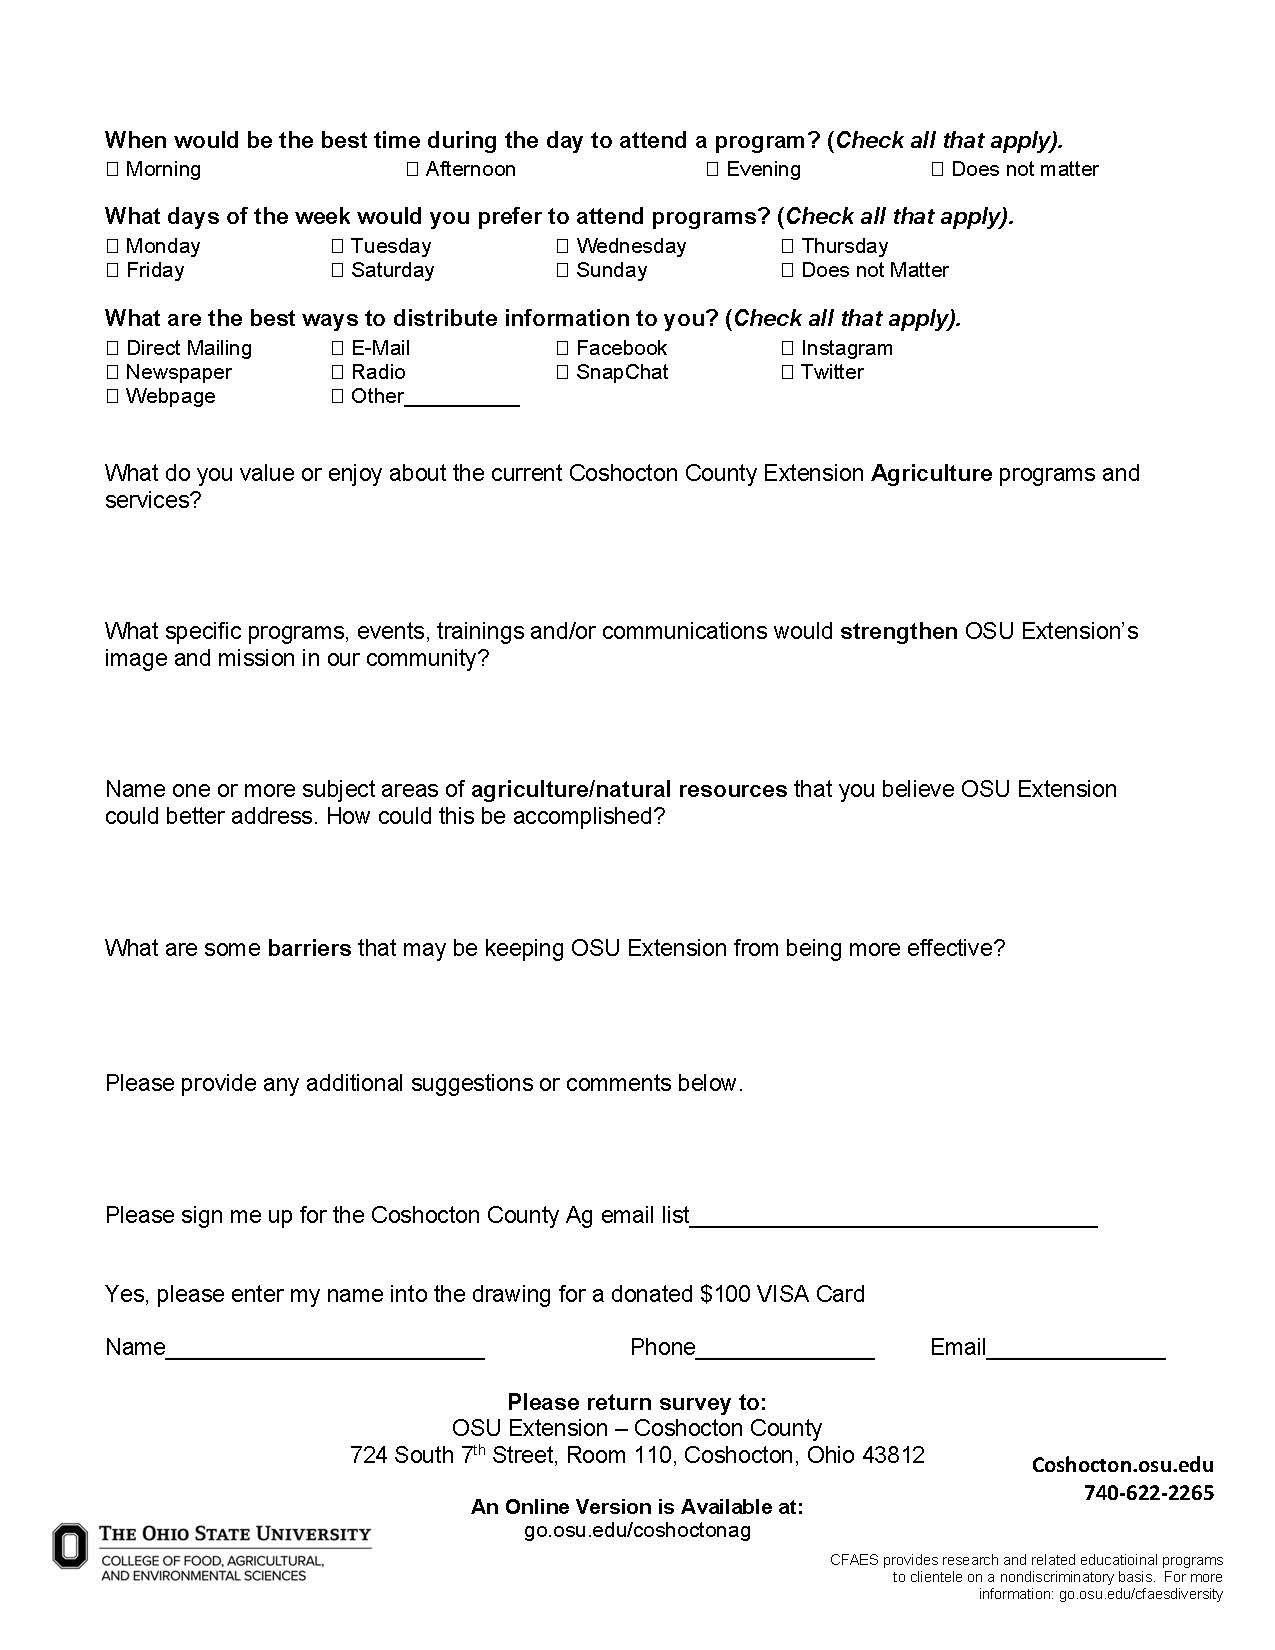
Figure 2: Coshocton County Ag & Natural Resources Needs Assessment, 2nd page
The survey was released in October 2018 with responses taken until October 1, 2019. An announcement of the needs assessment was released at the 2018 Coshocton County fair and a news release was sent to local print and broadcast media.
An initial mailing was made to the 590 farmers who were subscribers to the Coshocton County agriculture mailing list in November 2018. A second mailing was made in August 2019. An electronic invitation was also sent to the emails of 335 producers who had self-subscribed to receive the electronic version of the Agricultural & Natural Resources Newsletter. An online version was also developed using Qualtrics® software for individuals to complete the assessment online. Invitations to producers were extended via social media platforms. The needs assessment was also distributed at a variety of Extension programs and at local agricultural events sponsored by agricultural cooperatives and businesses from October 2018 through October 2019.
Results:
One-hundred forty-two individuals responded to the assessment. Ninety-one or 64.1% completed the paper version with 51 (35.9%) completing the online version. Of these, 43.0% classified themselves as part-time farmers, 35.9% as full-time farmers, 7.7% as hobby farmers, 7.0% as agricultural industry personnel and 6.3% as other.
Regarding acreage farmed, 52.1% (n=74) of respondents indicated raising 35,694 acres of row crops and 67.6% (n=96) reported 10,004 acres of hay/pasture. Almost 28 percent (n=39) reported managing 3,501 acres of timber. Thirteen respondents or 9.2% reported growing 623 acres of vegetable crops and three respondents (2.1%) reported having a collective acre of greenhouse production.
Regarding animals raised, 57.7% (n=82) reported raising 3,965 beef cattle. Fourteen respondents (9.9%) reported raising 929 sheep goats with an additional 9.9% having 65 horses. Twelve producers (8.5%) reported raising 192,042 swine and 6.3% (n=9) raising 1,000,878 head of poultry. Nearly 6% (n=8) reported milking 472 dairy cows and 4.9% reported raising other types of animals such as donkeys, rabbits, dogs and llamas. Twenty-five respondents (17.6%) reported they did not raise any livestock.
Interest in Extension Programs
Respondents were asked to indicate which types of extension programs would be of interest to them. A variety of topics were provided in each of the areas of crop management, commercial horticulture, consumer horticulture, farm management, livestock management, and natural resources. Under each topic, respondents were able to check the specific topics that would be of interest to them.
The area of crop management was popular to respondents (Table 1) as four of the topics rated in the top five for all program topics. The top topic was forage, hay & pasture as it was selected by 65.5% (n=93). This was followed by fertilizer & nutrient management at 57.7% (n=82), weed, insect & disease management at 55.6% (n=79), and row crop production at 45.8% (n=65).
Table 1: Crop Management Topics
|
Crop Management Topics |
Number Respondents |
Percentage |
|
Forage, Hay & Pasture |
93 |
65.5% |
|
Fertilizer & Nutrient Management |
82 |
57.7% |
|
Weed, Insect & Disease Management |
79 |
55.6% |
|
Row Crop (corn, soybeans, wheat) |
65 |
45.8% |
|
Not Applicable or No Interest |
4 |
2.8% |
|
Other |
0 |
0% |
The respondent’s interest in the commercial horticulture area can be viewed in Table 2. Overall interest in these subjects was ranked the lowest, as 24.6% (n=35) reported this subject area was not applicable to them or they had no interest. The top topic was weed, insect & disease management at 14.1% (n=20) followed by vegetable production at 13.4% (n=19) and tree fruit production at 9.2% (n=13).
Table 2: Commercial Horticulture Topics
|
Commercial Horticulture Topics |
Number Respondents |
Percentage |
|
Not Applicable or No Interest |
35 |
24.6% |
|
Weed / Insect / Disease Management |
20 |
14.1% |
|
Vegetable Production |
19 |
13.4% |
|
Tree Fruit Production |
13 |
9.2% |
|
Grape Production |
10 |
7.0% |
|
Greenhouse / High Tunnel |
10 |
7.0% |
|
Small Fruit / Bramble Production |
10 |
7.0% |
|
Other |
3 |
2.3% |
The respondent’s interest in the consumer or homeowner horticulture area can be seen in Table 3. The top interest topic was beekeeping & pollinators as 16.9% (n=24) reported interest. An additional 16.9% (n=24) reported this area was of no interest or not applicable. These responses were followed by vegetable gardens at 16.2% (n=23), perennial flowers at 15.5% (n=22), and composting & soil management at 14.1% (n=20). Nuisance wildlife and annual flowers followed with 12.7% (n=18) then shrubs & trees and tree fruit production were selected by 11.3% (n=16).
Table 3: Consumer Horticulture Topics
|
Consumer Horticulture Topics |
Number Respondents |
Percentage |
|
Bee Keeping & Pollinators |
24 |
16.9% |
|
Not Applicable or No Interest |
24 |
16.9% |
|
Vegetable Gardens |
23 |
16.2% |
|
Perennial Flowers |
22 |
15.5% |
|
Composting & Soil Management |
20 |
14.1% |
|
Nuisance Wildlife |
18 |
12.7% |
|
Annual Flowers |
18 |
12.7% |
|
Shrubs & Trees |
16 |
11.3% |
|
Tree Fruit Production |
16 |
11.3% |
|
Bramble & Small Fruit Production |
15 |
10.6% |
|
Greenhouse & High Tunnel |
10 |
7.0% |
|
Lawns |
9 |
6.3% |
|
Community & School Gardens |
5 |
3.5% |
|
Other |
1 |
1.4% |
The majority of farm management topics were viewed favorably as five of the topics were selected as important by 1/3 of the respondents (Table 4). Tax management and marketing & outlook were both selected as the top farm management topic as each were selected by 40.1% (n=57) of the respondents. Record keeping was next at 38.7% (n=53) followed by legal issues at 34.5% (n=49), estate & succession planning at 33.8% (n=48), and leasing & custom rates at 32.4% (n=46). Three topics were selected by 20% of the total respondents as business planning received 26.1% (n=37) followed by insurance & risk management at 23.2% (n=33) and budgeting at 22.5% (n=32).
Table 4: Farm Management Topics
|
Farm Management Topics |
Number Respondents |
Percentage |
|
Tax Management |
57 |
40.1% |
|
Marketing & Outlook |
57 |
40.1% |
|
Record Keeping |
53 |
38.7% |
|
Legal Issues |
49 |
34.5% |
|
Estate & Succession Planning |
48 |
33.8% |
|
Leasing & Custom Rates |
46 |
32.4% |
|
Business Planning |
37 |
26.1% |
|
Insurance & Risk Management |
33 |
23.2% |
|
Budgeting |
32 |
22.5% |
|
Direct Food & Ag Marketing |
22 |
15.5% |
|
Agri-tourism |
14 |
9.9% |
|
Not Applicable or No Interest |
7 |
4.9% |
|
Other |
1 |
0.7% |
The highest rated topic in livestock management subject area (Table 5) was beef cattle production as 54.2% (n=77) expressed interest. Next was goats & sheep at 13.4% (n=19) followed by respondents who had no interest in animal topics at 12.7% (n=18). Swine was selected by 11.3% (n=16) followed by dairy cattle at 7.7% (n=11), 7.0% for poultry (n=10), 4.9% for small scale livestock (n=7), and equine at 3.5% (n=5). Five respondents marked other which included deer, bees and fish.
Table 5: Livestock Management topics
|
Livestock Management Topics |
Number Respondents |
Percentage |
|
Beef Cattle |
77 |
54.2% |
|
Goats & Sheep |
19 |
13.4% |
|
Not Applicable or No Interest |
18 |
12.7% |
|
Swine |
16 |
11.3% |
|
Dairy Cattle |
11 |
7.7% |
|
Poultry |
10 |
7.0% |
|
Small Scale Livestock (backyard) |
7 |
4.9% |
|
Equine |
5 |
3.5% |
|
Other |
5 |
3.8% |
The top-rated natural resource topic was oil & gas education as 36.6% (n=52) of the respondents reported interest (Table 6). Woodland management followed at 33.8% (n=48), wildlife management at 24.6% (n=35), and water quality at 23.9% (n=34). Pond management was cited by 16.9% (n=24) followed by 7.7% for aquaculture (n=11).
Table 6: Natural Resource Topics
|
Natural Resources Topics |
Number Respondents |
Percentage |
|
Oil & Gas |
52 |
36.6% |
|
Woodland Management |
48 |
33.8% |
|
Wildlife Management |
35 |
24.6% |
|
Water Quality |
34 |
23.9% |
|
Pond Management |
24 |
16.9% |
|
Aquaculture |
11 |
7.7% |
|
Not Applicable or No Interest |
10 |
7.0% |
|
Other |
3 |
2.1% |
Top Twenty Educational Program Topics
Table 7 compiles the top twenty topics for educational programming. Four of the top five topics were from the crop production area. These topics were forage, hay & pasture, fertilizer & nutrient management, weed, insect & disease management and row crop production. Beef cattle production ranked fourth overall.
After the top five topics, the focus area of farm management emerged with nine of the remaining fifteen topics. Farm management topics included in the top 20 included tax management, marketing & outlook, record keeping, legal issues, estate & succession planning, leasing & custom rates, business planning, insurance & risk management and budgeting.
Five natural resource topics ranked in the top twenty. These included oil & gas education, woodland management, wildlife management, water quality and pond management. Rounding out the top twenty topics were the consumer horticulture topics of bee keeping & pollinators.
Table 7: Top Twenty Extension Program Topics
|
Top Twenty Extension Program Topics |
Topic |
Number Respondents |
Percentage |
|
Forage, Hay & Pasture |
Crop Management |
93 |
65.5% |
|
Fertilizer & Nutrient Management |
Crop Management |
82 |
57.7% |
|
Weed, Insect & Disease Management |
Crop Management |
79 |
55.6% |
|
Beef Cattle |
Livestock Management |
77 |
54.2% |
|
Row Crop (corn, soybeans, wheat) |
Crop Management |
65 |
45.8% |
|
Tax Management |
Farm Management |
57 |
40.1% |
|
Marketing & Outlook |
Farm Management |
57 |
40.1% |
|
Record Keeping |
Farm Management |
53 |
38.7% |
|
Oil & Gas |
Natural Resources |
52 |
36.6% |
|
Legal Issues |
Farm Management |
49 |
34.5% |
|
Estate & Succession Planning |
Farm Management |
48 |
33.8% |
|
Woodland Management |
Natural Resources |
48 |
33.8% |
|
Leasing & Custom Rates |
Farm Management |
46 |
32.4% |
|
Business Planning |
Farm Management |
37 |
26.1% |
|
Wildlife Management |
Natural Resources |
35 |
24.6% |
|
Water Quality |
Natural Resources |
34 |
23.9% |
|
Insurance & Risk Management |
Farm Management |
33 |
23.2% |
|
Budgeting |
Farm Management |
32 |
22.5% |
|
Pond Management |
Natural Resources |
24 |
16.9% |
|
Bee Keeping & Pollinators |
Consumer Horticulture |
24 |
16.9% |
Specialized Programs
The needs assessment also asked the respondents to share their interest in thirteen specialized programs traditionally offered by OSU Extension (Table 8). The education provided by OSU Extension to help producers obtain their continuing education requirements for their Fertilizer and Pesticide certification/license from the Ohio Department of Agriculture ranked the highest at 43.0% (n=61) and 35.2% (n=50). The Agronomy School ranked third with 26.8% (n=38) followed by landowner/tenant relationship programs at 25.4% (n=36). Small farmer education was next at 21.8% (n=31) followed by new technologies programming at 21.1% (n=30), and women in agriculture programs at 20.4% (n=29).
Table 8: Specialized Program Area Topics
|
Specialized Program Area Topics |
Number Respondents |
Percentage |
|
Fertilizer Certification & Recertification |
61 |
43.0% |
|
Pesticide Certification & Recertification |
50 |
35.2% |
|
Agronomy School |
38 |
26.8% |
|
Landowner/ Tenant Relationship |
36 |
25.4% |
|
Small Farmer Education |
31 |
21.8% |
|
New Technologies |
30 |
21.1% |
|
Women in Agriculture |
29 |
20.4% |
|
Regulatory Updates |
26 |
18.3% |
|
Farm Safety |
25 |
17.6% |
|
Local Foods / Farm Markets |
20 |
14.1% |
|
Tractor Safety Certification |
18 |
12.7% |
|
Master Gardener Program |
10 |
7.0% |
|
Ohio Certified Volunteer Naturalist Program |
5 |
3.5% |
Program Management
The needs assessment also sought to determine what day and time of the week would be best for programs to be held and how respondents would like to be informed about workshops and events offered by Extension.
When asked the preferred time of the day for workshops to be held, 45.8% (n=65) responded they would prefer evening workshops. Thirty-one percent (n=43) reported it did not matter when programs were held with 11.3% (n=16) preferring afternoon meetings and 9.9% (n=14) preferring morning meetings.
Regarding the day of the week for programs to be held, 50.7% (n=72) responded that it did not matter the day of the week which a program was held. For those who selected specific days, Tuesdays was most preferred at 26.1% (n=37) followed by Wednesday and Thursday each at 23.9% (n=34). The weekend was the least preferred as Saturday was chosen by 5.6% (n=8) and Sunday by 1.4% (n=2).
Respondents were also asked to indicate the different ways in which they would like to receive management information and details on upcoming educational events. The choices included direct mail, email, Facebook®, Instagram®, newspaper, radio, Snap-chat®, Twitter® or via a web page.
Responses indicated two preferred communication channels, as 64.1% (n=91) preferred to be notified by email and 55.6% (n=79) via direct mail. Facebook® was ranked at 13.4% (n=19), newspaper at 11.3% (n=16), and by radio at 11.3% (n=16).
Qualitative Assessment
Respondents were also asked to respond to five qualitative questions. In total 139 written comments were provided for the five open-ended questions that were asked.
Fifty-seven respondents shared responses about what was valued or enjoyed about the current agricultural programs and services offered in the county. Respondents appreciate the variety of educational programs offered including pasture walks, agronomy schools, pesticide re-certification, and livestock programs. Respondents also remarked favorably about the expertise of the staff and their willingness to help and find answers. The economic value of attending Extension programs was also cited as a strength.
Twenty-nine responses were given to the question that asked what specific programs, events, trainings, and/or communications would strengthen OSU Extension’s image and mission in the community. Respondents were complimentary of existing programs and advocated for them to continue. For areas of future emphasis, it was suggested to offer programs in tax and business management and other programs that would help farmers make good business decisions. Estate and succession planning as well as beef and forage management programs were also listed as needs. Additionally, it was mentioned that OSU Extension could work to build the capacity of farmers in direct marketing to consumers. Education about healthy local food and healthy lifestyles was also suggested. Respondents also advocated for the Extension office to continue to educate on “what Extension does” and to keep communicating through the local print media and on the local radio station.
Twenty-seven responses provided a wide variety of input in response to the question on the agriculture/natural resources subject areas that could be better addressed. The topics that received the most comments (n=3) were hay and pasture management, water quality and nutrient management. Other topics of interests included: farm forest management, food safety, weed management, herbicide use, farm family health insurance, and beef production. A few suggestions were also made about engaging with local schools to increase the skills of high school students in home gardening and basic agriculture principles.
Nineteen responses were provided to the question that asked what barriers may be keeping OSU Extension from being more effective. One barrier noted was the perception that Extension programs are only for farmers and that continued promotion of our programs is crucial as Extension has something to offer all residents. Funding was also listed as barrier and sometimes the timing of programs prevents people from attending.
Seven persons provided additional suggestions or comments to the survey. The comments were complimentary of the services that OSU Extension in Coshocton County provide. It was suggested to continue to build the email contact list as a way to build communication.
Discussion:
Overall, the Coshocton County Needs Assessment indicated the existing agricultural and natural resources extension program has been effective in its outreach efforts for the Coshocton County Community. However, the results of the analysis will prove valuable to the Educator as he develops an education and research plan for the county in cooperation with local Agricultural & Natural Resources Advisory committee.
Some of the key programming needs identified from the needs assessment include:
- Increase educational programming in the areas of beef cattle production and forage (pasture & hay production).
- Continue offering the high quality agronomic, fertilizer, pesticide, and water quality education programs. Find ways to enhance these programs by conducting local on-farm research.
- Increase the educational programming in farm management to include more education in tax management, marketing, record keeping, leasing, business planning, and landowner/tenant relationships.
- Increase legal education especially including farm estate and succession planning.
- Enhance natural resource education focusing on oil & gas, woodland, and wildlife management.
Regarding program management, most of the existing program offerings have been offered at times that meet the needs of the community. In recognition of the large percentage of part-time farmers, it is essential that programs be offered as mid-week evening programs. Furthermore, weekend programs should be avoided.
The results also indicated that clientele prefer to be reached through email and direct mail. However, the advisory committee recommends the enhancement of communication through electronic media and believe the existing outreach efforts through print, broadcast and social media are helping connect Extension to the non-agricultural community. This was also validated in the qualitative responses.
This survey could be replicated by other educators as they consider the educational needs of their clientele. Needs assessments, formal or informal, are a necessary process for Extension programming. The information received from this survey will help the Educator develop education programming, on-farm research projects, and will serve as an impetus to seek extramural funding.
Literature Cited:
Harder, A., Lamm, A., Strong, R. (2009). An Analysis of the Priority Needs of Cooperative Extension at the County Level, Journal of Agricultural Education, v50 n3, 11-21. Available at: https://eric.ed.gov/?id=EJ871211
Witkin, B. R., & Altschuld, J. W. (1995). Planning and conducting needs assessments: A practical guide. Thousand Oaks, CA: Sage.
Dill, S.P, Miller, J.O, McCoy, T. and Rhodes, J. (2012). Maryland Eastern Shore Agriculture Needs Assessment, Volume 10, Issue 1. Available at: https://www.nacaa.com/journal/index.php?jid=728
Seevers, B., Graham, D., & Conklin, N. (2007). Education through Cooperative Extension (2nd ed.). Columbus, OH: The Ohio State University.
United States Department of Agriculture - National Agriculture Statistics Service (USDA-NASS). (2017). Quick Facts. Retrieved August, 2020, from https://www.nass.usda.gov/Publications/AgCensus/2017/index.php