Journal of the NACAA
ISSN 2158-9429
Volume 13, Issue 2 - December, 2020
On-Farm Furrow Irrigation Technology Demonstrations in Louisiana
- Conger, S. L. D. , Assistant Professor, State Irrigation Specialist, LSU AgCenter
Frazier, R. L., Madison Parish Extension Agent, LSU AgCenter
Garner, B., West Carroll Parish Extension Agent, LSU AgCenter
Burns, D., Tensas Parish Extension Agent, LSU AgCenter
Lee, D. R., East Carroll Parish Extension Agent, LSU AgCenter
Miller, K., Concordia Parish Extension Agent, LSU AgCenter
ABSTRACT
This project was designed to demonstrate that furrow irrigation technologies improve irrigation efficiency on production farms. Non-replicated results showed water savings attributable to the surge valve, followed by the soil moisture sensor. The demonstrations illustrated the importance in developing trustful relationships with partner producers; these established relationships aided in building value in the technology for management and labor decisions that potentially contributed to economic savings and conservation potential. In some cases, the gained knowledge created the necessary environment for future behavioral change.
Introduction
The competition for agricultural water supplies continues to increase in Louisiana due to many factors including drought periods, increasing irrigated acreage, and demand from other sectors like industry, power generation, public supply, and aquaculture (LDOTD and USGS, 2018). Irrigated acreage for row crops such as corn, cotton, soybean, and sorghum have increased from 35% in 2011 to 56% in 2019 (Farm Service Agency, 2020). Though surface water remains plentiful from frequent rainfall inherent to the humid climate, agricultural irrigation primarily relies on steadily declining groundwater resources (LDOTD and USGS, 2018; LGWRC, 2012). Thus, a technological transfer that can improve current irrigation practices on production farms is imperative to raise irrigation efficiency and move toward sustainable water management.
One approach to addressing agricultural water challenges is to implement commercially available technologies to current irrigation systems that have the potential to improve irrigation efficiency without requiring farmers to invest in costly new infrastructure. Market-ready technologies available for furrow irrigation, the primary irrigation method in the mid-South, include computerized hole selection, surge valves, and soil moisture sensors (Bryant et al., 2017). When used in combination, these tools were expected to increase irrigation efficiency by managing hydraulics within the pipe, improving infiltration, minimizing surface runoff, and informing the producer of below-surface soil moisture conditions. However, the reality of producers consistently using these technologies effectively may not be practical without education that encourages the adaptation of the technologies into their operation.
The intended objective of this project was to assess whether these technologies could improve on-farm furrow irrigation efficiency through a direct comparison of water use efficiency across paired on-farm fields or irrigation sets with similar environmental characteristics. For uncontrollable reasons, few farmers were able to follow through with differentiating the paired fields by the treatment definitions. Thus, the objective of this paper was to explore some of those reasons and provide an evaluation of the study’s outcome to help inform future studies of a similar nature.
Materials and Methods
Irrigation demonstrations were conducted during the summer crop seasons of 2015 and 2016 by agriculture and natural resource extension agents in five parishes located along the Mississippi River in the Louisiana Delta (Figure 1). In each parish, agents selected a partner producer that agreed to allow technological changes to their normal irrigation practices in one field or irrigation set, referred to as the demonstration (DEMO) treatment. The partner producer also agreed to allow monitoring of irrigation application and provide yield data from a similar field or irrigation set for comparison, referred to as the farmer standard (FSTD) treatment. The partner producer was asked to manage FSTD as part of their normal operations and did not receive any equipment. These two treatments, DEMO and FSTD, were implemented on each partner producer's farm.
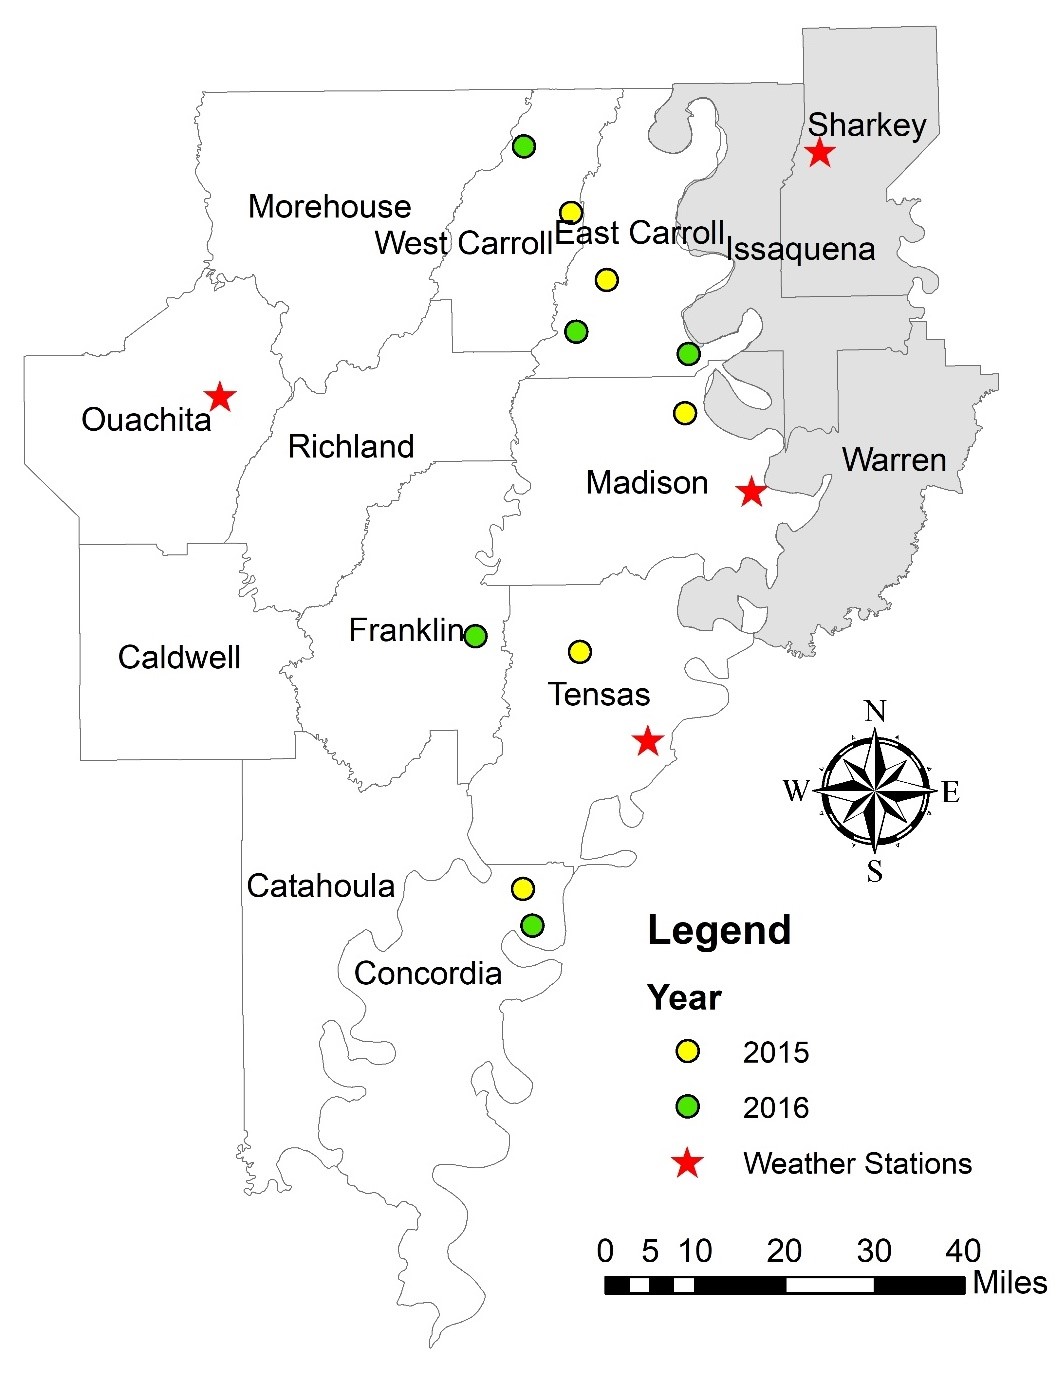
Figure 1. Demonstrations were conducted in collaboration with partner producers primarily located in the five Louisiana parishes of Concordia, Tensas, Madison, East Carroll, and West Carroll. Temperature and precipitation data were collected from four weather stations across Louisiana (white) and Mississippi (gray) that represent the area.
The technologies implemented on DEMO fields were selected to improve the already existing furrow irrigation system without making significant modifications to the system design. The readily available technologies per DEMO included computerized hole selection, surge valve, and soil moisture sensor. Computerized hole selection was performed using Pipe Planner (Delta Plastics, Little Rock, AR) for each farmer if the farmer had not utilized some form of this technology already. Prior to the study, surge valves (P&R Surge Systems, Inc., Lubbock, TX) in the appropriate size were already on-hand for demonstration purposes in four of the five parishes. Thus, one additional valve and five Aquaspy soil moisture sensors (Aquaspy, Inc., San Diego, CA) were purchased for this project directly from a local distributor. The soil moisture sensors collected soil moisture estimations from twelve depths, spaced 4 inches apart from 4 inches to 48 inches, which allowed monitoring from a majority of the root zone. As part of the purchase, the distributor handled the installation of all five sensors in coordination with the farmer and extension agent during the first year of the study. Sensor data was accessed through a website using telemetry services. The extension agents were asked to utilize these technologies while accessing only publicly available instructional material to simulate the farmer’s readily available resources.
In addition to the equipment used as part of DEMO, environmental data was collected to estimate irrigation application by each treatment and the net irrigation requirement, defined as the estimated amount of irrigation required to maintain well-watered conditions during critical growth periods of the crop. Both fields in each parish were outfitted with propeller flow meters (McCrometer, Inc., Hemet, CA) mounted on aluminum tubes with straightening vanes to measure irrigation application. A tipping bucket rain gauge with HOBO pendant data logger (Onset Computer Corporation, Bourne, MA) was installed at each soil moisture sensor location to capture rainfall events throughout the season. Publicly available daily weather data, including rainfall, was collected from the National Centers for Environmental Information website managed by the National Oceanic and Atmospheric Administration (Menne et al., 2012).
The irrigation requirement for each demonstration was estimated by the soil water balance method (Davis and Fromme, 2016). This method, also commonly called the checkbook method, accounts for changes in soil moisture status from rainfall, irrigation, and crop evapotranspiration (ETC) within the designated root zone. Given the rural nature of the area, temperature and precipitation were the most reliable weather variables at each weather station. Thus, reference evapotranspiration (ETO) was calculated using the temperature-based Hargreaves Equation (Hargreaves and Samani, 1982) and adjusted for the crop with average crop coefficients for soybean (Allen et al., 1998) to estimate water losses from the soil profile. Soil physical properties that affect soil-water movement were determined using web soil survey for each field (Soil Survey Staff, 2019).
Soil moisture levels from the Aquaspy sensors were reported in units of ‘moisture value’ that approximated the percentage of moisture available in the soil. For example, a moisture value of 100% best represented field capacity and a moisture value of 0% best represented permanent wilting point. Since soil moisture can reach levels above field capacity (i.e. saturation), there were times when the moisture values exceeded 100%. The soil water balance provided a volumetric water content ranging from permanent wilting point to field capacity with estimations of these values gathered from the soil survey. Instead of adjusting both datasets to fit one scale, they were graphed for comparison with independent y-axes that were aligned at field capacity and permanent wilting point approximations.
Results and Discussion
Weather Conditions
Common to Louisiana’s typical hot-humid subtropical environment, the 2015 and 2016 growing seasons for agronomic grain crops experienced high evapotranspirative demand (Figure 2) and variable rainfall (Figure 3). The winter months separating these growing seasons were reasonably mild with frequent rains typical to the area.
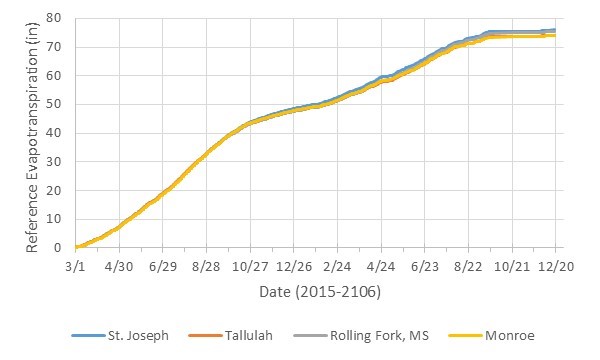
Figure 2. Cumulative ETO were totaled when daily values were available for all four weather stations from March 2015 through December 2016.
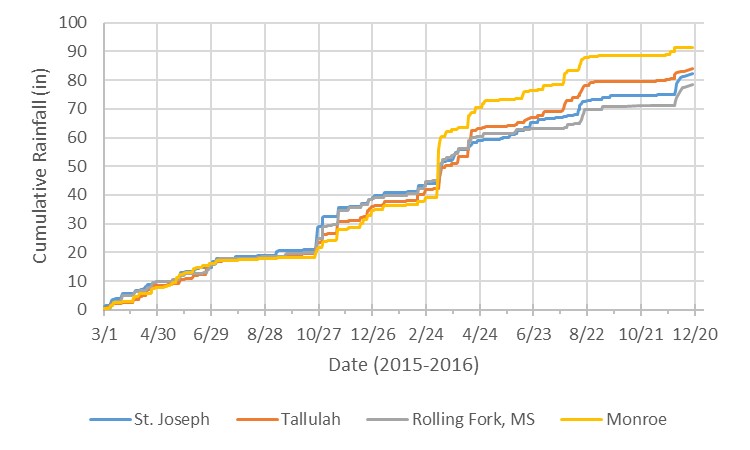
Figure 3. Cumulative rainfall was calculated occurring March 2015 through December 2016 when data was available for all four weather stations.
Out of the four weather stations with available temperature data for calculating ETO, two stations (Madison and Ouachita) provided daily values for the entire evaluation period (Table 1). The weather stations in Tensas and Sharkey had 95% and 70% of temperature data available, respectively. For comparison, cumulative ETO was calculated when all four stations had available data; totals had little variation, ranging from 74-76 inches, indicating that evapotranspirative demand was consistent across the demonstration area. Given this outcome, ETO calculated using temperatures from Madison was used in all analyses.
Table 1. Summary of cumulative daily ETO and rainfall using all available data, percentage of the study period with daily values available, and cumulative ETO and rainfall using only days when data was available from all four weather stations. Location names correspond to counties where the station was located as shown in Figure 1.
| Reference Evapotranspiration | Reference Evapotranspiration | Reference Evapotranspiration | Rainfall | Rainfall | Rainfall | |
| Location | Cumulative Total (in) | Available Data (%) | Comparative Total*(in) | Cumulative Total (in) | Available Data (%) | Comparative Total (in) |
| Tensas | 106 | 95 | 76 | 100 | 97 | 82 |
| Madison | 109 | 100 | 74 | 114 | 100 | 84 |
| Sharkey | 79 | 70 | 75 | 84 | 87 | 79 |
| Ouachita | 108 | 100 | 74 | 112 | 100 | 91 |
|
*Comparative totals take into account missing data to determine if the stations were providing reasonably similar results across the geographical area. |
|||||||
Rainfall, on the other hand, was more variable across the region. Similar to temperature data availability, rainfall values were available for 87% of days in Sharkey, 97% of days in Tensas, and 100% of days for Madison and Ouachita. It appeared that all locations received rainfall on a majority of the same days across the study period, but quantities were variable (Figure 3). Cumulative rainfall totals from only periods with available data ranged from 79 inches to 91 inches. With respect to irrigation, drought-like conditions occurred from July through October 2015 and again from September through November 2016.
The 2015 Growing Season
Irrigation was necessary during the 2015 crop season to maintain well-watered conditions given that at least a portion of critical growth stages across all soybean varieties and planting dates fell within the identified drought-like period (July-October). Environmental conditions during this time placed the irrigation systems on DEMO farms under severe pressure to irrigate the crop adequately. Realizing the value of the soil moisture data, partner producers on many of the FSTD fields followed the irrigation schedule of DEMO that was determined from sensor data. As a result, there were very little treatment differences across locations and those differences were mostly attributed to the addition of the surge valve. Despite these issues, there were two study locations where a majority of the data was collected and results could be analyzed.
In Madison Parish, there was 13.9 in of water applied to DEMO, resulting in 24% water savings by utilizing these irrigation technologies compared to FSTD, which applied 18.3 in of water (Table 2). There was no sacrifice in yield from a reduction in irrigation application, averaging 70.2 bu/ac and 69.7 bu/ac for DEMO and FSTD, respectively. This reported reduction in water application falls in line with research from Arkansas and Mississippi that showed these same technologies reduced water use for soybean by 21% across three years and twenty on-farm locations (Bryant et al., 2017). For comparison, our partner producer cut 38 bu/ac of soybean grown on similar but unirrigated land during the same crop season.
Table 2. Summary of 2015 results for Madison and West Carroll Parishes for each treatment.
| Madison | Madison | West Carroll | West Carroll | |
|---|---|---|---|---|
| Description | DEMO | FSTD | DEMO | FSTD |
| Irrigated Area (ac) | 64 | 26 | 55 | 30 |
| Yield (bu/ac) | 70.2 | 69.7 | 45 | 45 |
| Irrigation Application (in) | 13.9 | 18.3 | 9.2 | 9.8 |
| Runtime for First Event (h) | 38 | ---* | 40 | --- |
| Water Savings (%) | 24 | 0 | 7 | 0 |
*Dashes indicate that values were not available.
Soil moisture measured during the study period was modeled using the soil water balance and data collected by the extension agent (Figure 4). Based on previous evaluations of this soil water balance model, it was already known that some error exists in the lack of consideration for infiltration restrictions of the soil (Davis and Fromme, 2017). Thus, there were a few instances where the change in soil moisture from the prediction was largely different from the measured soil moisture. However, the trend in changing soil moisture is more important than the absolute value for on-farm, real world irrigation decisions. Thus, it was determined that the soil water balance could be used to predict an ideal irrigation schedule, or what should have been applied. *Dashes indicate that values were not available.
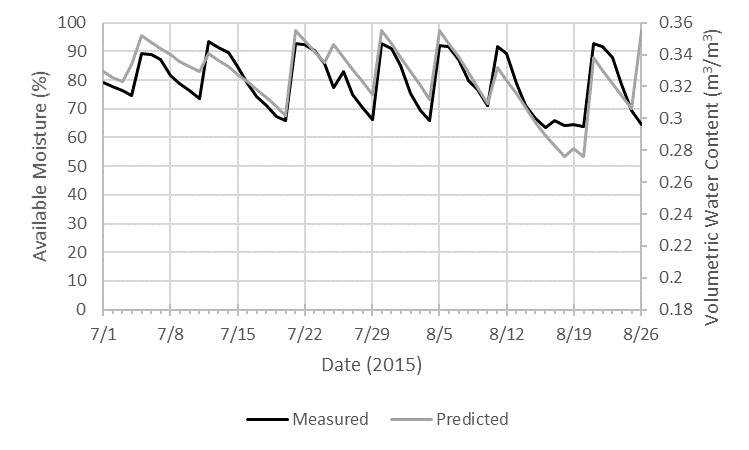
Figure 4. Soil moisture was measured by the soil moisture sensor as well as predicted by the soil water balance for Demo conducted in Madison Parish. Dates represent when the sensor data was collected and not the entire crop season.
In West Carroll Parish, the field selected by the partner producer for DEMO was historically difficult to irrigate efficiently.. This particular field had extremely long rows reaching more than 3,000 ft in length on cracking clay soil; the extended length of these rows naturally lengthened the time needed to move water from the irrigation tubing to the end of the furrows. The partner producer had indicated that irrigation events were never successfully completed (i.e. water never reached end of the furrows) on this particular field. Thus, it was hypothesized that technological irrigation strategies were necessary to evenly distribute water across the field within a reasonable timeframe of 24-36 hours as suggested by LSU AgCenter crop specialists.
Initially, rainfall maintained enough soil moisture during non-critical growth stages. The field received a large rainfall event in early July as the crop transitioned into the critical reproductive period (Figure 5). Because of this rainfall event, the bottom third of DEMO was flooded for approximately one week. In some situations, a large rainfall event does not equate to a large amount of lasting soil moisture due to surface runoff, deep percolation, and increased evapotranspiration from having readily available water. This was evidenced by sensor data where soil moisture rarely stayed near field capacity for longer than approximately 1-3 days before quickly declining.
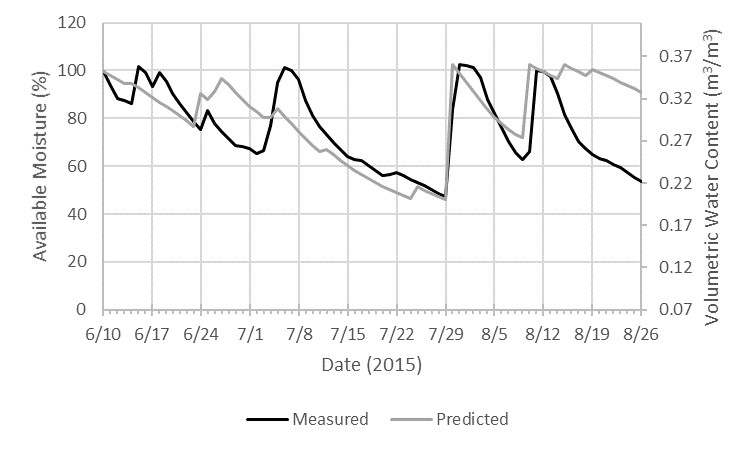
Figure 5. Soil moisture was measured by the soil moisture sensor as well as predicted by the soil water balance for Demo conducted in West Carroll Parish. Dates represent when the sensor data was collected and not the entire crop season.
Due to other factors, the partner producer chose to delay irrigation initiation for two weeks after the recommendation by the agent. At the point of irrigation, the portions of the field that were not flooded previously had developed large cracks throughout the soil profile (Figure 6). Water was needed to cause swelling of the cracked clay soil, but this water was bound to the soil and not available to the plant. Thus, irrigation continued beyond closing the soil cracks to provide plant available water. In this case, 5.2 inches of water was applied over 40 hours for the first irrigation of DEMO instead of the normal 2-3 inches for typical furrow irrigation applications. For comparison, there were 6.1 inches applied for the first irrigation event to FSTD. Thus, the surge valve provided 15% reduction in irrigation application. Additionally, the surge valve increased efficiency in moving water over the field and, for the first time, irrigation water was observed reaching the end of the furrows.
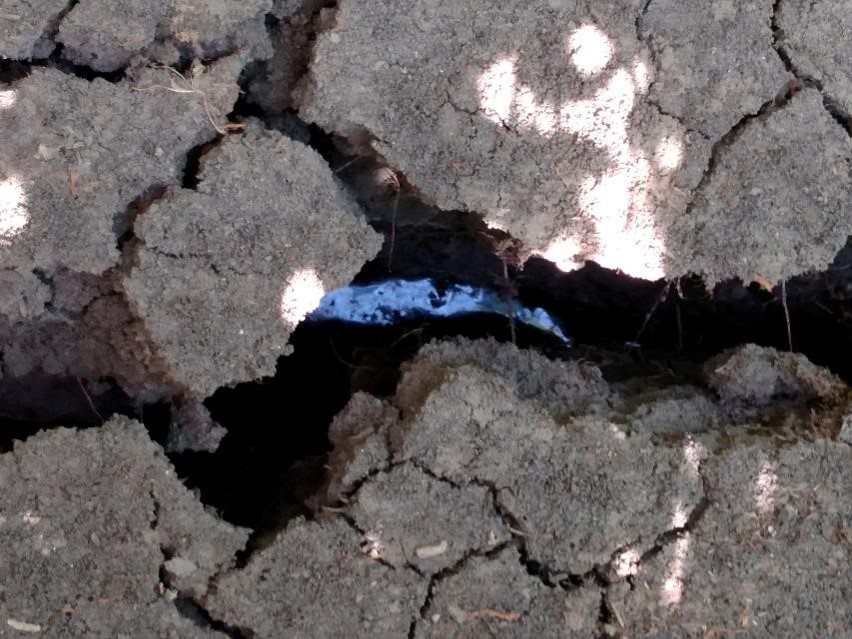
Figure 6. Image of the cracked soil of an irrigation furrow during the beginning of the first irrigation event for Demo in West Carroll Parish. The sunlight catches the reflection of water running from left to right. Photo Credit: Bruce Garner
By the end of the irrigation season, there were 9.2 inches of water applied to DEMO and 9.8 inches applied to FSTD, resulting in only 7% water savings. There was one additional full irrigation event before termination and two partial irrigation events that were turned off early due to receiving some rainfall. More water was applied to DEMO than FSTD during the partial event, resulting in less seasonal water savings than expected.
Average yield for each treatment field was the same, 45 bu/ac, which was an expected outcome since they were managed identically (Figure 2). However, the yield from these fields averaged much lower than the parish average and were not much higher than local averages of unirrigated soybean yields. Using the breakdown of the soil moisture data from each sensor (Figure 7), the agent aided the partner producer with visualizing the water stress occurring over time during the critical growth stages of the crop. Afterward, the partner producer gained knowledge of how irrigation was necessary earlier in the month and was able to get a better picture of how to assess plant health using information from below the soil surface.
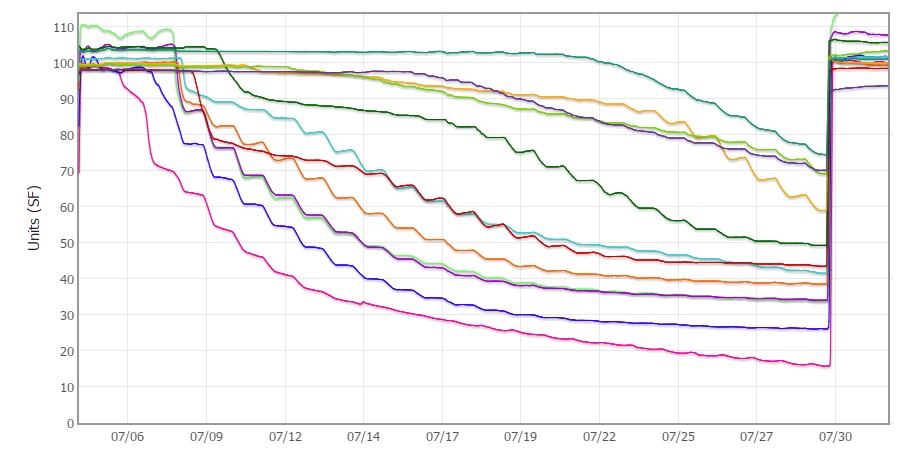
Figure 7. Zoomed-in screenshot of soil moisture values from each of the twelve sensors during the critical growth stages and before irrigation initiation. Water stress occurs as the stair stepping trend become less steep until the lines flatten, indicating that the plants can no longer access any water at all. In general, the shallowest sensors had the most water removed (bottom lines) whereas the deepest sensors began to decline after the shallower sensors flattened.
For practical purposes, predicted soil moisture estimated from the soil water balance was a good estimation of measured soil moisture averaged from the active root zone. Given this result, the soil water balance was used to estimate the ideal irrigation schedule. This ideal schedule represents the scientifically determined irrigation schedule that would be recommended through normal extension outlets once variables were adjusted for specific environments. Since the soil water balance was specifically designed for furrow irrigation practices, assumptions include initiating irrigation after V10 growth stage, terminating irrigation by R6.5 growth stage, and assigning an irrigation event when at least one inch should be applied.
The ideal irrigation schedule for the fields in Madison Parish followed the same trend as what was actually applied (Figure 8). There were two obvious differences: 1) irrigation occurred 1-2 days after the ideal schedule predicted irrigation need, and 2) the ideal schedule included two additional irrigation events toward the end of the season, on August 16th and August 24th. The 1-2 day delays in irrigation could easily have been attributed to normal operational limitations such as scheduling conflicts, limited farm labor, distance between farmer’s location and field location, etc. Overall, DEMO was irrigated appropriately considering these limitations as well as all of the assumptions and generalizations within the soil water balance.
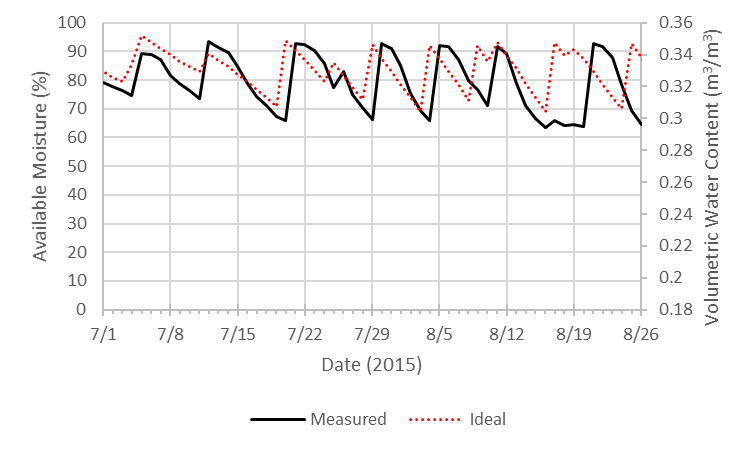
Figure 8. In Madison Parish, the measured soil moisture was compared to ideal soil moisture estimated from the soil water balance by scheduling an irrigation event if at least one inch were required during the critical growth stages only.
The ideal irrigation schedule for West Carroll Parish included seven irrigation events throughout the crop season (Figure 9). However, one event scheduled for June 21st was likely erroneous due to inaccuracy in estimating localized rainfall amounts. This erroneous event did not affect the remaining schedule once a significant irrigation or rainfall event occurred and reset both to field capacity. Based on the ideal schedule, there were three potential irrigation events missed prior to actual initiation. Though the agent chose the appropriate time at the beginning of July to discuss irrigation with the partner producer, initiation was delayed by the partner producer due to other unforeseen factors.
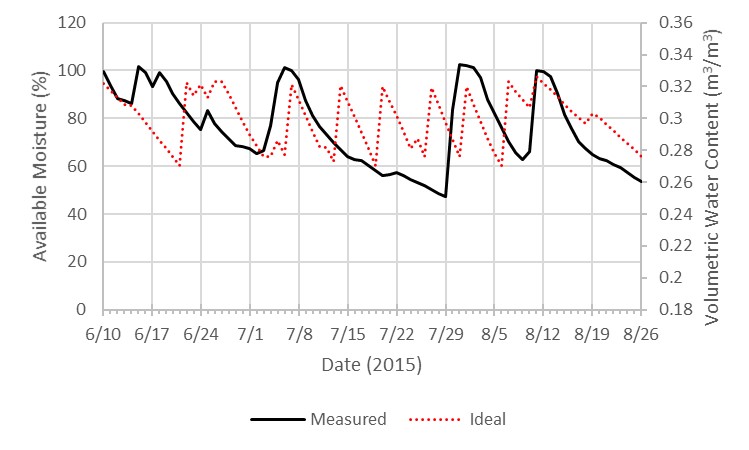
Figure 9. In West Carroll Parish, the measured soil moisture was compared to ideal soil moisture estimated from the soil water balance by scheduling an irrigation event if at least one inch were required during the critical growth stages only.
The 2016 Growing Season
Though the study was repeated in 2016, there was much less need for irrigation during the crop season. Simulations from the soil water balance showed that between 2-4 irrigation events were required to maintain well-watered conditions, with the lowest need from a June 1st planting (late) and highest need from an April 1st planting (early). In a typical year, required irrigation increases as planting dates become later, but unusual August rains on 58% of days that amounted to 6.9 inches to the area resulted in a reversed trend.
Irrigation application and yield results were reported from four parishes at the end of the crop season (Table 3). Yields were not different across treatments, which was expected given the lack of irrigation required. Reports from East Carroll Parish showed the most seasonal water savings from both years without sacrificing yield. Madison Parish also reported good yield, but irrigation for FSTD could not be verified. From Tensas Parish, the partner producer was able to delay irrigation for DEMO by three days and was on-track to eliminate one irrigation event from the crop season if rainfall had not intervened. The partner producer from West Carroll Parish attempted irrigation but was stopped due to receiving rainfall resulting in no effective irrigation application.
Table 3. Summary of yield and irrigation application totals from on-farm irrigation demonstrations conducted in 2016.
| Yield (bu/ac) | Yield (bu/ac) | Irrigation Application (in) | Irrigation Application (in) | |
| Parish Location | DEMO | FSTD | DEMO | FSTD |
| East Carroll | 80 | 78 | 2.5 | 6.9 |
| Madison | 75 | 75 | 7.8 | ---* |
| Tensas | 58** | 58** | 7.0 | 9.0 |
| West Carroll | 51 | 51 | 0 | 0 |
*Irrigation occurred prior to installing the flow meter on FSTD, so a season total could not be reported.
**Yield was not measured independently for each field, but was an average across all fields for this partner producer.
Conclusion
On-farm demonstrations of irrigation technologies for furrow irrigation systems were insightful and educational, but were not particularly standardized due to situations that were site-specific. The most consistent water savings occurred due to the surge valve, which was the only consistent difference between the treatments. Following the surge valve, the soil moisture sensor was beneficial for efficient irrigation timing. However, the partner producers took advantage of their access to available soil moisture data resulting in very little treatment differences from irrigation scheduling. In some cases, such as in West Carroll Parish in 2015, the partner producer gained knowledge concerning the importance of maintaining adequate soil moisture for overall crop health by using these technological tools. After these experiences, it became clear that the importance of the demonstration was in illustrating the value of the technologies in terms of management and labor decisions as opposed to just economic savings and conservation potential.
Literature Cited
Allen, R. G., Pereira, L. S., Raes, D., Smith, M. (1998). Crop Evapotranspiration: Guidelines for Computing Crop Water Requirements, Irrigation and Drainage Paper No. 56 Ed., United Nations Food and Agriculture Organization, Rome, Italy.
Bryant, C. J., Krutz, L. J., Falconer, L., Irby, J. T., Henry, C. G., Pringle III, H. C., Henry, M. E., Roach, D. P., Pickelmann, D. M., Atwill, R. L., & Wood, C. W. (2017). Irrigation water management practices that reduce water requirements for Mid-South furrow-irrigated soybean. Crop, Forage, and Turfgrass Manage. http://doi.org/10.2134/cftm2017.04.0025
Davis, S. L. & Fromme, D. D. (2016). Scheduling Irrigation for Agronomic Crops Using Estimation Methods, LSU AgCenter Publication No. 3559, Available at: https://www.lsuagcenter.com/~/media/system/9/1/a/2/91a2bcafc8a148c8675d81ba888b1adf/pub3559%20-%20schedulingirrigationforagronomiccrops_finalpdf.pdf, Accessed on 13 September 2019.
Davis, S. L. & Fromme, D. D. (2017). STAMP decision tool for agronomic crops in Louisiana. Irrigation Association. Available at: https://www.irrigation.org/IA/FileUploads/IA/Resources/TechnicalPapers/2017/STAMPDecisionToolForAgronomicCropsInLouisiana.pdf Accessed on April 1, 2020.
Louisiana Department of Transportation and Development [LDOTD] & U. S. Geological Survey [USGS]. (2018). Water Use in Louisiana, 2015. Water Resources Special Report No. 18. Available at: https://wise.er.usgs.gov/dp/pdfs/WaterUseinLouisiana_2015.pdf Accessed on April 1, 2020.
Farm Service Agency. (2020). Crop Acreage Data. United States Department of Agriculture. Available at: https://www.fsa.usda.gov/news-room/efoia/electronic-reading-room/frequently-requested-information/crop-acreage-data/index Accessed on April 1, 2020.
Hargreaves, G. H. & Samani, Z. A. (1982). Estimating potential evapotranspiration. J. Irrig. Drain. Eng., 108(3): 225-230.
Louisiana Ground Water Resources Commission [LGWRC]. (2012). Managing Louisiana’s Groundwater Resources with Supplemental Information on Surface Water Resources: An Interim Report to the Louisiana Legislature. Available at: http://dnr.louisiana.gov/index.cfm?md=pagebuilder&tmp=home&pid=907 Accessed on April 1, 2020.
Menne, M.J., Durre, I., Korzeniewski, B., McNeal, S., Thomas, K., Yin, X., Anthony, S., Ray, R., Vose, R. S., Gleason, B. E., & Houston, T. G. (2012). Global Historical Climatology Network - Daily (GHCN-Daily), Version 3. NOAA National Climatic Data Center. http://doi.org/10.7289/V5D21VHZ Accessed on May 4, 2019.
Soil Survey Staff, Natural Resources Conservation Service, United States Department of Agriculture. Web Soil Survey. Available at: https://websoilsurvey.sc.egov.usda.gov/ Accessed on May 5, 2019.