Journal of the NACAA
ISSN 2158-9429
Volume 14, Issue 1 - June, 2021
4-H/FFA Turkey Dressing Percentage Calculation Tool
- Dallin, J. , Extension Faculty-Box Elder County, Utah State University
Hadfield, J.A., Extension Faculty- Cache County, Utah State University
Pace, M., Extension Faculty- Box Elder County, Utah State University
Hadfield, J.L., Extension Specialist, Utah State University
Smith, J., Extension Director, Utah State University
Greenhalgh, L., Extension Faculty- Tooele County , Utah State University
Taylor, K., Extension Faculty- Millard County, Utah State University
Larsen, R., Extension Specialist, Utah State University
Sulser, A., Extension Faculty- Wasatch County , Utah State University
ABSTRACT
Fresh turkeys raised by 4-H/FFA youth for the Utah State Junior Turkey Show have become a must-have for many Utahns’ Thanksgiving feasts. Variations of consumer demands make gauging finished turkey sizes a major challenge for 4-H/FFA youth. To date, youth never had a specific carcass weight prediction tool available before processing turkeys for the Utah State Junior Turkey Show. Responding to this need, Utah State University Extension faculty performed research to identify specific turkey carcass dressing percentages. Results revealed statistically significant (R2 = 0.9999) calculations for both tom (0.7858) and hen (0.8229) turkeys.
Introduction
The Utah State Junior Turkey Show has allowed 4-H and FFA youth the opportunity to raise, harvest, and sell turkeys for nearly seven decades (Pace & Holmgren, 2011). Show participation has only increased over time. In 2019, the Utah State Junior Turkey Show processing plant handled 2,679 turkeys. In 2020, birds processed grew to 2,892. It was exciting to note increased participation even with the global COVID-19 pandemic, and we anticipate these numbers growing larger still in 2021. Find detailed information about the Utah State Turkey Show functionality in the article titled “Utah State Junior Turkey Show and Auction” by Pace & Holmgren (2011).
Before receiving their turkey poults, youth participating in the Utah State Junior Turkey Show select the amount of hen poults and tom poults they would like to raise for the upcoming year. Youth often choose the sex of turkeys based on the preference of their customers. Customers desire turkeys of certain weights, depending on cooking times and the size of their Thanksgiving family gatherings. As large turkeys (26–35 lbs. carcass weight) require longer roasting time and special equipment for proper and safe cooking, moderately sized turkeys (16–25 lbs. carcass weight) are often preferred. Because hens are naturally moderate-sized, youth often choose more hen than tom poults. When considering price, larger turkeys cost more than a moderate-sized bird for both the consumer (due to extra pounds of meat) and the youth producer (due to extra feed required).
For youth, this scenario can create a problematic approach. Often, youth do not know what their birds’ carcass weights will be until they have been processed. Few resources or tools exist that detail dressing percentages or predict carcass weight for turkey. However, research from Michigan State University indicates that a normal dressing percentage range for turkeys is anywhere from 77%–81%, with an average of 79% (Schweihofer, 2011). Without knowing the carcass weights of their turkeys, youth can struggle to provide their customers with the exact product desired. To address this problem, faculty from Utah State University Extension conducted research to discover an equation for youth turkey producers that helps them determine their turkeys’ carcass weights utilizing only turkey live weights.
Methods
Poults
The study originally focused on 400 tom poults ordered in 2018. After findings from the tom research, the research team determined to replicate the study in comparing hens. In 2020, 400 hen poults were ordered. All poults in respective years arrived on the same day and from the same hatchery as all of the other poults ordered by 4-H/FFA youth. All poults for both 2018 and 2020 were raised in the same production facility. Upon arrival from the hatchery, poults were transported to brooders that each housed an average of 100 poults (Figure 1). Poults were provided ample heat, shelter, feed, and water. After about 8 weeks, or when the poults were fully feathered, heat sources were removed. For an additional 8–9 weeks, poults were fed free-choice feed and water. Once birds reached a mature size of 16 to 17 weeks of age, they were brought to the Utah State Junior Turkey Show processing plant for harvesting.
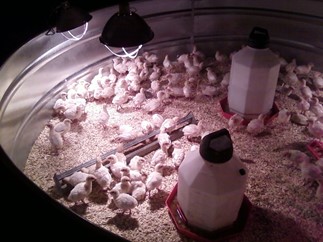
Figure 1. Research Turkey Poults on Free-Choice Feed in a Brooder Ring
Processing
Because of state processing and health standards, birds entered in the program must be processed at the Utah State Junior Turkey Show processing plant, which is state-certified by the Utah Department of Agriculture and Food (Pace & Holmgren, 2011). Careful precautions and measures were taken to ensure humane handling, proper harvesting, and safe storage of processed birds.
To receive the most accurate results for dressing percentages, live turkeys were tagged with an individual identification number on their wing and then weighed immediately before harvesting. Digital hanging scales were used for toms and hens to obtain accurate live weights (Figure 2). The harvesting process included: euthanasia, scalding, plucking, removal of entrails, head, and feet, cleaning of the body cavity, insertion of neck into the body cavity, and the tucking of legs. Following the harvesting process, hot carcass weights were taken and recorded for each bird (Figure 3). After a chilling bath, carcasses were placed into shrink-wrap bags and then into a freezer unit. The total harvesting process per bird took an average of 6–8 minutes from start to finish.
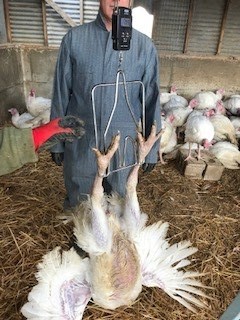
Figure 2. Weighing a Live Tom on a Digital Hanging Scale to Record Live Weight Prior to Harvesting
Analysis
Researchers recorded the live and harvested weights of 361 toms and 92 hens. All available toms were weighed in 2018. Due to time constraints and lessons learned from 2018, the research team chose to only weigh a random sampling of 92 hens (deemed an adequate sample size) in 2020. Dividing total carcass weights by total live weights yielded the overall dressing percentage number. In addition, researchers calculated the statistical measure of R-squared (R2) to show the coefficient of determination for both toms and hens.
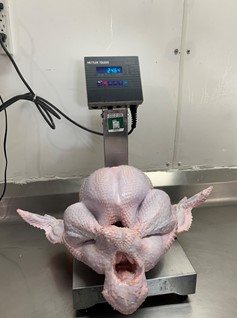
Figure 3. Weighing a Turkey Hot Carcass on a Utah Department of Agriculture and Food Certified Digital Scale to Record Carcass Weight Minutes After Harvesting
Results and Discussion
Results for both toms and hens were found to be statistically significant and linearly correlated (Figures 4 and 5). Though the turkeys were of the same age and breed, overall results indicated differences due to sex of birds. Table 1 displays the average and range of weights (live and carcass weight) for toms and hens weighed in this study. These findings reflect the more moderate nature of hen carcasses and their tendency to retain more fat on their carcass than toms.
Table 1.
Turkey Weight Data From 361 Toms (2018) and 92 Hens (2020)

For tom turkeys, the dressing percentage calculation was 0.7858, accompanied by an R-squared (R2) value of 0.9999 (Figure 4). R-squared is the measure of how well a regression model fits the observed data. R-squared values are measured from 0 to 1, and high values (such as 0.9999) indicate that the regression model fits the observed data very well. In our research, the regression model is the tom (or hen) carcass weight equations and the observed data is the tom (or hen) live and carcass weights. For toms, a calculated standard error of estimate was found to be +/- 0.6056. From these results derived the tom carcass weight prediction equation: Tom Predicted Carcass Weight = Live Weight x (0.7858).
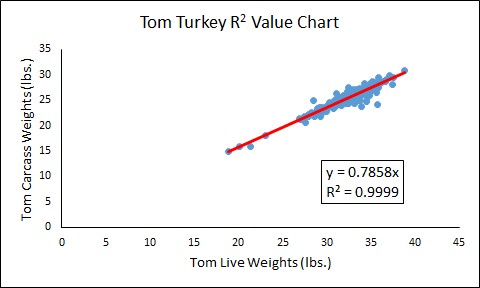
Figure 4. Tom Turkey R2 Value Showing the Predicted Carcass Weight Equation Corresponds to Live and Carcass Weights
Similarly, for hen turkeys, the dressing percentage calculation was 0.8229, accompanied by an R-squared (R2) value of 0.9999 (Figure 5). A calculated standard error of estimate was found to be +/- 0.5235. From these results derived the hen carcass weight prediction equation: Hen Predicted Carcass Weight = Live Weight x (0.8229).
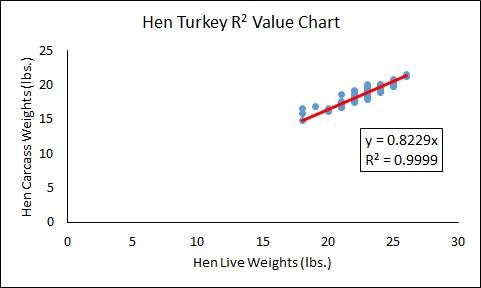
Figure 5. Hen Turkey R2 Value Showing the Predicted Carcass Weight Equation Corresponds to Live and Carcass Weights
Table 2 summarizes these calculations for tom and hen turkeys.
Table 2.
Using Percentage Dressing Calculations to Create a Turkey Carcass Weight Prediction Equation

The turkey carcass weight prediction equations, for both toms and hens, are a great tool for youth raising turkey projects. High R-squared value (0.9999) illustrates that both equations are trustworthy means of estimating carcass weights. However, as raising turkeys is a biological process, expect some error (+/- 0.6056 toms, +/- 0.5235 hens) when using these equations as an estimate. Even with this added error, estimations from the provided equations should be within 0.5 to 1 pound of the actual carcass weight. By having minimal error involved, youth can utilize these equations to help provide themselves and their consumers with the desired product.
Conclusion
By using these equations, youth will apply critical thinking skills to a real-life turkey production situation. Not only will these equations provide youth an estimation of carcass weights prior to processing, but youth will use these equations weeks before processing to predict current carcass weight, average daily gain, how much turkeys should ideally weigh at processing, and feed adjustments for turkeys to reach ideal harvesting weights. These equations will help youth effectively meet their consumers' product preferences. With fewer opportunities for youth to participate in agriculture, it is vastly important that youth learn these real-life skills that can be applied to not only their turkey project, but also many other facets of life.
Literature Cited
Pace, M.G., & Holmgren, L.N. (2011). Utah State Junior Turkey Show and Auction. Journal of the NACAA, 4(2). Retrieved March 10, 2021, from https://www.nacaa.com/journal/index.php?jid=102.
Schweihofer, J.P. (2011, May 9). Carcass dressing percentage and cooler shrink. Michigan State University Extension. Retrieved March 05, 2021, from https://www.canr.msu.edu/news/carcass_dressing_percentage_and_cooler_shrink