Journal of the NACAA
ISSN 2158-9429
Volume 14, Issue 2 - December, 2021
Comparison of Struvite to Mono-ammonium Phosphate for Alfalfa Production at Commercial Alfalfa Farms: A Case Study
- Harrison, J.H., Dairy Specialist, Washington State University
Norberg, S, Regional Forage Specialist (corresponding author), Washington State University
Fullerton, K., Research Assistant, Washington State University
Morgon, L., Research Assistant, Washington State University
Whitefield, E., Extension Coordinator, Washington State University
ABSTRACT
A three year case study was conducted at two commercial Medicago sativa growers to evaluate the availability of P from struvite or mono-ammonium phosphate (MAP) on forage yield, composition, P uptake, and soil test P. Combined yields and combined P uptake over three years for the two farms was of 38.6 and 39 tons, and 215 and 226 pounds, respectively for MAP and Struvite + MAP treatments. Average content of P in Medicago sativa was 0.29 % for MAP and Struvite + MAP treatments. Based on this data, struvite was demonstrated to be a comparable source of P for Medicago sativa production under commercial growing conditions.
Introduction
Phosphorus (P) and potassium are the two nutrients required in greatest quantities for the growth of Medicago sativa (Undersander et al., 1991) and annual costs typically can be $216 acre-1 but can vary greatly with fertilizer prices (Norberg and Neibergs, 2012). Most inorganic sources of P used as fertilizer are sources from phosphate rock, with approximately 1.5 % of the global P reserves found in the USA and > 70 % in Morocco (USGS 2021). Due to agriculture’s reliance on mined sources of P and the limited sources in the USA, it is important to evaluate alternative and renewable sources of P for crop production. One renewable source of P that can be extracted from livestock manure is called struvite (magnesium ammonium phosphate hexahydrate (MgNH4PO4·6(H2O)) (Bowers and Westerman 2005; Demirer and Yilmazel 2013, Tao et al., 2016). Hilt et al. (2016) reported the value of dairy derived struvite as a P source for Medicago sativa, Zea mays silage, Triticosecale, and Avena sativa in greenhouse of plot studies. Struvite has been observed to be equivalent or superior to the compared commercial fertilizer, including ammonium phosphates, calcium phosphates, and mineral ammonium phosphates in a wide variety of crops such as Lolium perenne, Festuca, Fagopyrum esculentum, horticultural plants, Lactuca sativa, Zea mays, Cicer arietinum, and Sorghum bicolor (Ghosh et al., 1996; Li and Zhao, 2003; Romer, 2006; Gonzalez-Ponce and Garcialopez, 2007; Plaza et al., 2007; Gonzalez-Ponce et al., 2009; Cabeza et al., 2011; Achat et al., 2014; Bonvin et al., 2015; Ryu et al., 2015; Vogel et al., 2015; Liu et al.,.2016; Talboys et al., 2016).
While replicated plot and greenhouse studies have been conducted, we are not aware of production scale studies have been conducted to compare struvite to common P fertilizers for production of Medicago sativa. Therefore, the purpose of the agronomic project summarized in this paper was to demonstrate the value of struvite as a P source when compared to mono-ammonium phosphate over three growing seasons and applied to meet soil test P recommendations. This project is companion to a project demonstrating the use of a mobile struvite system for the capture of P from liquid dairy manure (Harrison et al., 2021; Norberg et al., 2019.).
Methods
A three-year study was conducted at two commercial Medicago sativa growers to compare two different sources of phosphorus (P). Mono-ammonium phosphate (MAP, 11-52-0) or struvite (N-P-K+Mg - 6 – 29 – 0 + 16) were applied alone or in combination. The initiation year was 2017, and full production data, soil test, and forage composition were collected in 2018, 2019, and 2020. Farm 1 had an established stand of Medicago sativa and field sizes were MAP, 33 acres; and Struvite + MAP, 30 acres. Farm 2 was rotating from Phleum to Medicago sativa and field sizes were MAP, 60 acres; and Struvite + MAP, 55 acres. Farm 1 and Farm 2 utilized irrigation via pivot and linear sprinkler systems, respectively.
Fertilizer application
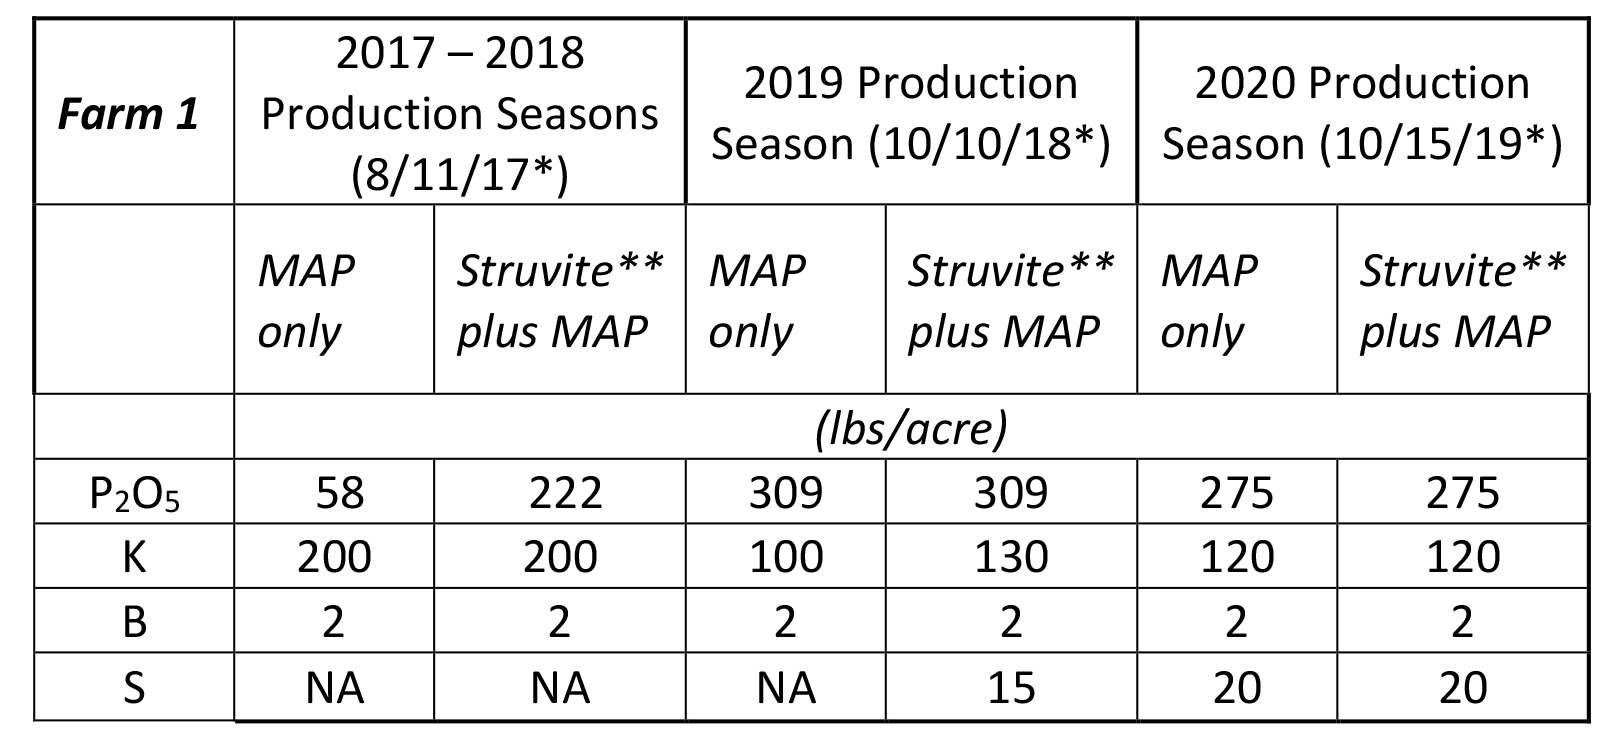
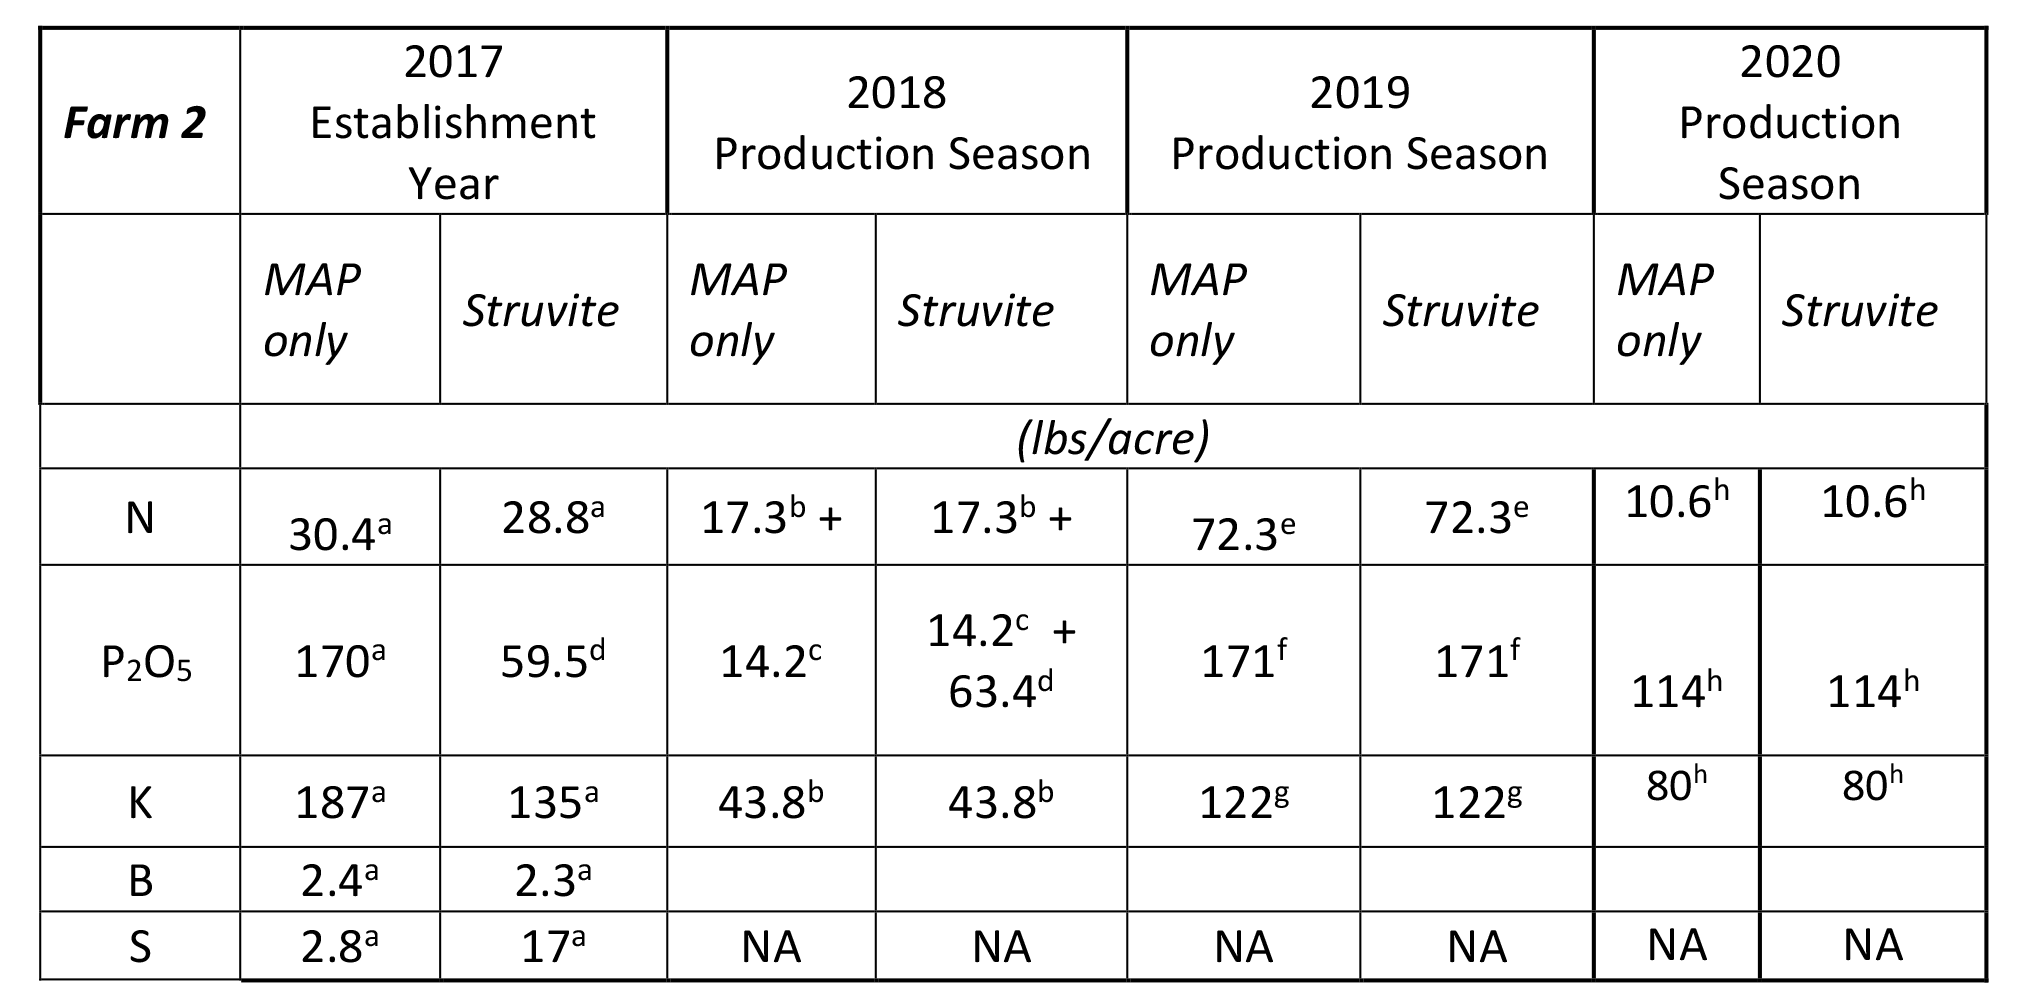
Fertilizer applications were made with standard application equipment for each farm and are summarized in Tables 1 and 2. The amount of P applied was based on a prior soil test for Olsen-P (table 3). For farm 1, due to lower soil test P (range 13 – 18 ppm Olsen P), the source of P was either 100% MAP (11-52-0) or a 2:1 ratio of struvite:MAP. The struvite N-P-K+Mg analysis was 6 – 29 – 0 + 16 in each of the three years (Table 1). In year 1 (Farm 1), the soil test P indicated a greater need for P on the Struvite + MAP side of the field. For farm 2, due to the higher soil test P (18ppm), the source of P was either 100% MAP (11-52-0) or 100% struvite ( 6 – 29 – 0 + 16) in years 1 and 2, and 100% MAP (11-52-0) in year 3 (Table 2). In 2019, Farm 2 participated in a Natural Resources Conservation Service Conservation Stewardship Program which fostered the use of nitrogen sources with limited volatilization.
Table 1. Farm 1--Nutrients Applied
*Application date.
**2/3 Struvite: 1/3 MAP
Table 2. Farm 2--Nutrients Applied
aApplied 9/6/17 - super urea, 20-0-0-24, 0-0-62.4, boron, procote BMZ, 11-52-0-2
bApplied 4/27/18 and 7/12/18 - 0-0-60, 32-0-0, 8-24-0, 0-0-15
cApplied 7/12/18 as 8-24-0
dApplied 8/14/18 as struvite
eApplied 11/12/18, 4/3/2019, 5/14/2019, 6/24/2019, 7/23/2019, 7/31/2019 - 0-0-60, 16-20-0, 25-0-0, 0-0-15, 8-24-0, 11-52-0, 20.5-0-0-24, 32-0-0
fApplied 11/12/18, 5/4/19, 6/24/19, and 7/23/19 as 16-20-0, 8-24-0, and 11-52-0
gApplied 11/12/18, 4/3/2019, 5/14/2019, 6/24/2019, 7/23/2019 – 0-0-60, 0-0-15, 20.5-0-0-24
hApplied 12/9/2019 for 2020 year – 11-52-0, 0-0-60
Medicago sativa harvest
-Medicago sativa was harvested 3 or 4 times each year at each location. Farm 1 had an established stand of Medicago sativa and the first harvest after P application occurred at the 4th cutting in 2017. Farm 2 was a newly established stand of Medicago sativa in 2017 in a field previously in timothy. The field was reseeded in April 2018, as many of the Medicago sativa plants experienced die off due to freezing winter temperatures. Forage yield estimates were made by the growers based on bale number and sale weights. Immediately after the baling of Medicago sativa at each harvest, samples of soil (1 ft) and forage (Penn State hay probe) were obtained while the hay remained in the field. Four areas (approximately 7000 sq ft) were identified by GPS for each treatment field at each farm (8 locations per farm) and samples were obtained at these same GPS coordinates each time. Eight soil samples were obtained from each GPS unit and composited. Hay bales (125 # or 1400 #) that dropped in each GPS unit were cored and composited. As a result there were four composited soil and four composited hay samples obtained for each treatment field at each cutting.
Analyses
Soil samples were analyzed by Soil Test Consultants (Moses Lake, WA) for organic matter, Olsen soil test P, Ca, Mg, S, Zn, B, and pH; and hay was analyzed by Cumberland Valley Analytical Services (Cumberland, MD) for Ca, Mg, P, K, protein, fiber, estimated total digestible nutrients, and relative feed value.
Statistical Analyses
Since this was a demonstration case study at commercial Medicago sativa growers, means and standard errors were calculated when replicate samples were available.
Results and Discussion
Soil Test P
Farm 1 Initial Olsen soil test P (mid-summer 2017) ranged from 13 to 18 ppm for the two fields on Farm 1 prior to the start of the study (Table 3 and Figure 1). An adequate level of soils Olsen test P is considered to be 20 ppm. (Koenig et al., 2009). The content of organic matter, Ca and S were approximately one-third to two-thirds that of farm 2; 2 vs 3.2, 3.5 vs 11.4, and 12.4 vs 18.1, respectively. The content of Zn and B in soil was similar between farms. The pH for Farm 1 was slightly acidic at 5.9. After application of MAP or a combination of struvite + MAP the soil test P increased to 20 ppm on 9/17/20. After the 4 cuttings in 2018 soil test P was approximately 10 ppm for the struvite + MAP field, while the MAP field steadily decreased from approximately 18 to 12 ppm after each of the 4 cuttings. In 2019, the MAP field remained at approximately 15 ppm after the 4 cuttings, while the struvite + MAP field steadily increased from 10 ppm to 15 ppm over the 4 cuttings. In 2020, the MAP field started at approximately 17 ppm and subsequently decreased to 12 and 14 ppm at third and fourth cutting. The struvite + MAP field remained at approximately 12 ppm throughout 2020. Averaged over cuttings and years the P content of the soil was 15 and 12 ppm for MAP and Struvite + MAP, when at total of 642 – 806 lbs P2O5 was applied, respectively.
Table 3. Initial analyses of soil at each farm prior to start of study.

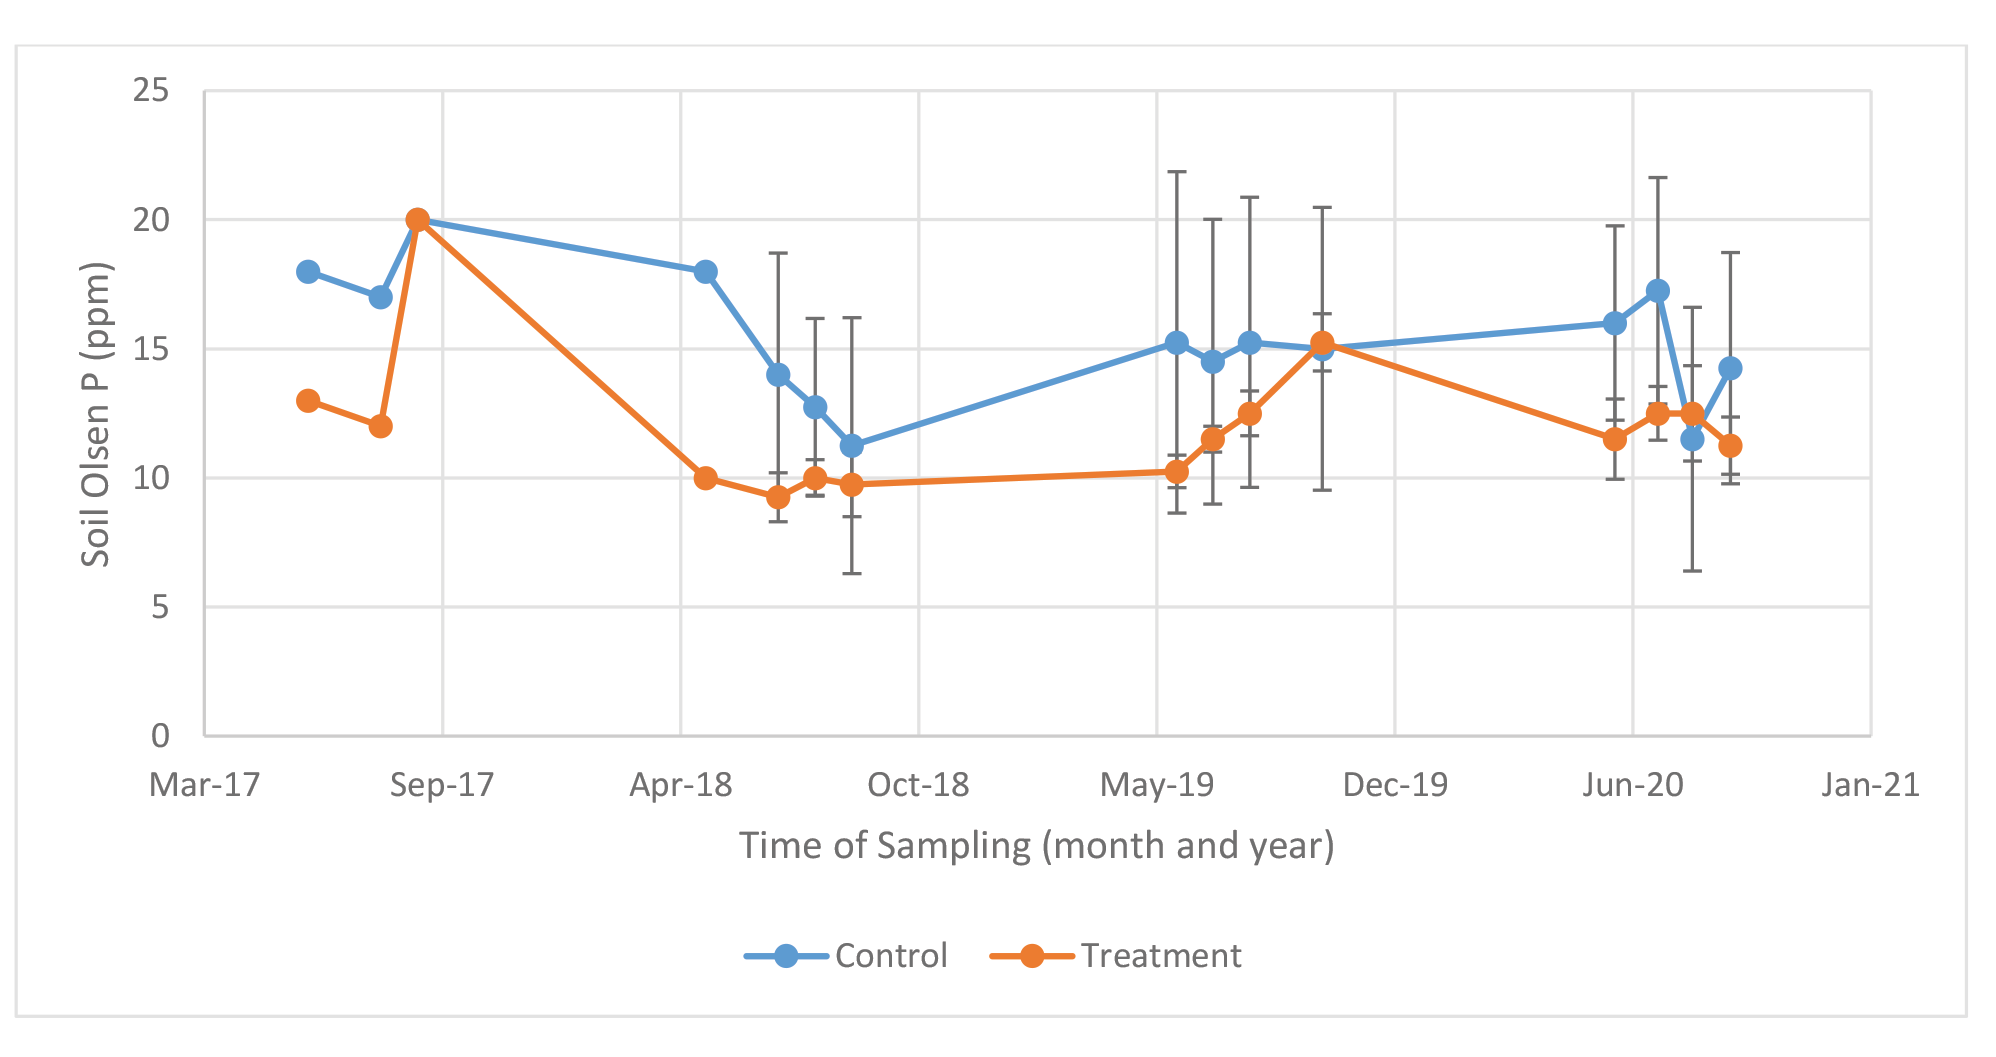
Figure 1. Soil test P (Olsen) after each cutting of Medicago sativa – Farm 1.
Farm 2 Initial soil test P in 2017 for farm 2 was 18 ppm for each field (Table 3 and Figure 2). The pH was slightly acidic at 6.0. During 2018 the soil test P ranged from 14 to 20 ppm for the MAP field. For the struvite field, soil test P started at 18 ppm, decreased to 7 ppm at second cutting, and increased to 16 ppm at third cutting after the field had received a struvite application on 8/14/18, 14 days prior to second cutting. In 2019 soil test P ranged from 19 to 25 ppm for the MAP field and 14 to 19 ppm for the struvite field. In 2020, the soil test P decreased from 24 to approximately 16 mg/g for the MAP field throughout the growing season. In 2020, the soil test P decreased from 29 to approximately 13 ppm for the struvite field throughout the growing season. Averaged over cuttings and years the P content of the soil was 19 and 17 ppm for MAP and Struvite + MAP, when a total of 466 and 422 lbs of P2O5/ac was applied, respectively.
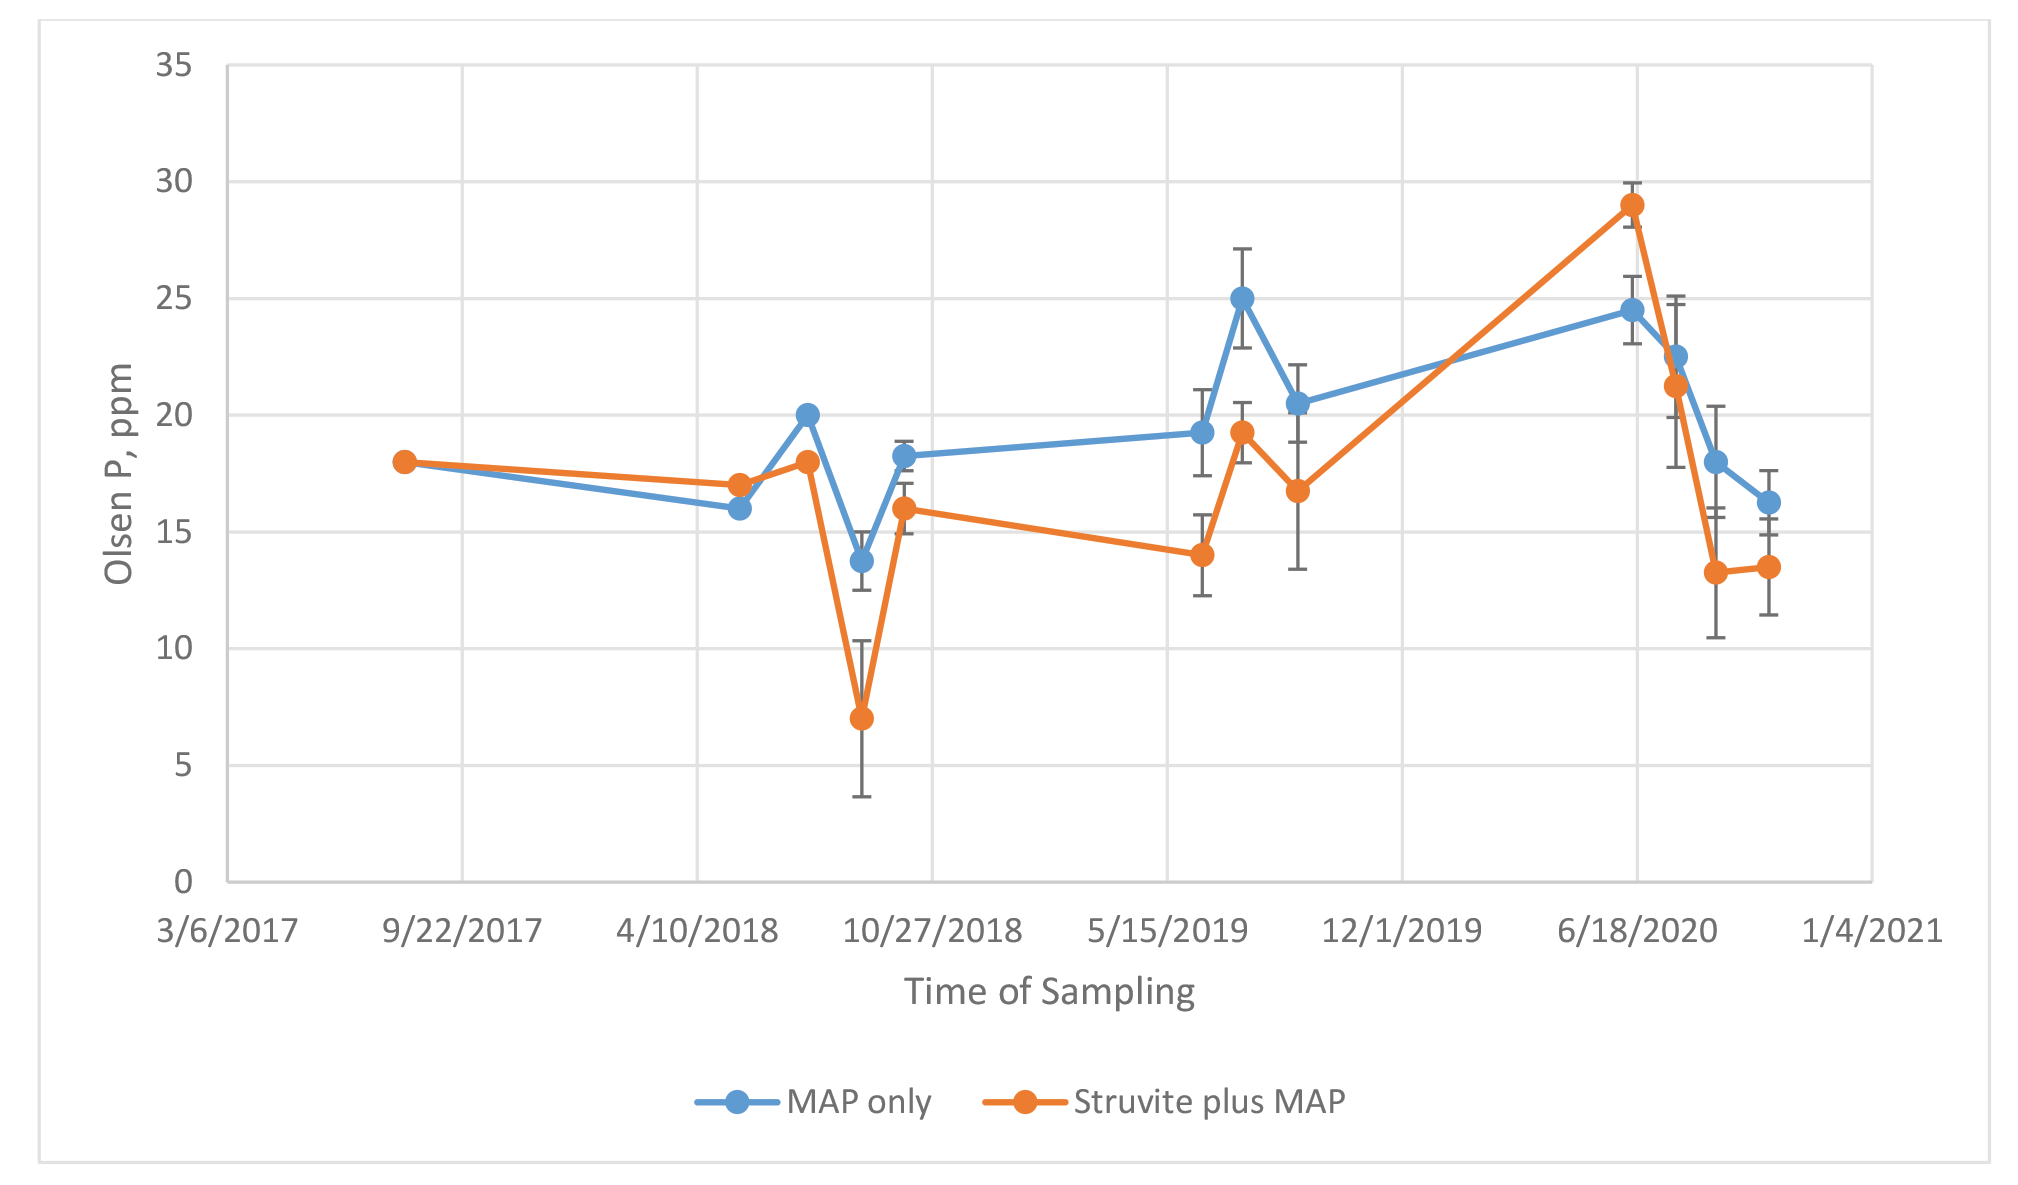
Figure 2. Soil test P (Olsen) after each cutting of Medicago sativa – Farm 2.
Forage Yield
Farm 1: The demonstration fields had one cutting in the fall of 2017, and 4 cuttings in 2018, 2019, and 2020. Forage yields (Figure 3) varied across cutting and years from a low of approximately 0.75 ton/acre to a high of approximately 2.8 ton/acre. Differences in yield between treatments and across cutting were minimal and ranged from 0 to 0.40 ton/acre. Forage yields were comparable between treatments across the 3 years with a total for MAP and Struvite treatments of 38.6 and 39 tons, respectively (Figure 5).
Farm 2: The demonstration fields had 3 cuttings in years 2018 and 2019, and 4 cuttings in year 2020. Forage yields (Figure 4) varied across cuttings and years from a low of approximately 0.7 ton/acre to a high of approximately 3.1 tons/acre. Differences in yield between treatments and across cutting were minimal and ranged from 0.1 to 0.59 ton/acre. Yield data was not available for cutting 2 in 2019.
When looking at forage yields across the 4 years, yields were comparable between treatments with a total for MAP and Struvite treatments of 38.6 and 39 ton/ac, respectively (Figure 5). Hilt et al. (2016) previously reported similar yield of Medicago sativa in two of three years in a replicated plot study comparing struvite and MAP in Eastern Washington conducted with alkaline soils.
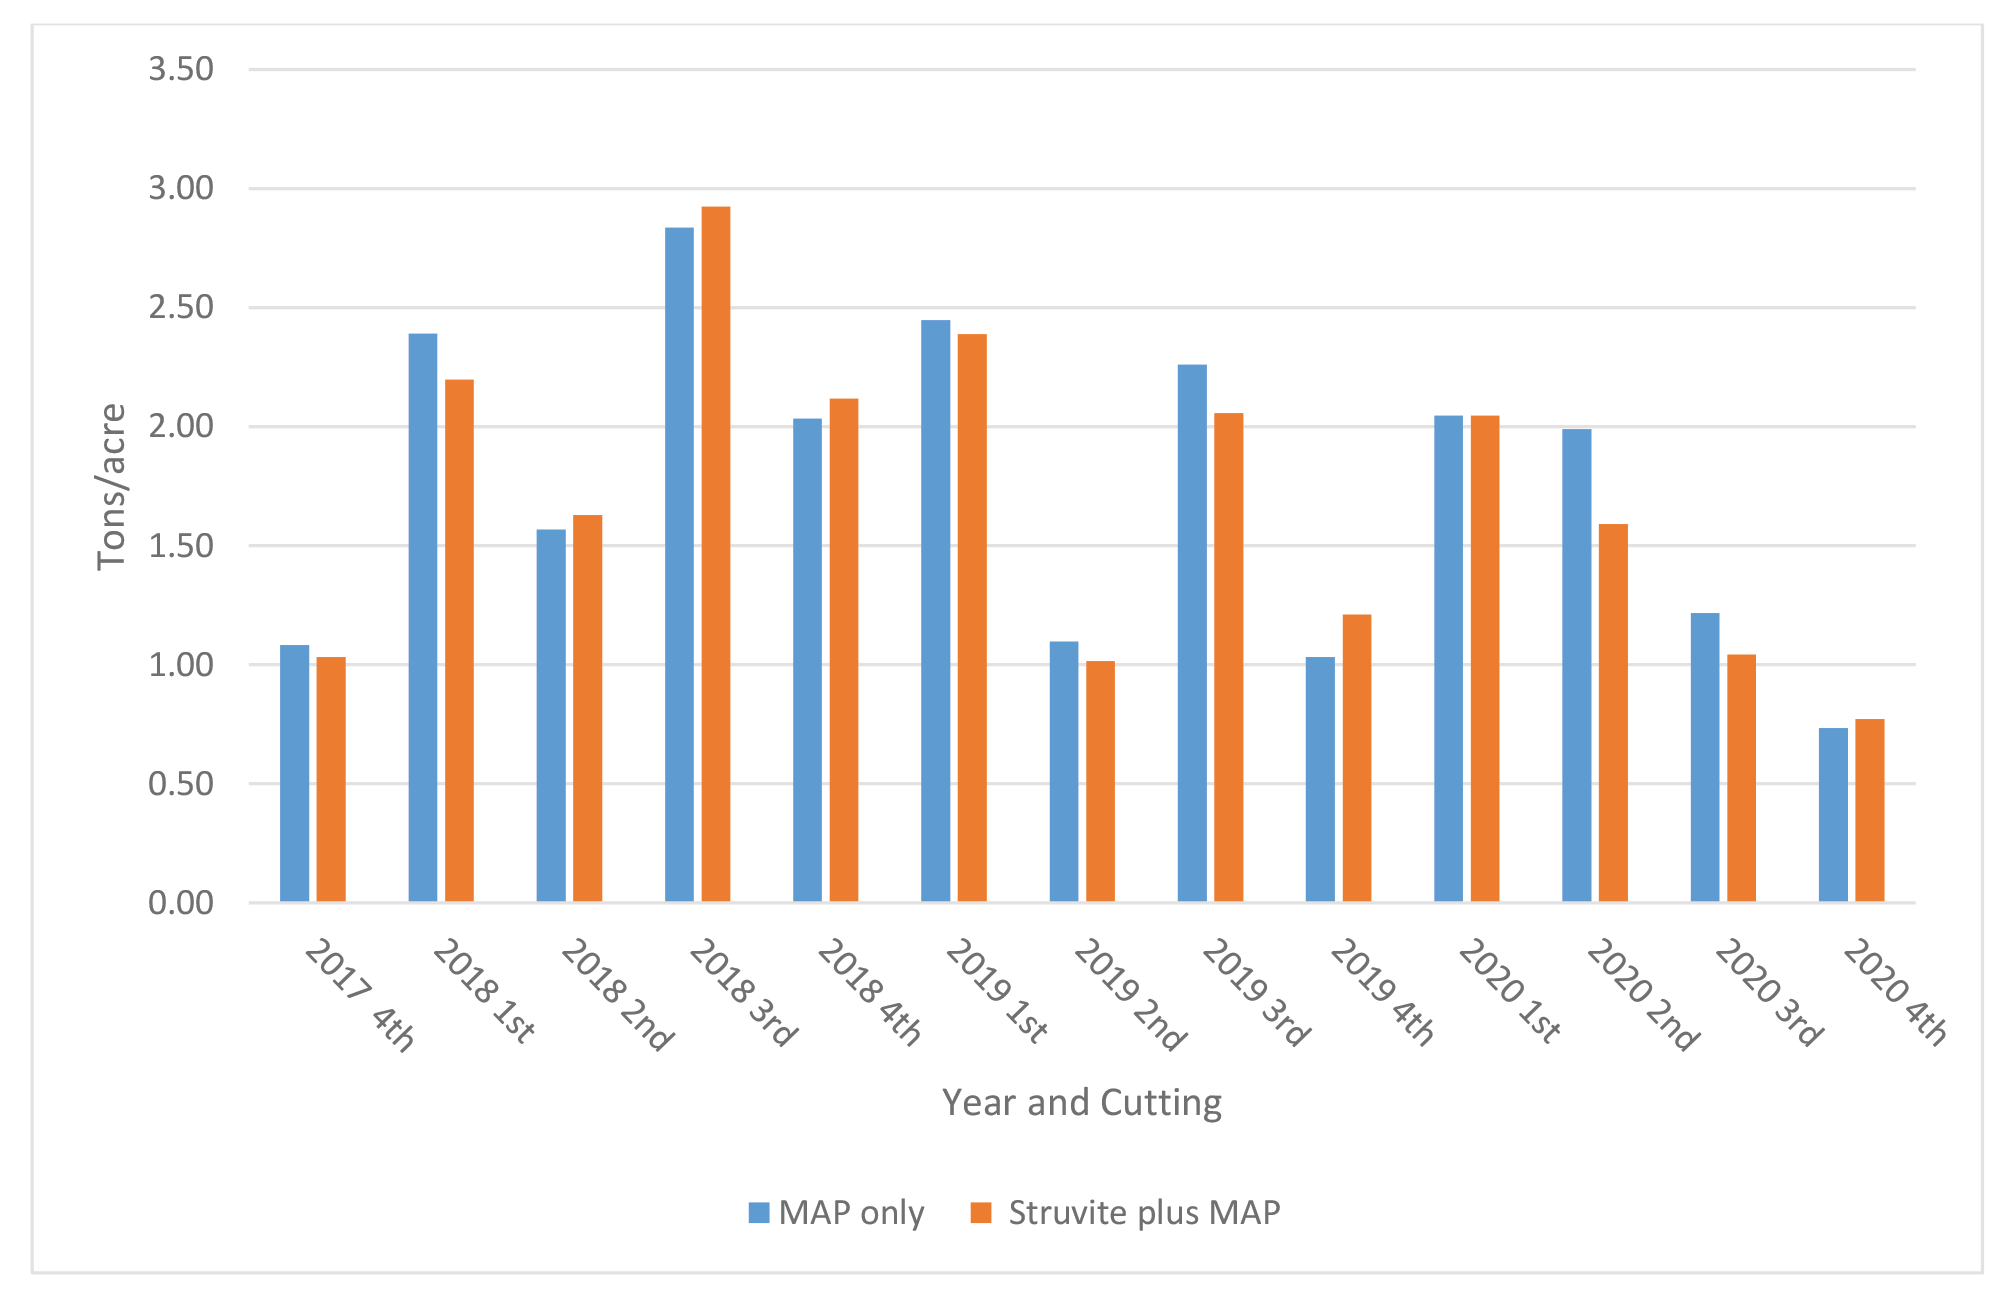
Figure 3. Yield of Medicago sativa by cutting across years for Farm 1 (Moses Lake, WA).
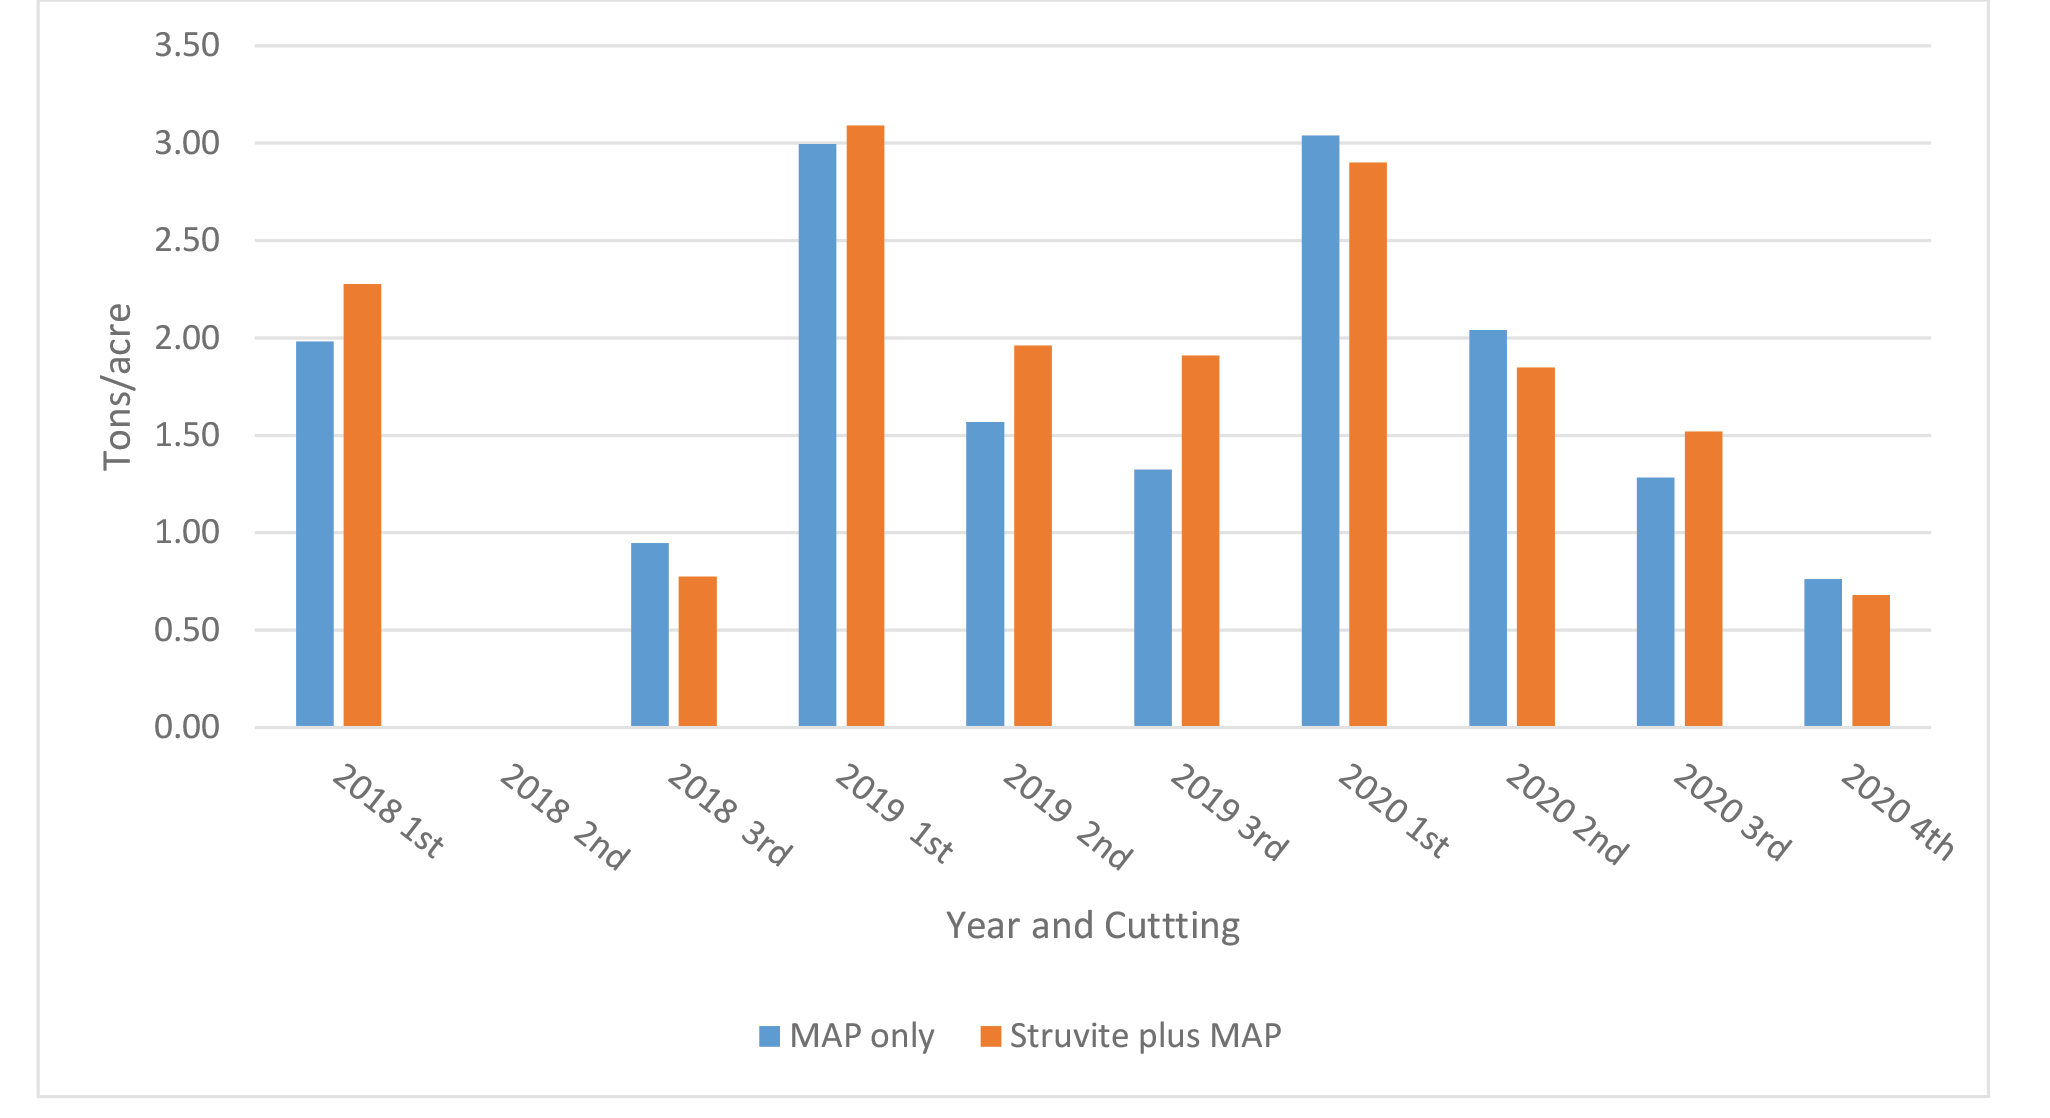
Figure 4. Yield of Medicago sativa by cutting across years for Farm 2 (Ellensburg, WA). No estimate available for 2nd cutting in 2018.
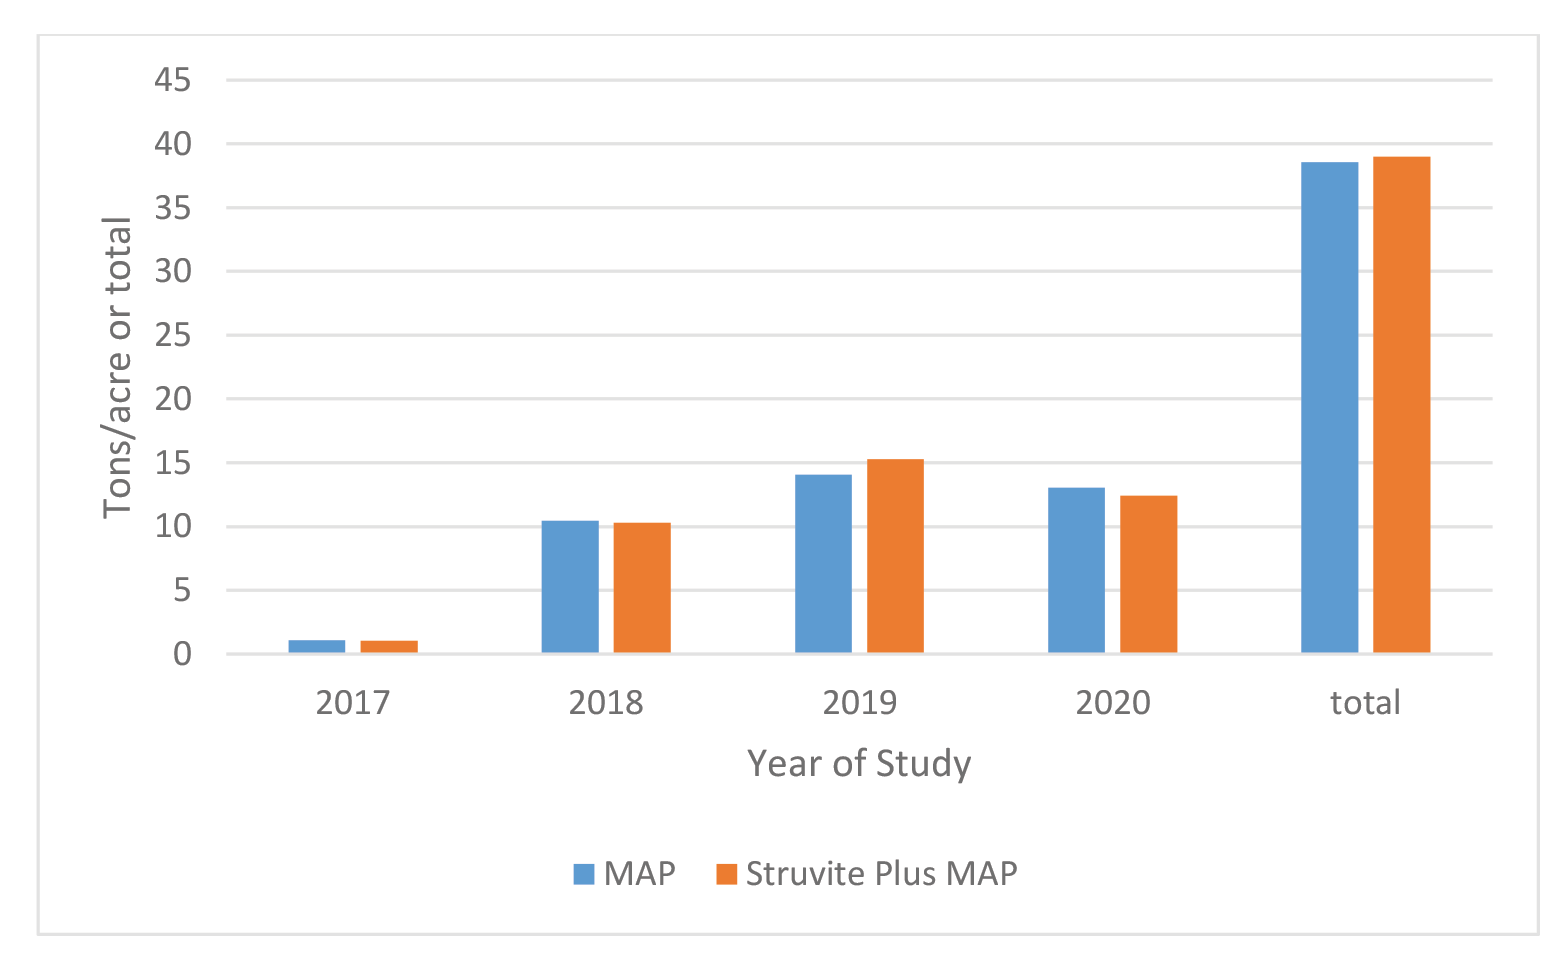
Figure 5. Average total annual yield by year and treatment and total yield of Medicago sativa combined for both farms. No estimate available for 2nd cutting for Farm 2 in 2018.
Forage Content of P
Farm 1: The content of P in Medicago sativa at each harvest is shown in Figure 6. Phosphorus content varied across cutting and years from a low of 0.23 % to a high of 0.36 %. Differences in content of P between treatments and across cutting were minimal and ranged from 0.0 to 0.03 %.
Farm 2: The content of P in Medicago sativa at each harvest is shown in Figure 7. Phosphorus content varied across cutting and years from a low of 0.24 % to a high of 0.32 %. Differences in content of P between treatments and across cutting were minimal and ranged from 0.0 to 0.02 %. Averaged over farms, cuttings and years the P content of Medicago sativa was 0.29 % for MAP and Struvite and Struvite + MAP. Gonzalez-Ponce and Garcialopez (2007) reported that struvite provided somewhat greater concentrations of P in perennial ryegrass when compared to other inorganic sources of P. Hilt et al. (2016) reported increased P content and P uptake in forages with struvite when grown in acidic soils, and variable results with alkaline soils.
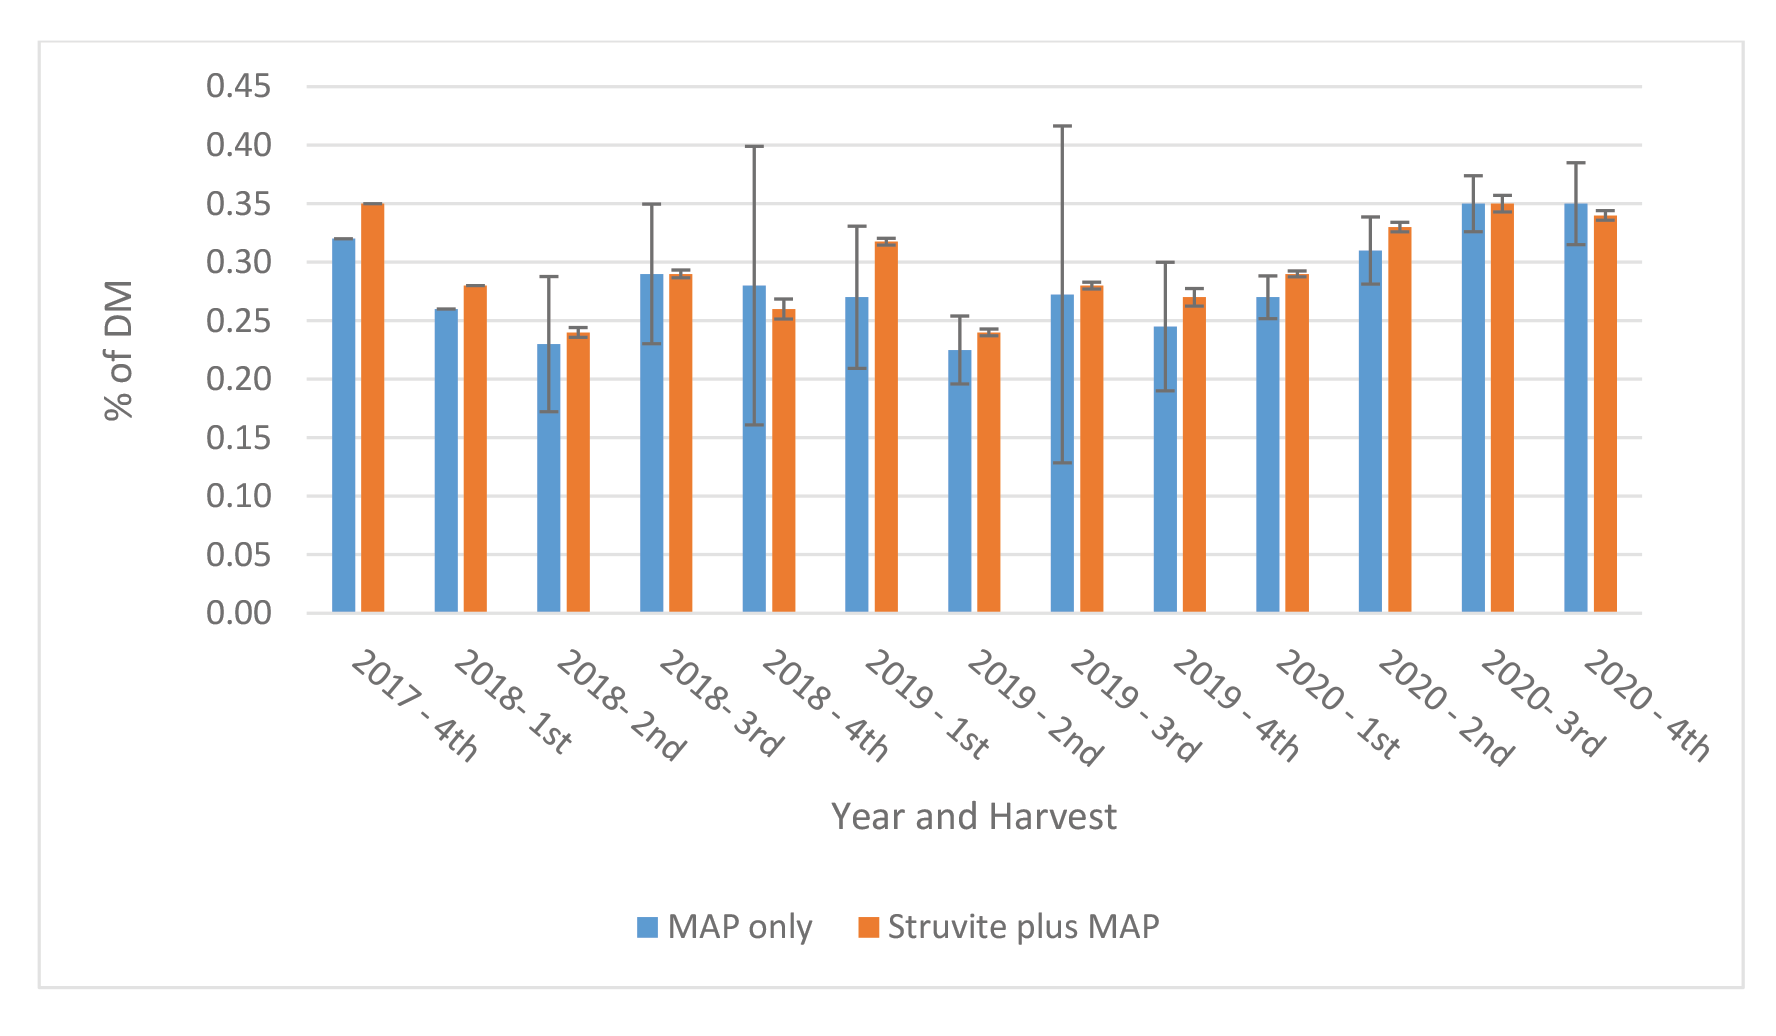
Figure 6. Content of P in Medicago sativa at each cutting – Farm 1.
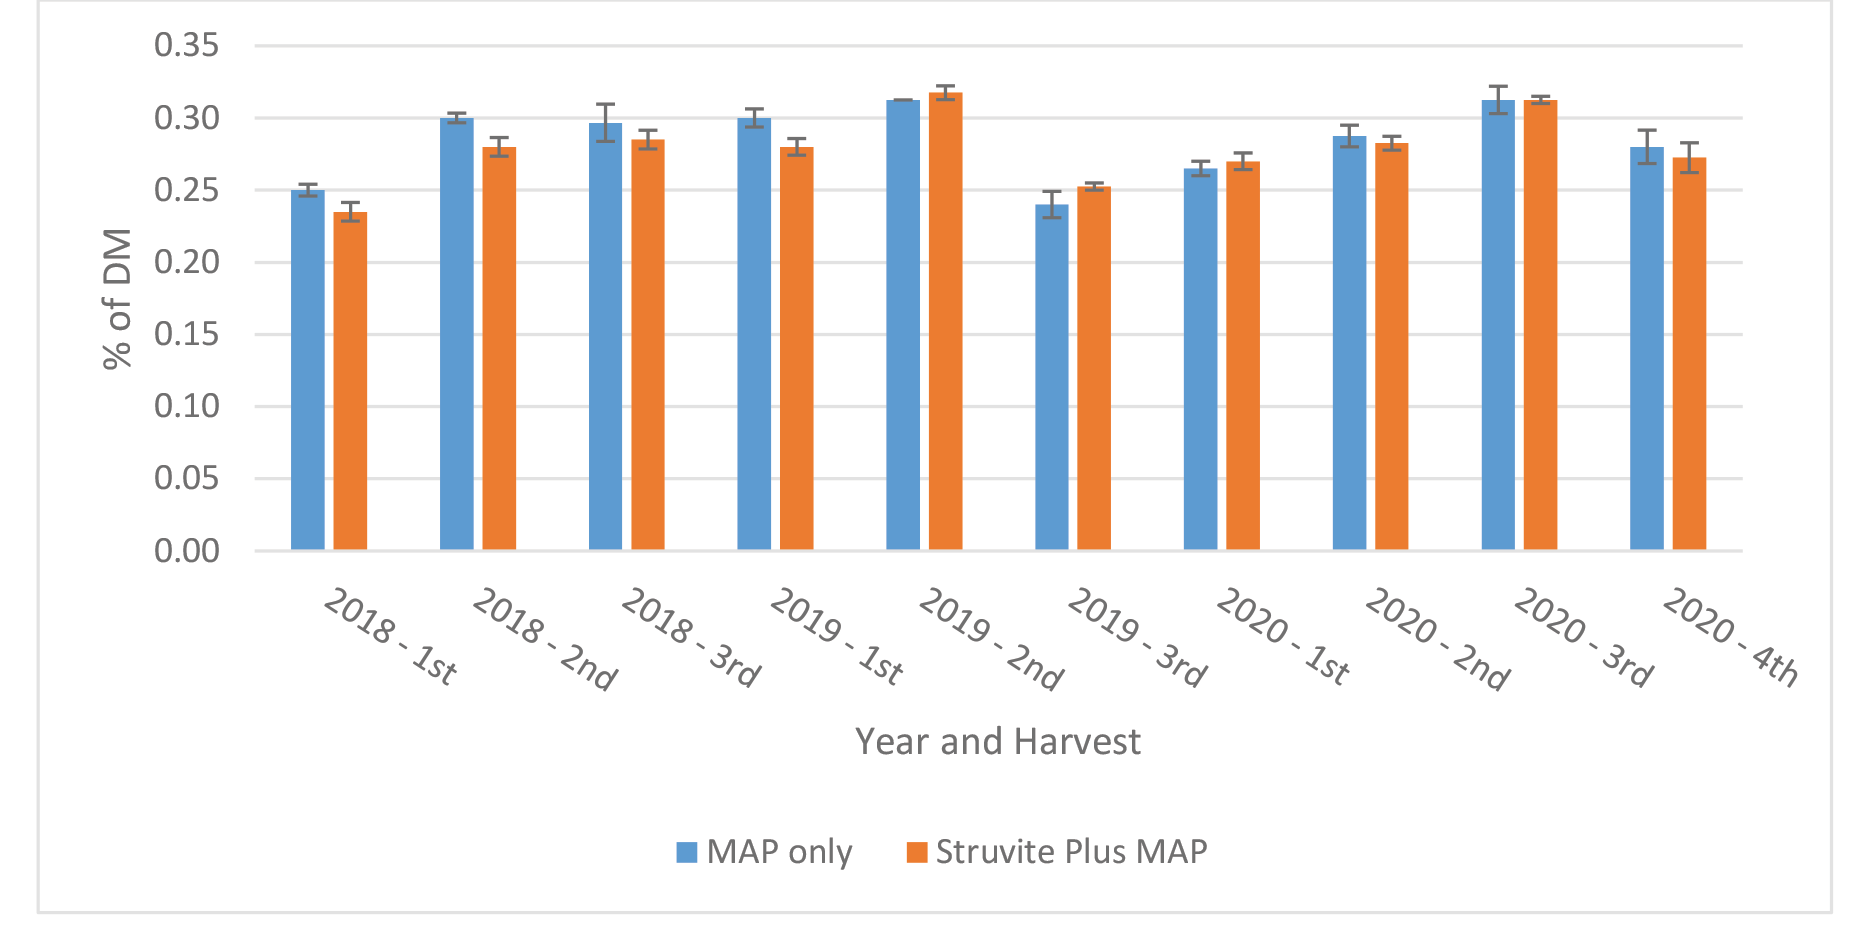
Figure 7. Content of P in Medicago sativa at each cutting – Farm 2.
Forage Uptake of P
Farm 1
The uptake of P in Medicago sativa at each harvest is shown in Figure 8. Phosphorus uptake at each harvest varied across cutting and years from a low of 4.8 pounds to a high of 18.6 pound/ac. Differences in uptake of P between treatments and across cutting were minimal and ranged from 0.1 to 3.4 pounds. The uptake of P generally followed the pattern of Medicago sativa yield across cuttings.
Farm 2
The uptake of P in Medicago sativa at each harvest is shown in Figure 9. Phosphorus content varied across cutting and years from a low of 4.4 pounds to a high of 18.0 pounds. Differences in content of P between treatments and across cutting were minimal and ranged from 0.1 to 3.4 pounds. As was observed for Farm 1, the uptake of P generally followed the pattern of Medicago sativa yield across cuttings.
When looking at P uptake across the 4 years for the combination of both farms, uptakes were comparable between treatments with a total for MAP and Struvite treatments of 215 and 226 pounds, respectively (Figure 10). Hilt et al. (2016) reported struvite to superior or equal to MAP for growth of Triticosecale and Avena sativa in acidic soils, and variable in alkaline soils. This is consistent with previous reports of availability of P from struvite as a result of its solubility in acidic environments (Chirmuley 1994).
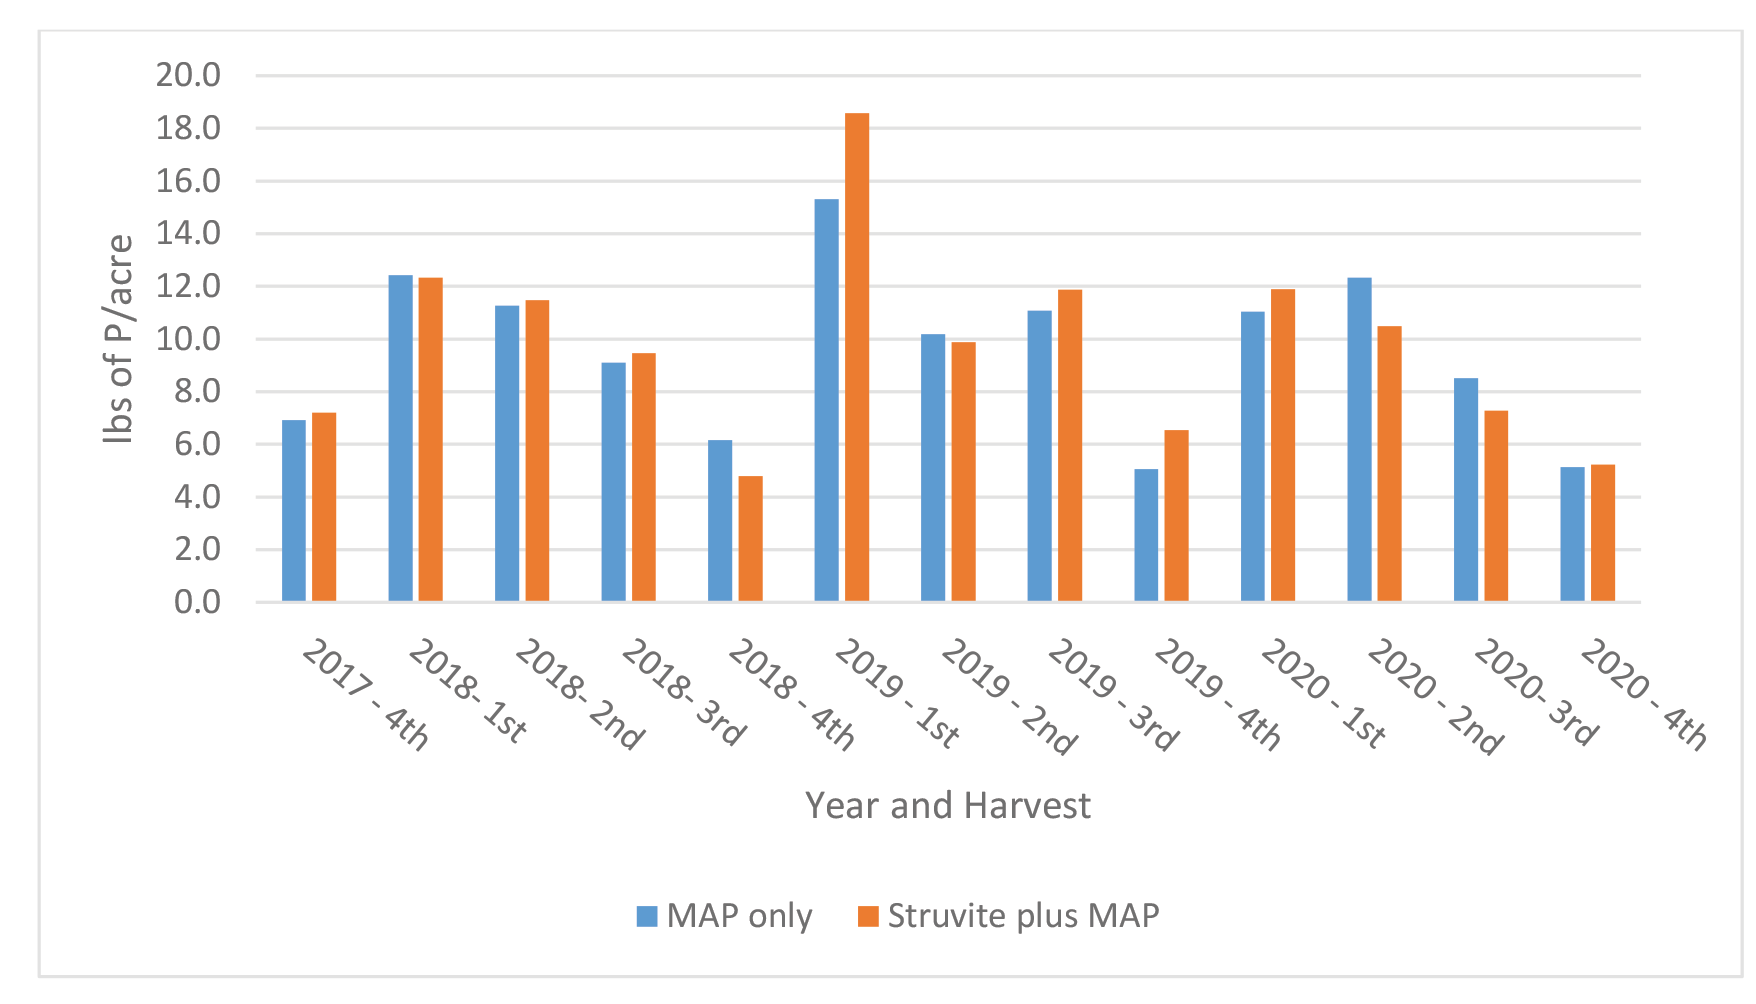
Figure 8. Uptake of P in Medicago sativa at each cutting – Farm 1.
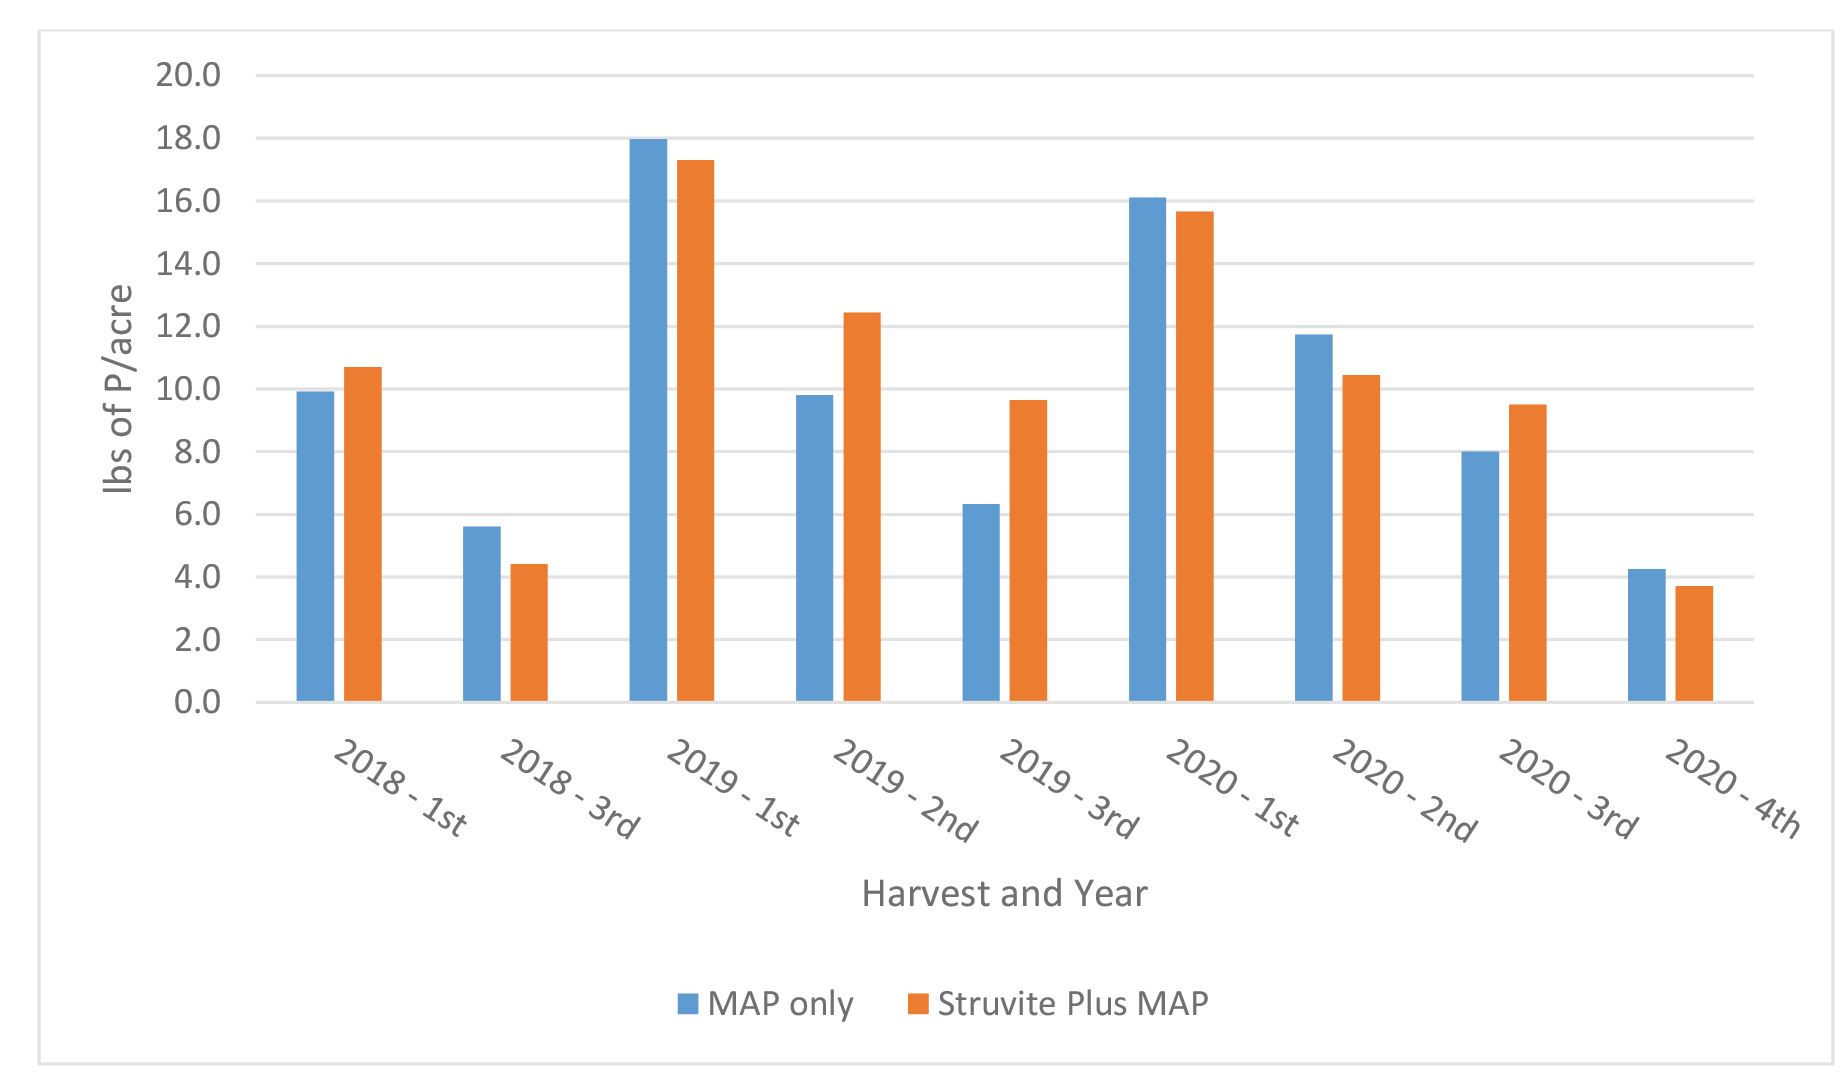
Figure 9. Uptake of P in Medicago sativa at each cutting – Farm 2. No estimate available for 2nd cutting in 2018.
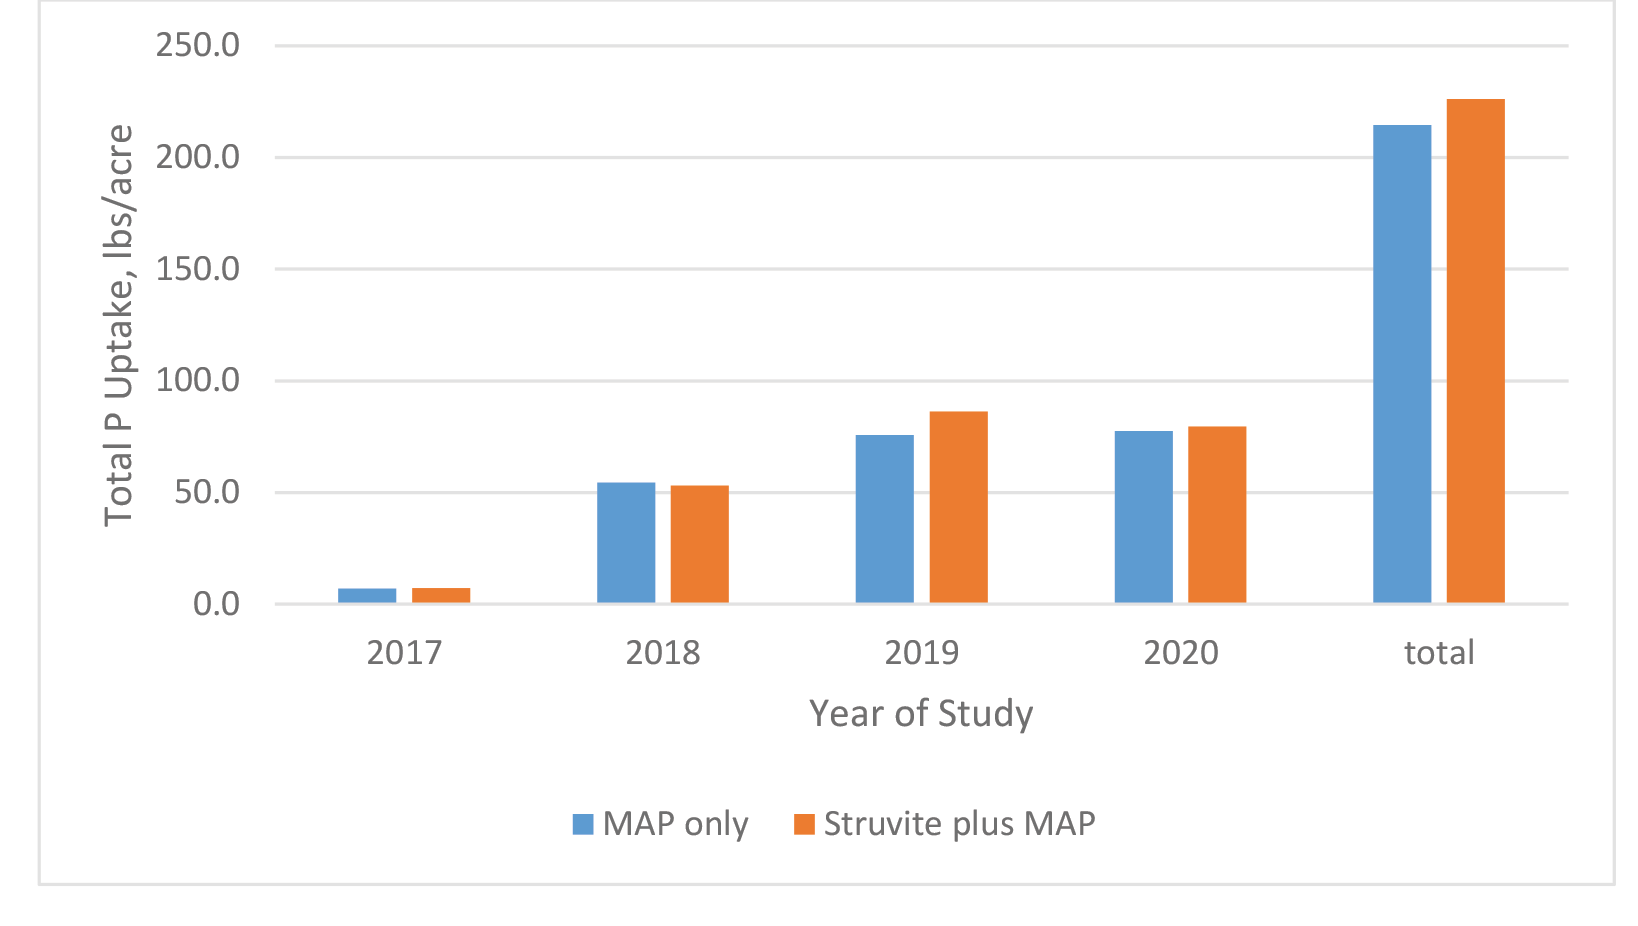
Figure 10. Annual cumulative uptake of P from Medicago sativa. No estimate available for 2nd cutting in 2018.
Forage Composition
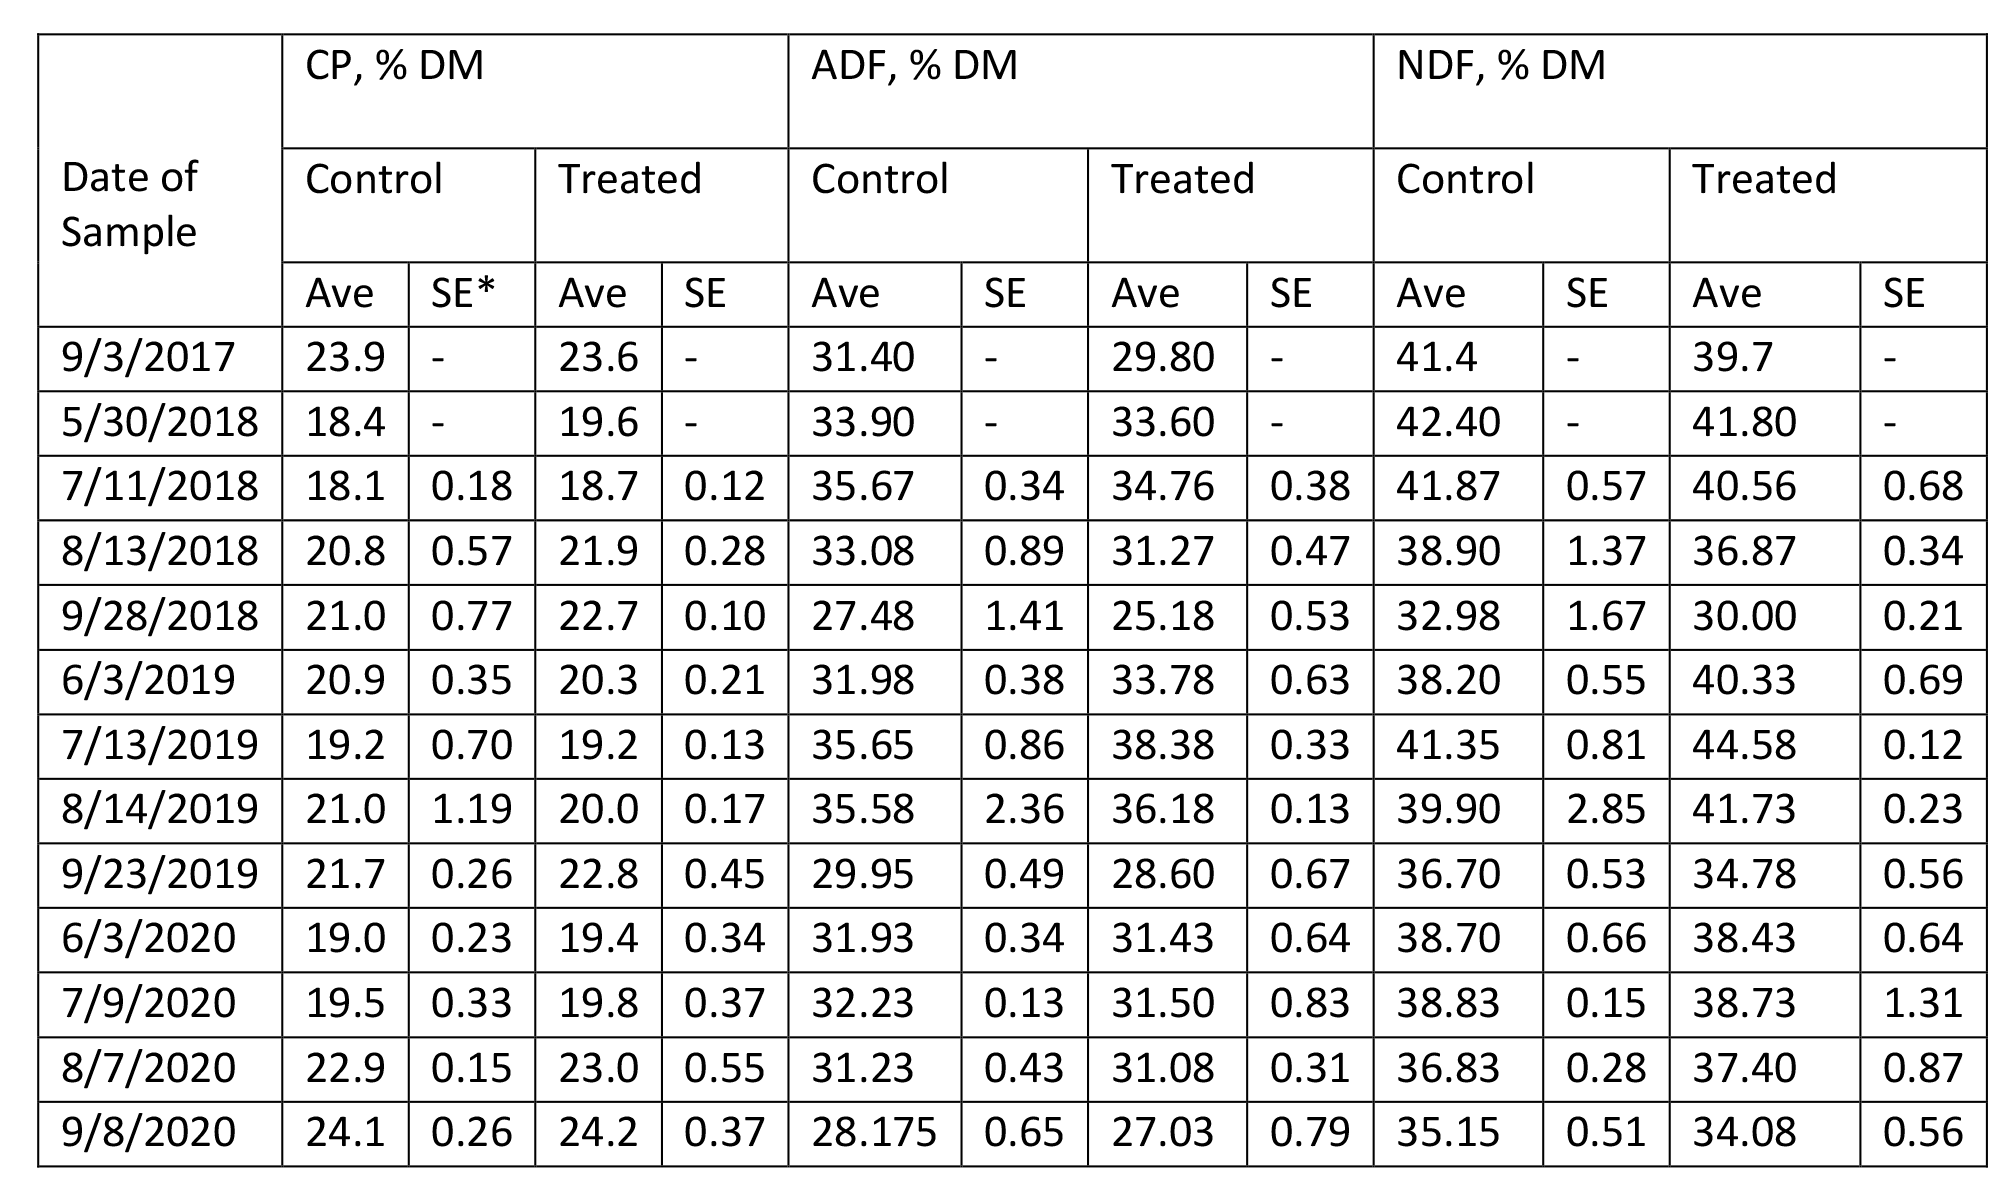
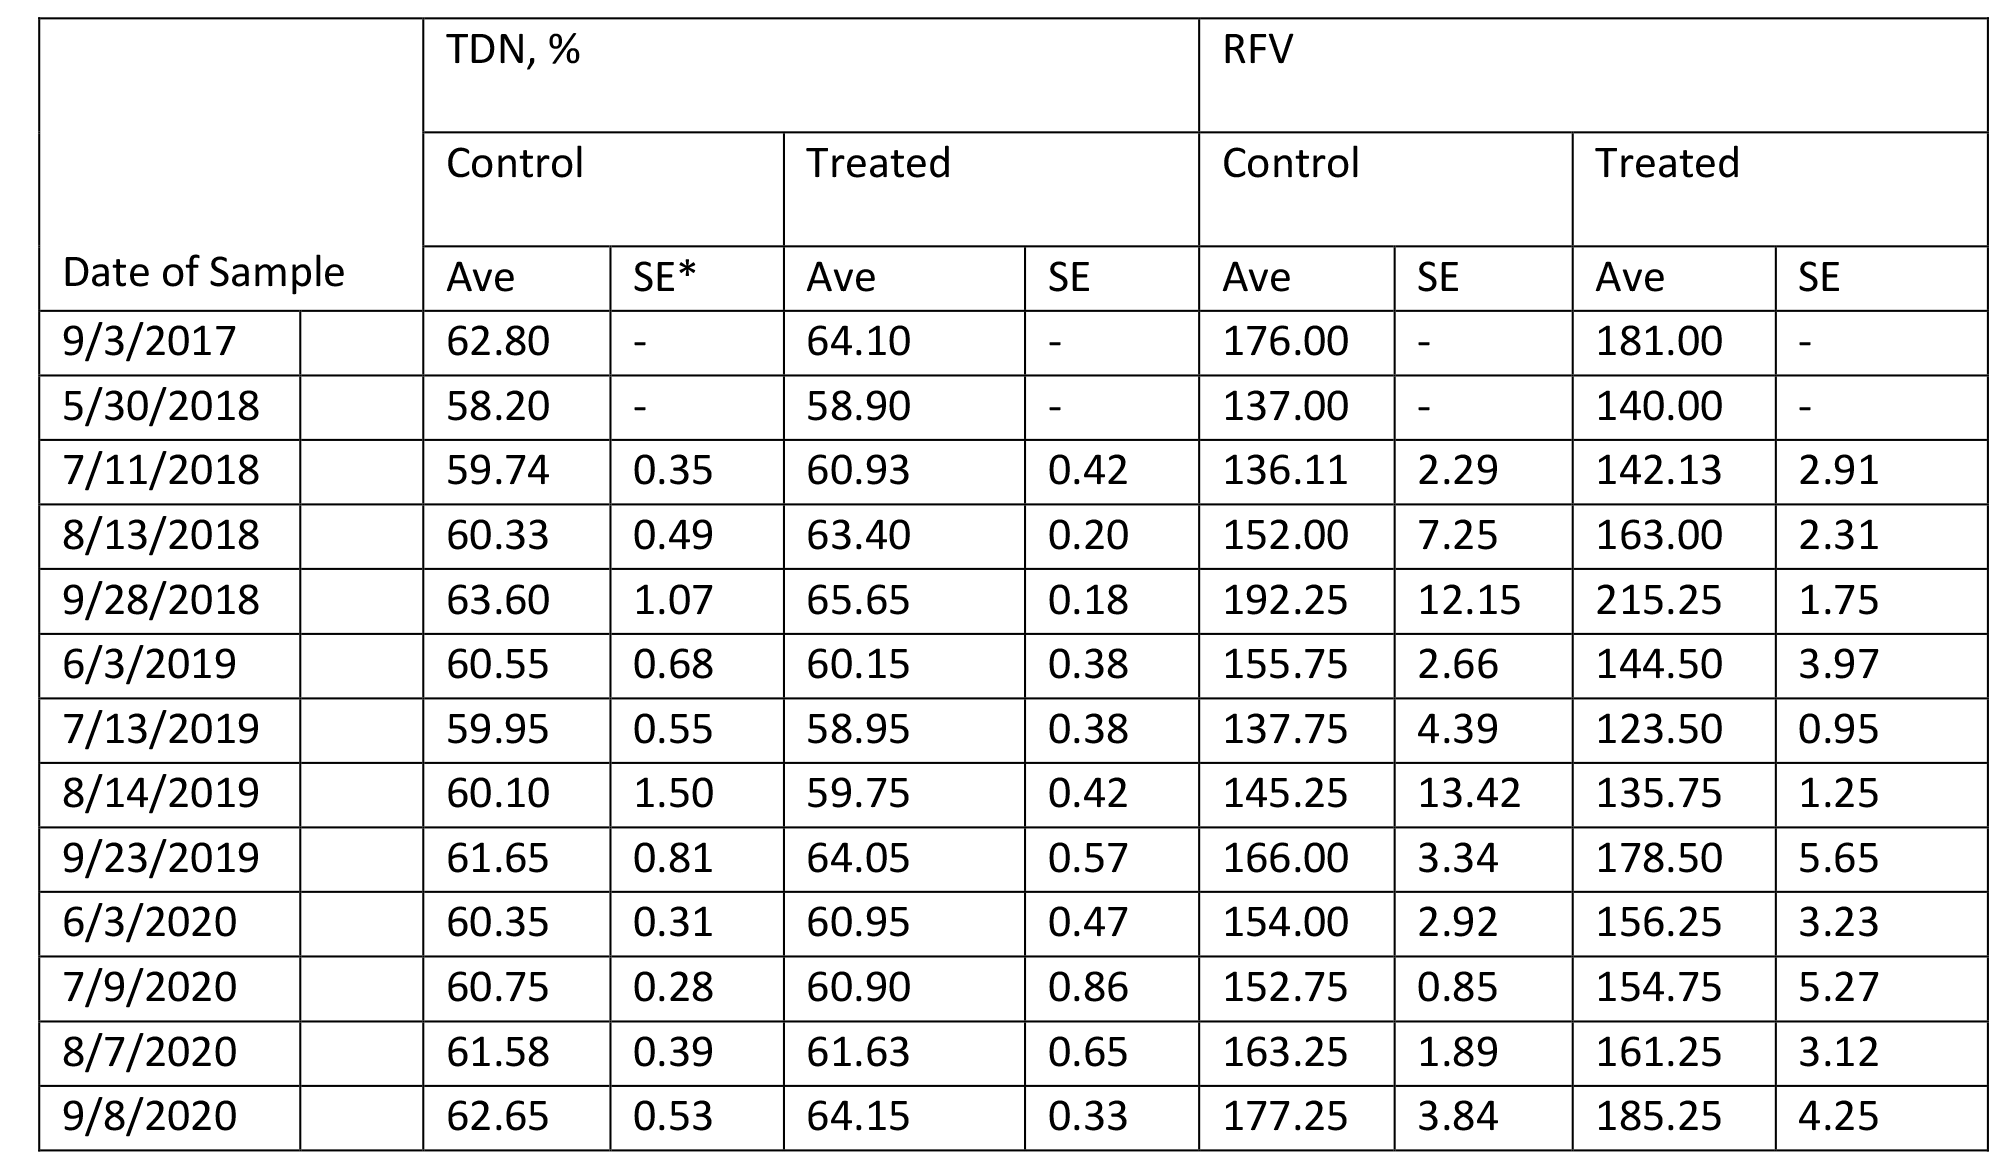
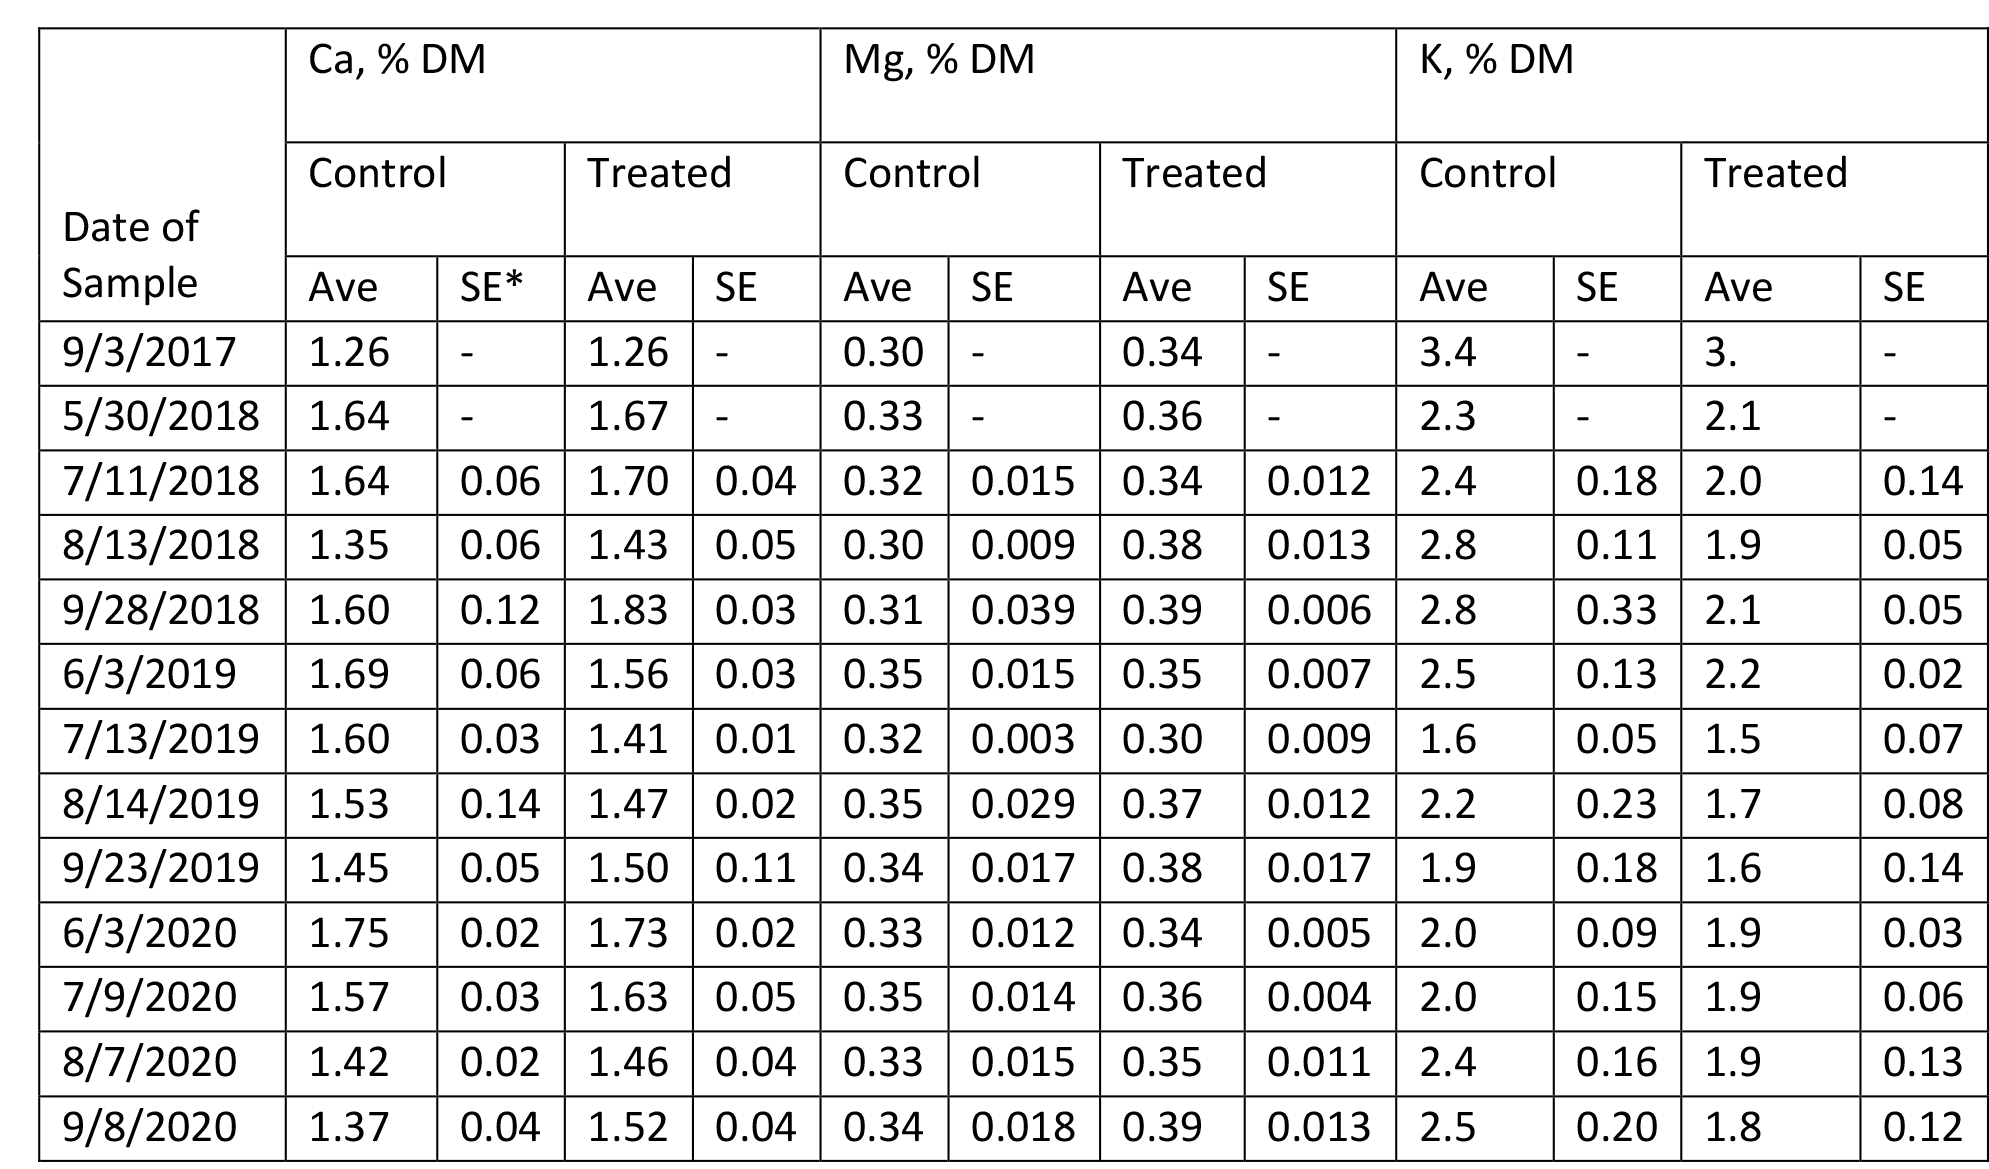
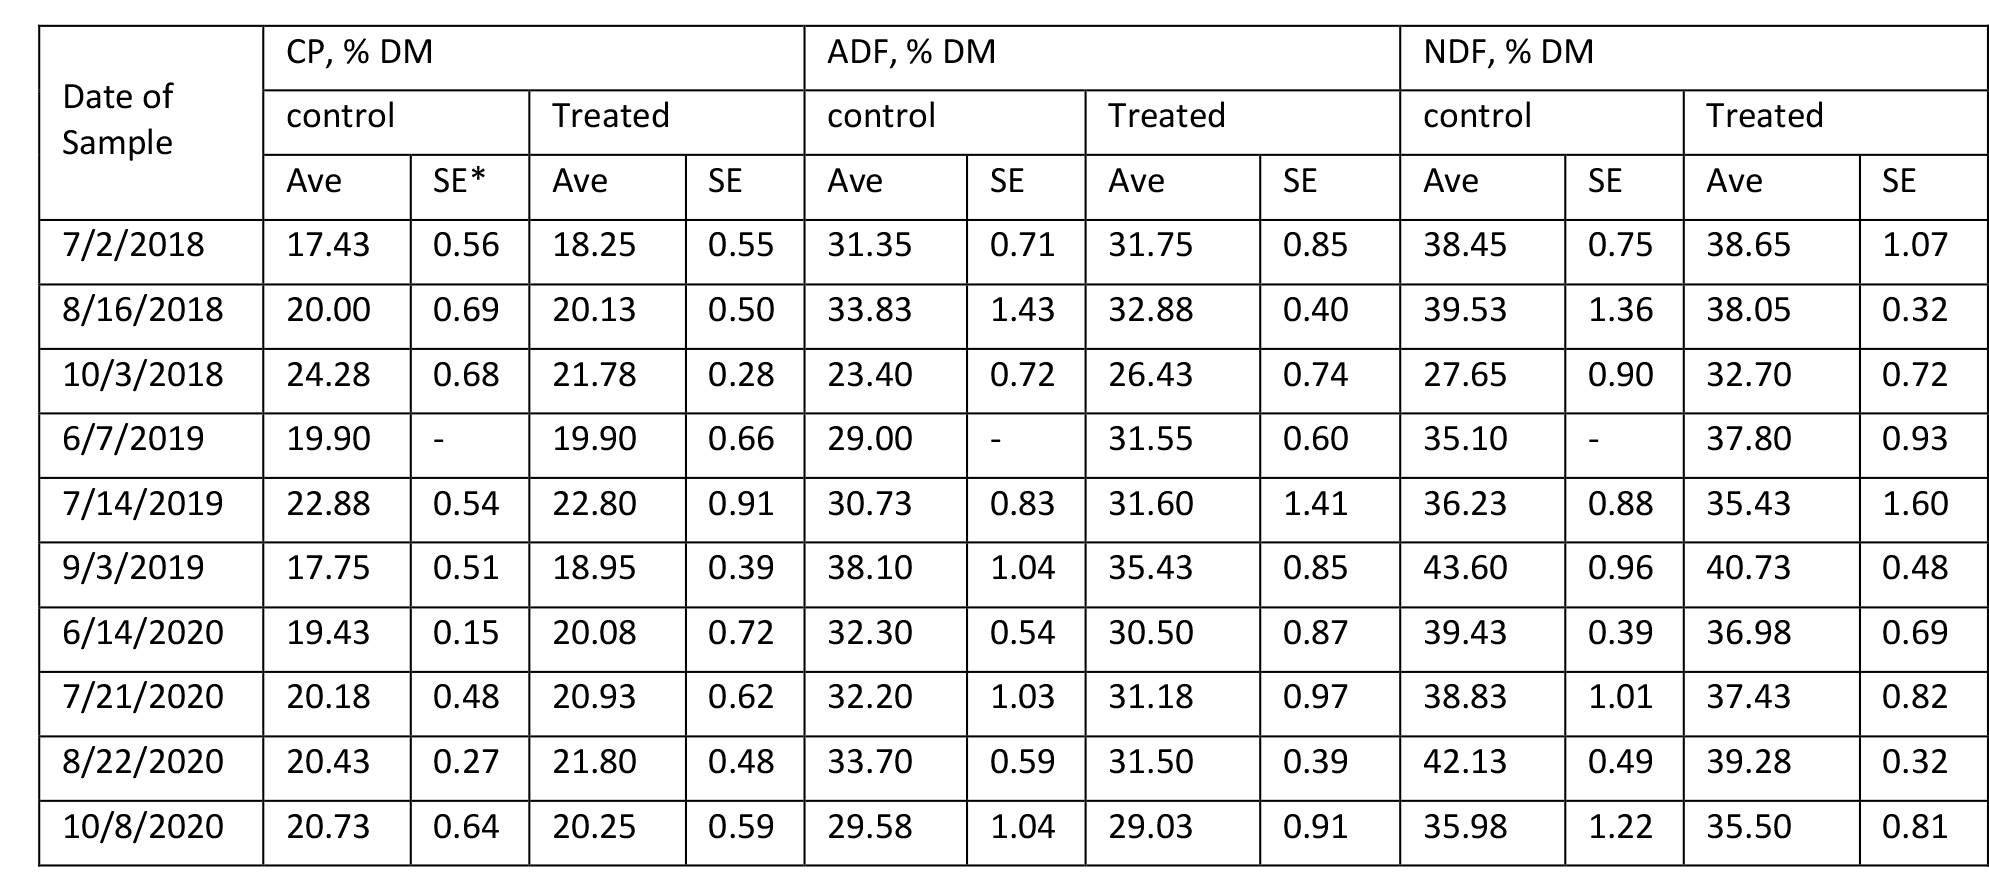
The content of protein, fiber, estimated total digestible nutrients (TDN), relative feed value (RFV), and minerals in Medicago sativa are summarized in Tables 4 – 9 for Farms 1 and 2. The quality of Medicago sativa was comparable at each harvest between sources of P, based on the content of crude protein, acid detergent fiber, and neutral detergent fiber, total digestible nutrients, and relative feed value. When comparing the average for each parameter between sources and across the three years at each farm (data not shown), the data was nearly identical. Content of Ca and Mg varied little across cuttings and treatments over the three years. Potassium was the mineral to vary the greatest across cuttings with a low of 1.3 % of DM to a high of 3.4 % of DM.
Table 4. Composition of Crude Protein and Fiber in Medicago sativa (Farm 1).
*SE with a – indicates a single sample was obtained.
Table 5. Composition of Total Digestible Nutrients and Relative Feed Value in Medicago sativa (Farm 1).
*SE with a – indicates a single sample was obtained.
Table 6. Composition of Minerals in Medicago sativa (Farm 1).
*SE with a – indicates a single sample was obtained.
Table 7. Composition of Crude Protein and Fiber in Medicago sativa (Farm 2).
*SE with a – indicates a single sample was obtained.
Table 8. Composition of Total Digestible Nutrients and Relative Feed Value in Medicago sativa (Farm 2).
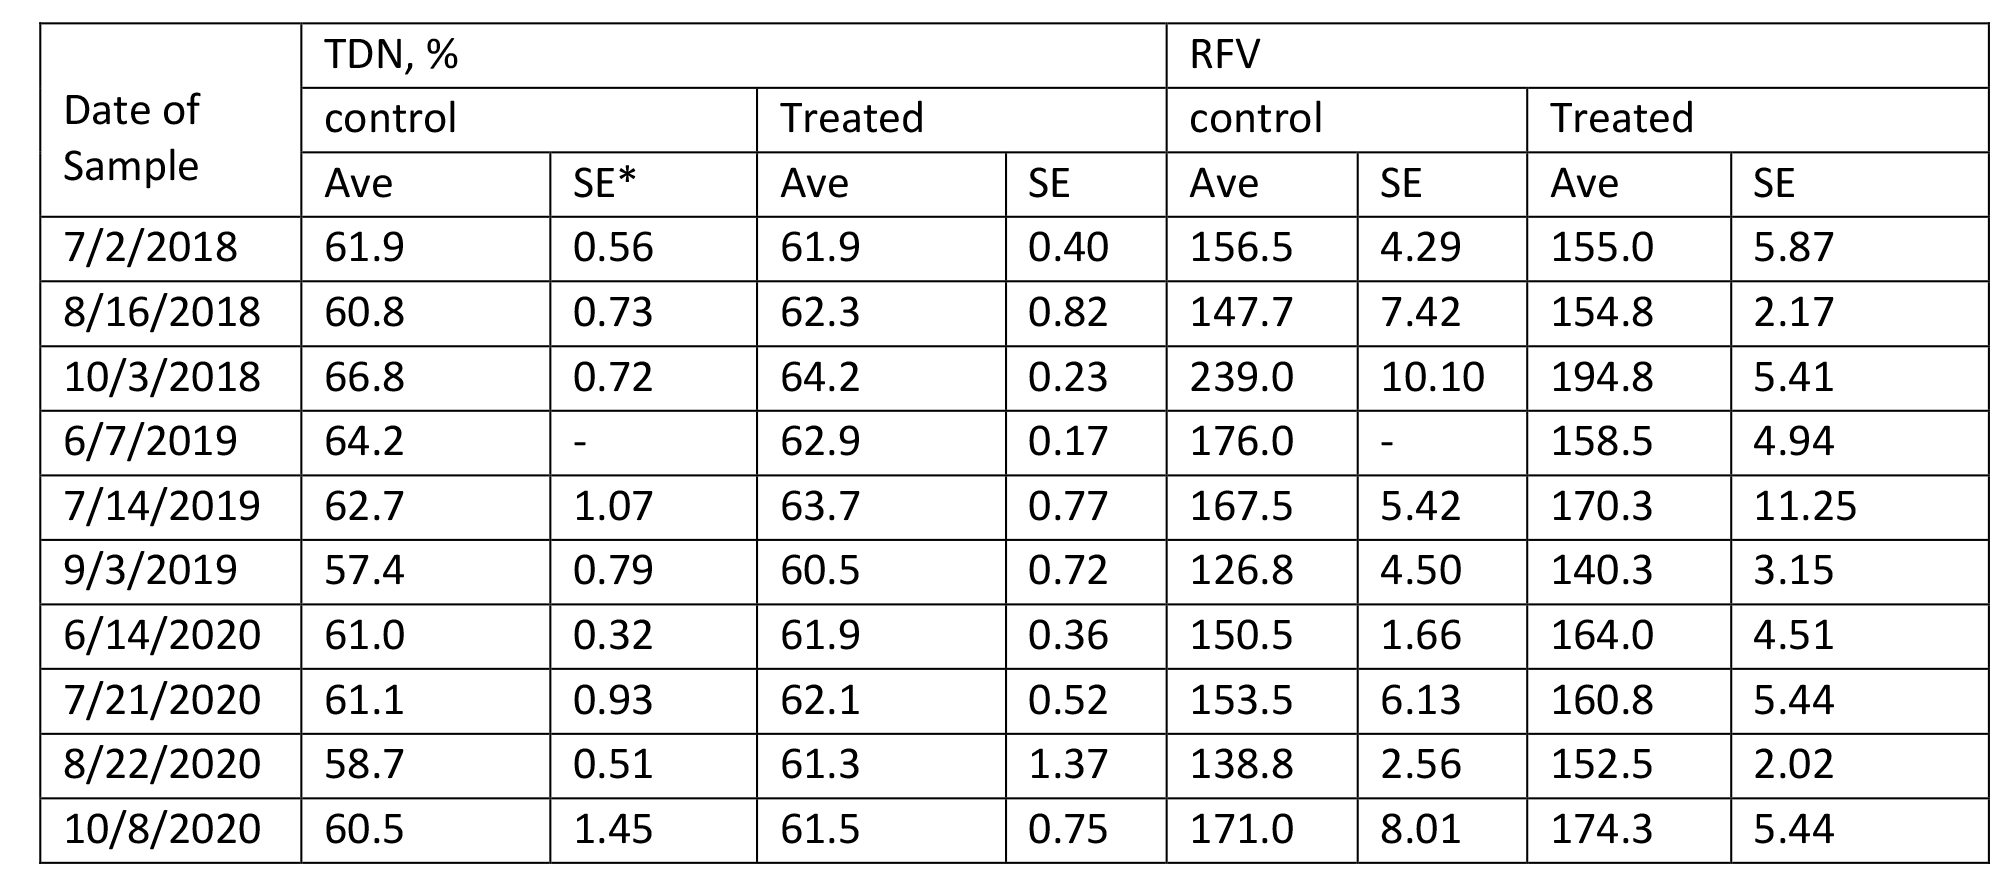
*SE with a – indicates a single sample was obtained.
Table 9. Composition of Minerals in Medicago sativa (Farm 2).
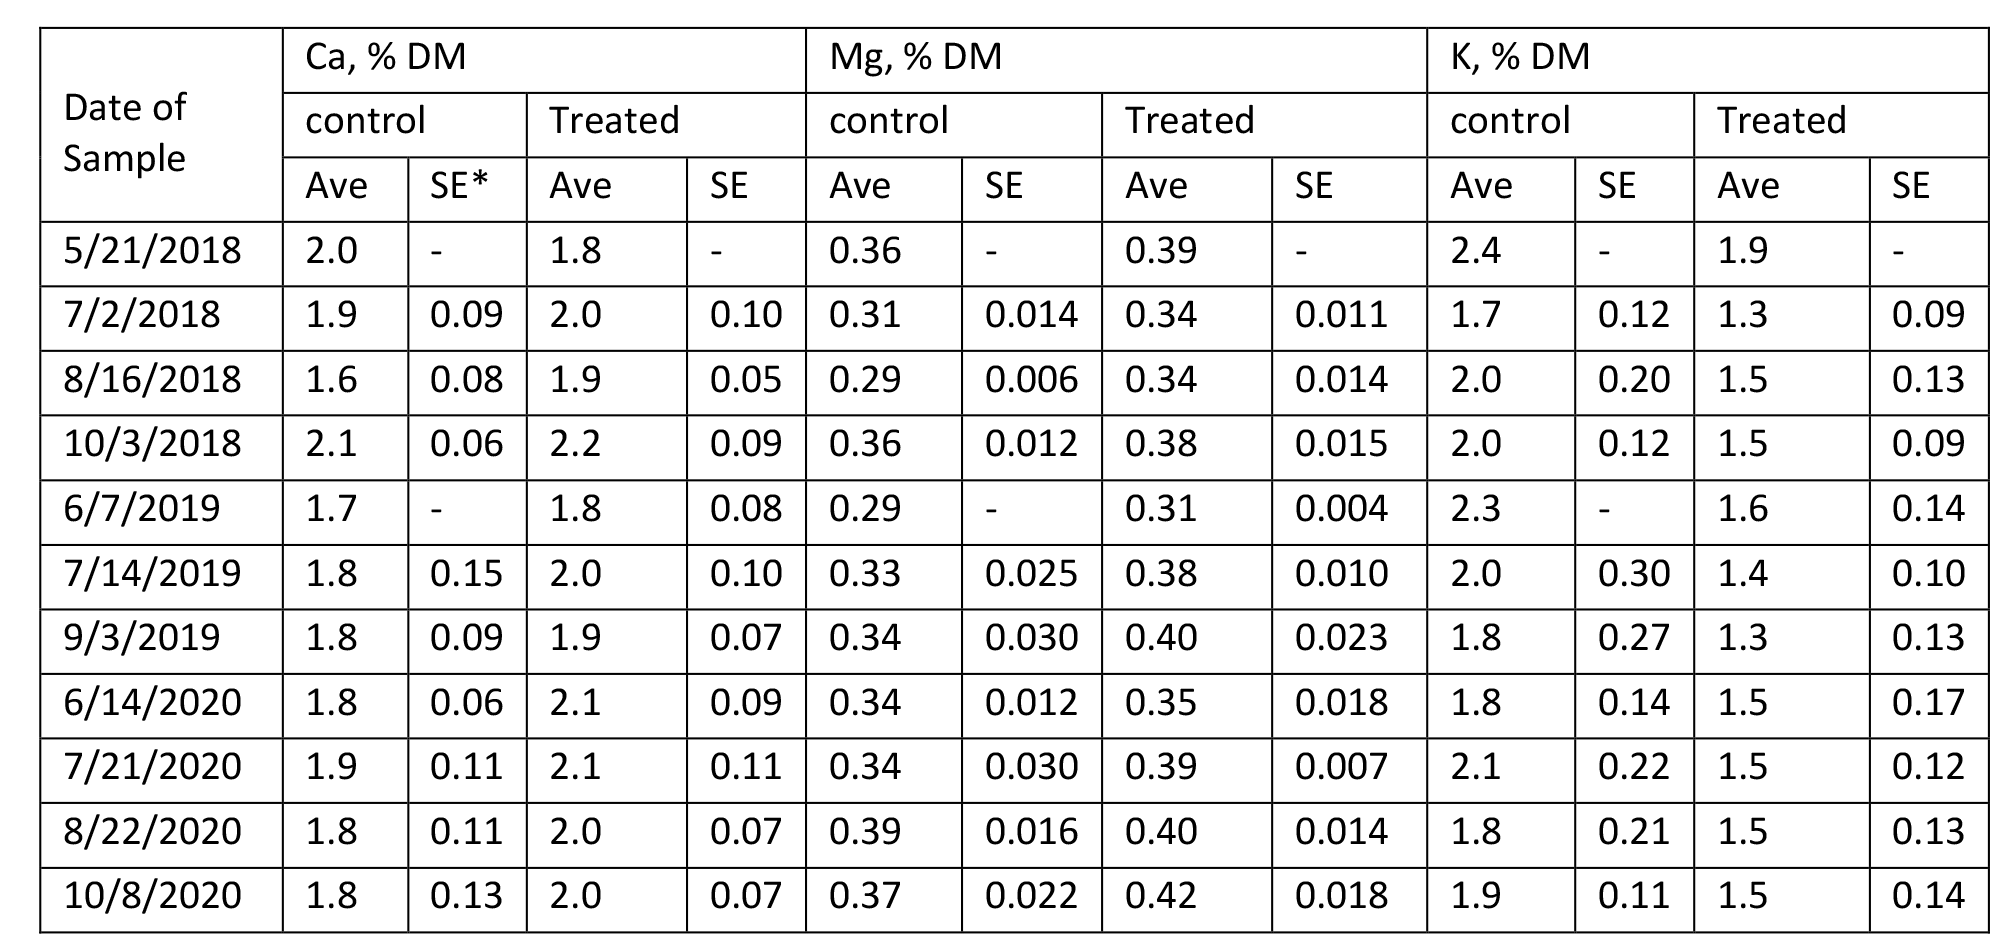
*SE with a – indicates a single sample was obtained.
Summary
The results of this three year case study confirm observations of the availability of P in struvite for crop production in greenhouse and plot studies. In general MAP and struvite could be used interchangeably on a P2O5 basis. In very low testing soils it may be advisable to mix MAP and struvite as struvite has a slower release rate for P.
Acknowledgements
The authors would like to thank RNH Farm of Moses Lake, WA and Bartsma Farm of Kittitas, WA for the availability of their Medicago sativa production fields for the four years of this study.
Financial support was provided through a USDA NRCS conservation innovation grant 69-3A75-17-51, the Washington State Dairy Industry, and Appendix A funding from Washington State University.
Literature Cited
Achat, D. L., Sperandio, M., Daumer, M., Santellani, A., Prud’Homme, L., Akhtar, M., Morel, C., et al. (2014). Plant-availability of phosphorus recycled from pig manures and dairy effluents as assessed by isotopic labeling techniques. Geoderma, 232–234, 24–33.
Bonvin, C., Etter, B., Udert, K. M., Frossard, E., Nanzer, S., Tamburini, F., Oberson, A., et al. (2015). Plant uptake of phosphorus and nitrogen recycled from synthetic source separated urine. Ambio, 44(Suppl 2), 217–227.
Bowers, K. E., & Westerman, P. W. (2005a). Performance of cone-shaped fluidized bed struvite crystallizers in removing phosphorus from wastewater. T. ASAE, 48(3), 1227-1234.
Cabeza, R., Steingrobe, B., Römer,W., Claassen, N., et al. (2011). Effectiveness of recycled P products as P fertilizers, as evaluated in pot experiments. Nutrient Cycling in Agroecosystems, 91, 173.
Chirmuley, D. G. (1994). Struvite precipitation inWWTPs: causes and solutions. Water-Melbourne Then Artarmon-, 21–23.
Demirer, G., & Yilmazel, D. (2013). Nitrogen and phosphorus recovery from anaerobic co-digestion residues of poultry manure and maize silage via struvite precipitation. Waste Manag. Res., 31: 792-804.
Ghosh, G. K., Mohan, K. S., Sarkar, A. K., et al. (1996). Characterization of soil-fertilizer P reaction products and their evaluation as sources of P for gram (Cicer arietinum L.). Nutrient Cycling in Agroecosystems, 46(1), 71–79.
Gonzalez-Ponce, R., Lopez-de-sa, E. G., Plaza, C., et al. (2009). Lettuce response to phosphorus fertilization with struvite recovered from municipal wastewater. HortScience, 44(2), 426–430.
Gonzalez-Ponce, R., & Garcialopez, M. E. (2007). Evaluation of struvite as a fertilizer: a comparison with traditional P sources. Agrochimica, 51(6), 301–308.
Harrison, J., K Fullerton, E Whitefield, and K Bowers. (2021). Struvite production at commercial dairies with use of a mobile system and comparisons to alternative nutrient recovery systems. JEQ under review.
Hilt, K., J Harrison, K Bowers, R Stevens, A Bary, and K Harrison. (2016). Agronomic Response of Crops Fertilized with Struvite Derived from Dairy Manure. Water Air Soil Pollut (2016) 227:388 DOI 10.1007/s11270-016-3093-7.
Koenig, R., D. Horneck, T. Platt, P. Petersen, R. Stevens, S. Fransen, B. Brown. (2009). Nutrient Management Guide for the Dryland and Irrigated Alfalfa in the Inland Northwest. Pacific Northwest Extension Publication, PNW0611 https://s3.wp.wsu.edu/uploads/sites/2071/2014/01/PNW0611-Nutrient-Mgmt-Guide-Dryland-Irrigated-Alfalfa-in-Inland-NW.pdf Accessed 4/23/2021.
Li, X. Z., & Zhao, Q. L. (2003). Recovery of ammonium-nitrogen from landfill leachate as a multi-nutrient fertilizer. Ecological Engineering, 20, 171–181.
Liu, X., Tao, Y., Wen, G., Kong, F., Zhang, X., Hu, Z., et al. (2016). Influence of soil and irrigation water ph on the availability of phosphorus in struvite derived from urine through a greenhouse pot experiment. Journal of Agricultural and Food Chemistry, 64(17), 3324–3329.
Norberg, S., E. Mackey, S. Fransen, J. Harrison, D. Llewellyn, L. Whitefield. (2019). Developing Practical Phosphorus and Potassium Tissue Test Recommendations and Utilizing Struvite in Modern Alfalfa Systems. 2019. Final Research Report to National Alfalfa and Forage Alliance. https://alfalfa.org/pdf/researchArticels/18Norberg-USAFRI-Final.pdf
Norberg, S. and S. Neibergs. (2012). 2012 Enterprise Budget for Establishing and Producing Irrigated Alfalfa in the Washington Columbia Basin. Washington State University Fact Sheet. FS133E. http://ses.wsu.edu/wp-content/uploads/2018/10/FS133E.pdf Accessed 4/23/21.
Plaza, C., Sanz, R., Clemente, C., Fernandez, J. M., Gonzales, R., Polo, A., Colmenarejo, M. F., et al. (2007). Greenhouse evaluation of struvite and sludges frommunicipal wastewater treatment works as phosphorus sources for plants. Journal of Agricultural and Food Chemistry, 55(20), 8206–8212.
Romer, W. (2006). Plant availability of P from recycling products and phosphate fertilizers in a growth-chamber trial with rye seedlings. Journal of Plant Nutrition and Soil Science, 169(6), 826–832.
Ryu, H. D., Lee, H. S., Lee, S. I., et al. (2015). Recovery of nitrogen by struvite precipitation from swine wastewater for cultivating Chinese cabbage. Journal of Environmental Science International, 24, 1253–1264.
Tao, W., Fattah, K. P., & Huchzermeier, M. P. (2016). Struvite recovery from anaerobically digested dairy manure: A review of application potential and hindrances. J Env Mgt. 169: 46-57.
Talboys, P. J., Heppell, J., Roose, T., Healey, J. R., Jones, D. L., Withers, P. J. A., et al. (2016). Struvite: a slow-release fertiliser for sustainable phosphorus management? Plant and Soil, 401(1), 109–123.
Undersander, D., D. Cosgrove, Eileen Cullen, C. Grau, M. Rice, M. Renz, C. Sheaffer, G. Shewmaker, M. Skulc. (2011). Alfalfa Management Guide. American Society of Agronomy. https://www.agronomy.org/files/publications/alfalfa-management-guide.pdf
U.S. Geological Survey, Mineral Commodity Summaries. (2021)..R e s o u r c e d o c u m e n t . h t t p : / / m i n e r a l s . u s g s .gov/minerals/pubs/commodity/phosphate_rock/mcs-2013-phosp.pdf. Accessed 6 April 2021.
Vogel, T., Nelles, M., Eichler-Löbermann, B., et al. (2015). Phosphorus application with recycled products from municipal waste water to different crop species. Ecological Engineering, 83, 466–475.
