Journal of the NACAA
ISSN 2158-9429
Volume 6, Issue 1 - May, 2013
Meeting Horticulture Clientele Interests in an Urban Setting: A Needs Assessment for Reduced Pesticide and Pollinator Education in the Greater Salt Lake Area
- Wagner, K., Horticultural Agent, Utah State University Extension
Kuhns, M., Professor and Extension Specialist, Utah State University Extension
ABSTRACT
It is important for Extension to conduct needs assessments for urban areas because the needs of urban clientele often differ from traditional rural clientele. A brief survey was administered to attendees of a popular festival in Salt Lake County to determine interest in reduced pesticide gardening and pollinator education. Survey results showed substantial interest in reduced pesticide gardening and pollinator education and found the top-rated ways to access information from Extension are factsheets, email, and classes. Survey participants favored online resources over face-to-face contact. These results will impact future programming and outreach efforts by Salt Lake County Extension horticulture faculty.
Introduction
Urban settings present unique challenges for effective Extension programming. Needs of clientele that can be met by Extension are likely to be much different in dense urban areas than in suburban or rural areas. One study found Texans in rural counties focused on waste management of manure disposal at feedlots and dairies while urban counties focused on disposal of lawn clippings, leaves and home recycling (Fehlis 1992). Although historically the Cooperative Extension Service was referred to as the Agriculture Extension Service due to its focus on assisting rural agricultural communities (Yep 1981), many agricultural communities today are situated alongside densely populated areas (Lamm 1992). Therefore, resident needs may differ across the same county, and it is important for Extension faculty to assess and consider community needs when developing Extension programming.
There are multiple methods for completing needs assessments. For example, the most common needs assessment techniques by Extension staff in Pennsylvania are group discussions by advisory committees, written surveys, brainstorming sessions, county forums, and nominal group processes (Etling 1995). Here we discuss one needs assessment technique used by Salt Lake County (Utah) horticulture Extension faculty to support or reject a hypothesis of gardening preferences in an urban county. Surveys were conducted at the 2012 and 2013 Salt Lake Tribune Home and Garden Festival, a well attended annual event, to establish a baseline to assess Extension horticulture programming needs for the greater Salt Lake area, particularly related to pesticide use.
Salt Lake County Demographics
Salt Lake County is a densely populated metro area with a total population in 2010 of 1.03 million, 37% of the total population of Utah (2,763,855) (US Census Data 2010). That equates to a population density of 1,387 persons per square mile. The per capita income in the past 12 months (2010) is $25,041, with 10.3% of the population living below the poverty level and 4.3% unemployment rate. The high school graduation rate for residents 25 years of age and older is 89%. Thirty percent of 25+ year old residents completed a Bachelor’s degree or higher. Most (69%) Salt Lake County residents own their own home. Salt Lake County is approximately 75% developed, with 9% of the land area used for agriculture (USDA NRCS 2012). The age distribution is 11% 18-24 years old, 30% 25-44 years old and 21% 45-64 years old (US Census Data 2010). Several connecting counties (Utah, Salt Lake, Davis, Weber and Box Elder) form the Wasatch Front, which is home to 1.7 million residents or 59% of Utah’s population. Due to Salt Lake County’s urbanization, Extension horticulture faculty there primarily address yard and garden inquiries, rather than commercial agriculture.
Like many communities across the United States, Salt Lake County has recently witnessed a growing interest in local food production. In 2012, Salt Lake County housed 15 farmer’s markets (6 in 2009), 38 community gardens (at least 23 new gardens since 2009), 10 community supported agriculture (CSA) producers (4 in 2003) and numerous local restaurants and markets that feature regionally supported agriculture (RSA) foods (Edible Wasatch 2012, Salt Lake County Urban Farming Initiative 2012, Wasatch Community Gardens 2012, CSA Utah 2012). In addition to producers, restaurateurs and grocers, Salt Lake County residents seem increasingly interested in urban production of fresh fruits and vegetables. This observation is similar to results of a study of horticulture trends in Maryland, a largely urbanized state (Healy 1991).
Purpose
The purpose of the study was to better understand the fruit and vegetable production preferences of Salt Lake County residents so Extension programming can be developed to better meet this demand. Public demand for education on reduced pesticide use has not been thoroughly reported in the literature. In a study of 510 Extension educators across the country on homeowner pesticide information requests, Church, Buhler, Bradley and Stinner (2012) reported that Extension faculty most commonly assist residents with proper pesticide product selection, determination of the correct use rate, and clarification of product formulation differences and label directions. They indicated a need for more needs assessments focused on public fruit and vegetable production preferences. They also found considerable public demand for information on organic alternatives, Integrated Pest Management (IPM) and impacts of pesticides on beneficial insects and pollinators.
It is widely reported that farmers and commercial pesticide applicators who receive application training and routinely apply pesticides are more likely to use products according to the label (Hopwood et.al. 2012; Church, Buhler, Bradley and Stinner 2012). In a 2012 study on homeowner pesticide information requests, Church, Buhler, Bradley and Stinner (2012) reported that “homeowners who have no formal training in pest management or pesticide handling may unknowingly put themselves, others and the environment at risk when making unnecessary and unsafe pesticide applications”. Hopwood et.al. (2012) reported potential higher rates of application (up to 120 times greater) of neonicotinoid pesticides on landscape plants and lawn than rates approved for agricultural crops. Therefore Extension programming focused on reduced pesticide use in urban settings is important due to serious environmental and health implications associated with improper application of pesticides. Pesticides may be harmful to non-targeted flora and fauna and can pollute nearby waterways (USGS 1999). One example of a controversial topic of recent interest is the potential impact of neonicotinoid use on honey and native bee health (Hopwood et.al. 2012).
We hypothesize that Salt Lake County residents prefer to grow fruits and vegetables using low-pesticide input gardening practices and are interested in pollinator promotion. Therefore Extension educators should focus more programming efforts in these areas. This study also addressed how clientele would prefer to access information from Extension. We also hypothesized that, due to the urbanization of Salt Lake County, clientele would prefer to access Extension information through online resources over person-to-person contact. The results of this study will impact how Extension horticulture faculty provides outreach to Salt Lake County residents.
Methods
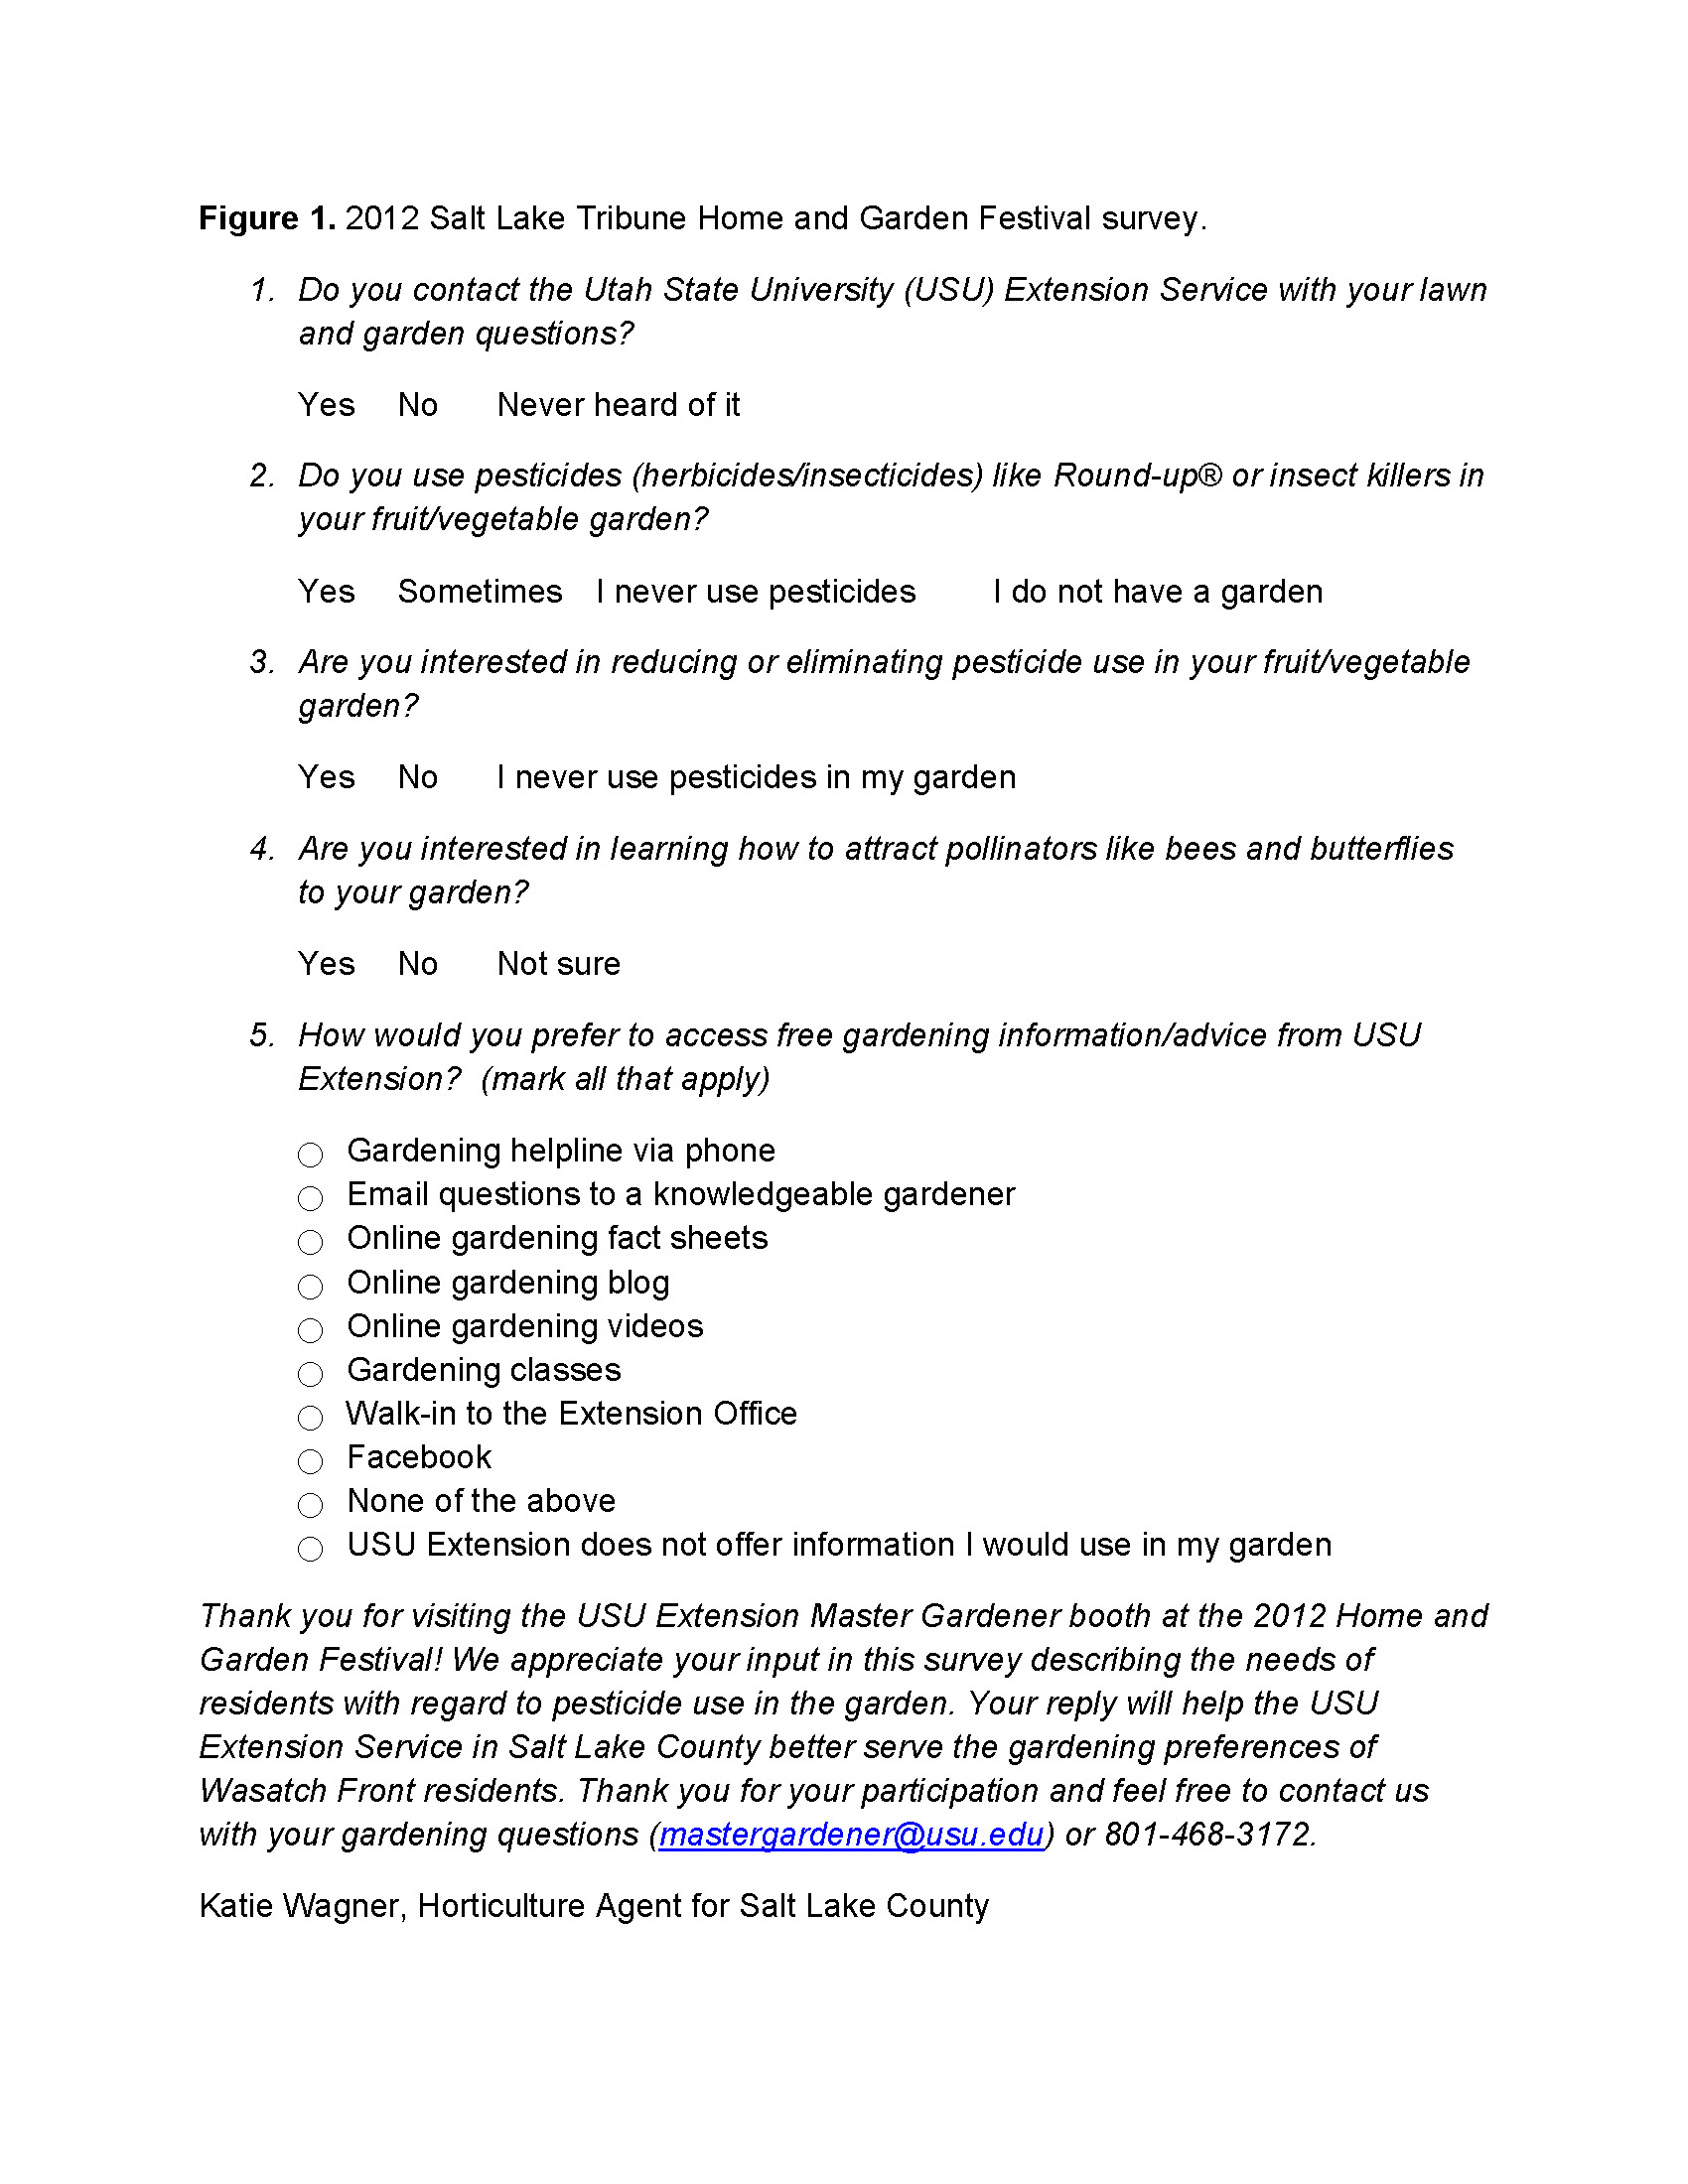
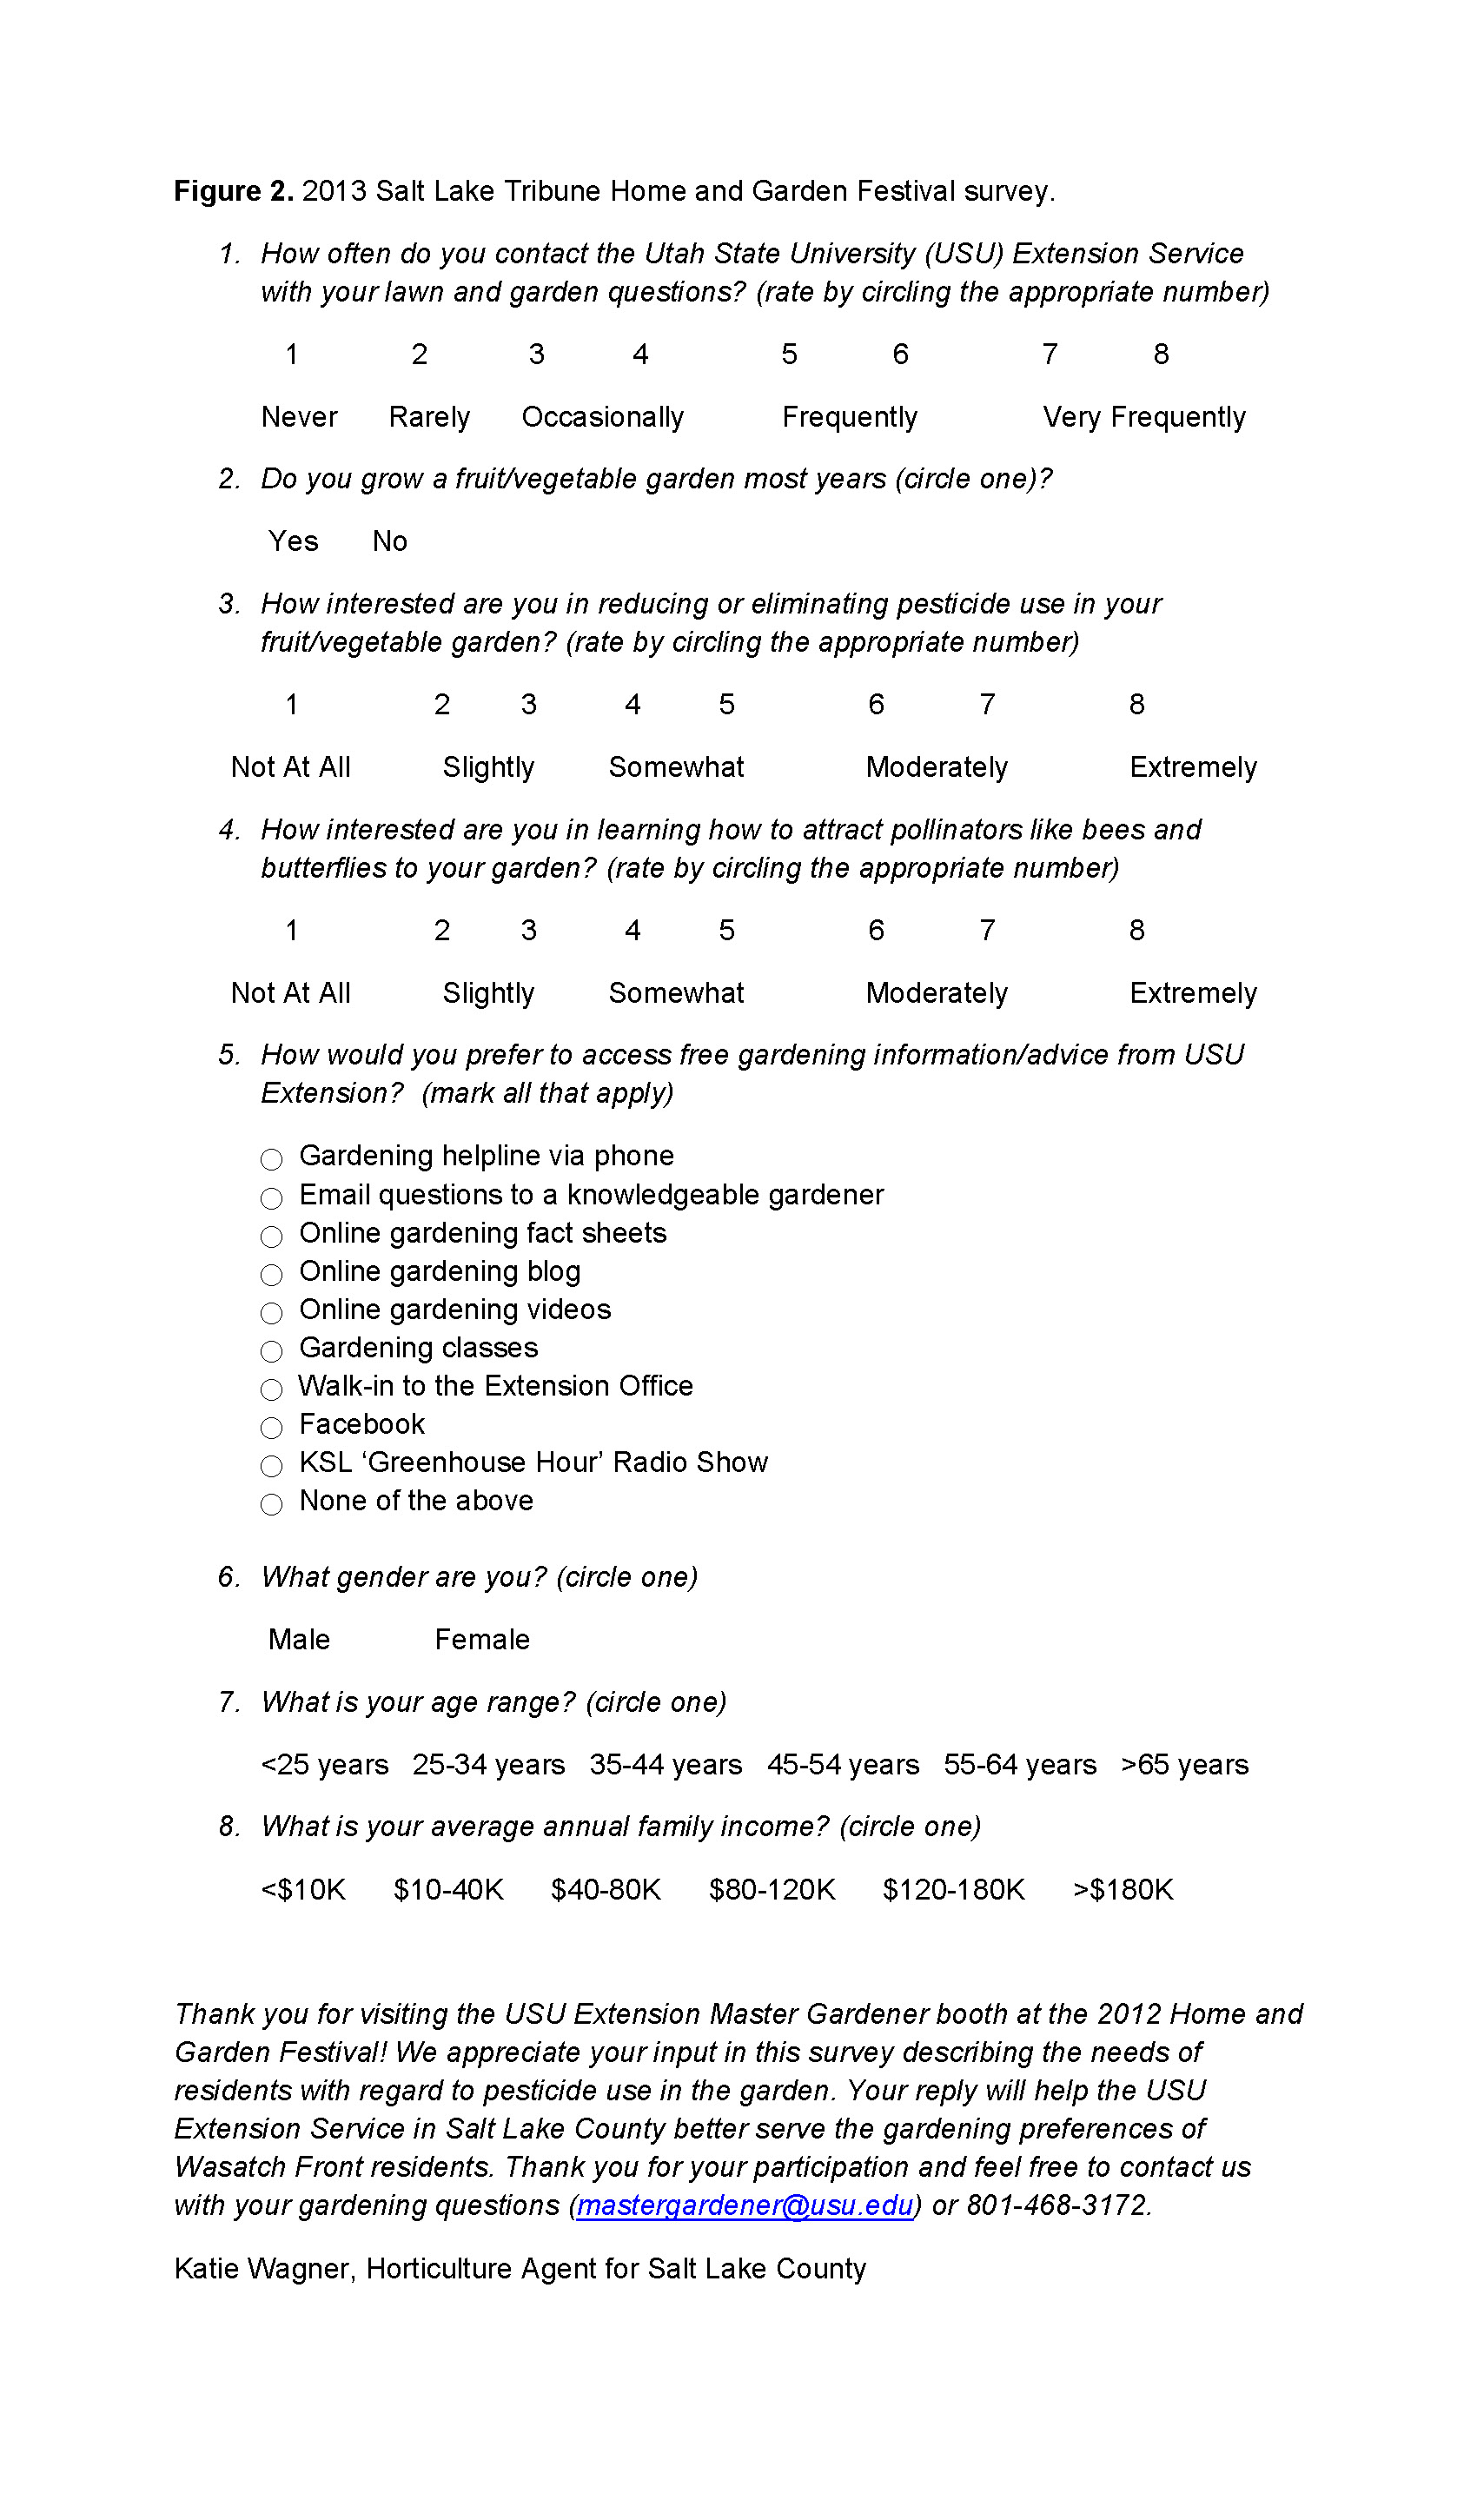
A brief five question survey (Figure 1) was handed out to attendees of the 2012 Salt Lake Tribune Home and Garden Festival who stopped by a booth staffed with USU Extension Master Gardener volunteers. The survey was lengthened to eight questions (Figure 2) in 2013, rating scales were added, and we collected additional demographic information. Survey participants were informed that results would be assessed to better guide programming efforts by horticulture faculty to meet the educational interests of county residents. Festival staff reported that over 42 thousand people attended the 2012 festival.
To be able to determine how representative our surveyed group was, we obtained the following after-show festival statistics from event organizers in 2012 and compared them to Census data where possible. These statistics include:
- 82% of attendees were homeowners (65.8% of Salt Lake County residents are homeowners);
- 75% of attendees were between 54 and 75 years old (14% of Salt Lake County residents are in this same age range);
- 67% attended with spouse (55% of Salt Lake County residents are married); and
- 70% of attendees had incomes of $50,000 to $75,000 (21% of Salt Lake County residents claim income in this range) (US Census Data 2010).
Therefore, after-show statistics for 2012 revealed that the surveyed population was considerably older and wealthier than the average Salt Lake County resident, but was only slightly more likely to own their home, and it can't be determined whether they were married or not.
Survey results from 2013 had the largest proportion of the surveyed population (40%) between 55 and 64 years old. The most common family income reported was $40,000 to 80,000 (32%). Therefore, 2013 surveys indicated a similar population compared to 2012. In addition, we found that 30% of survey participants were male and 61% were female (10% did not answer this question). These differences should be considered when generalizing our results to the broader festival population or the population of Salt Lake County.
Extension horticulture faculty observed that it took approximately 10 to 15 seconds for participants to complete the survey. The brevity of the questions may have increased the amount of returned surveys, though the effect of questionnaire length on response rate is controversial in the literature (Bogen 1982). USU Extension Master Gardener volunteers facilitated survey completion by attaching coin envelopes containing sugar snap pea seeds and USU Extension business cards. The business card lists the Salt Lake County Extension office location, helpline phone number and email address where clientele can send questions and photos for further assistance with gardening questions.
Master Gardener volunteers collected 522 completed surveys in 2012 from an estimated 685 event attendees that approached the Master Gardener booth for an approximate 76% completion rate. In 2013, 210 completed surveys were collected from an estimated 345 attendees that approached the booth for an approximate 61% completion rate. All attendees who approached the booth were asked to complete the survey in both years. Sometimes only one member of a couple chose to fill out the survey. It was observed that very few of the festival attendees who approached the Master Gardener booth declined the request to complete the survey.
Survey results were compiled in a spreadsheet and analyzed by comparing means and totals. We consider the people who came by the USU Extension Master Gardener booth as the population we studied for this project, not all of the attendees of the festival. Therefore we don't try to make inferences about other festival attendees or residents of the county overall. The study design and publication plans were reviewed by USU's Institutional Review Board and we obtained permission to publish survey results.
Results and Discussion
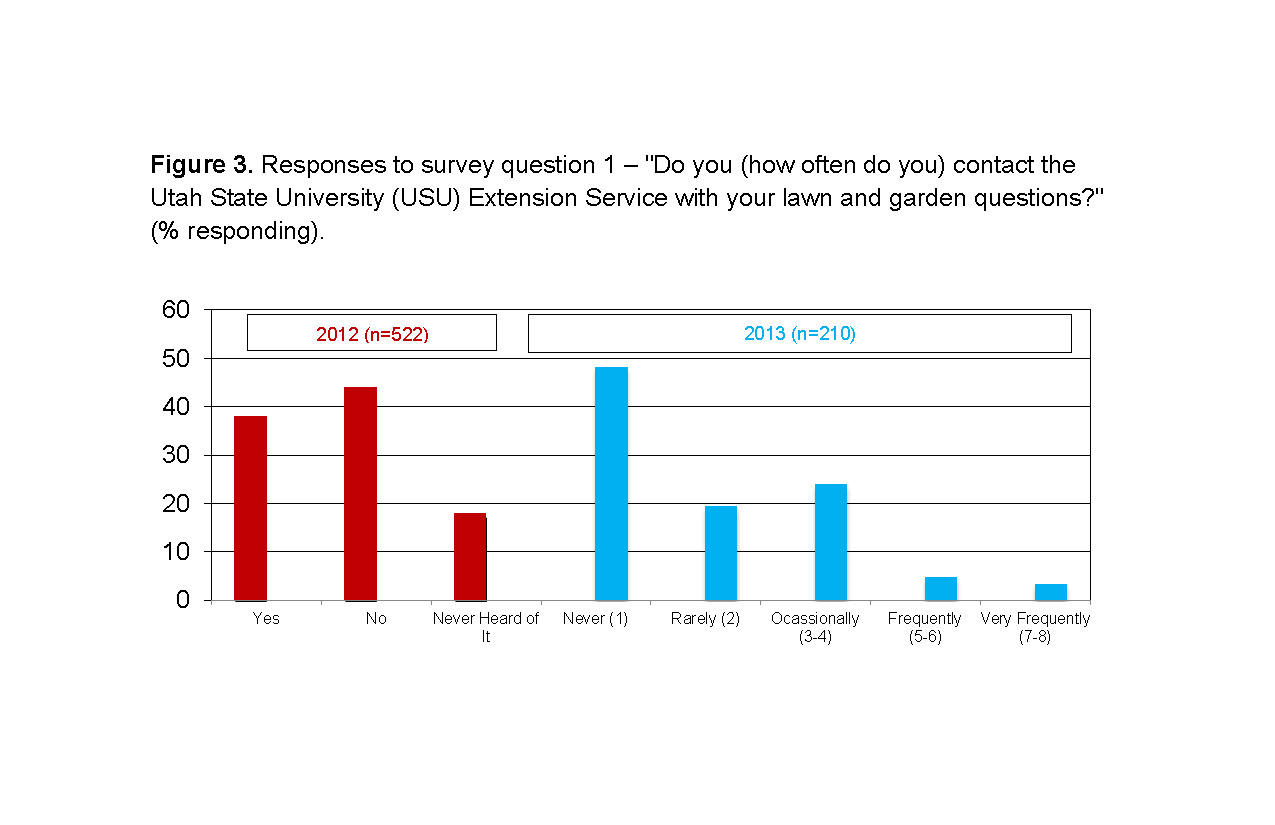
The 2012 survey found that over a third of respondents contact the USU Extension Service with lawn and garden questions, but almost two-thirds do not (the combination of "No" and "Never Heard of It" answers; 62%) (Figure 3). Only a small proportion had never heard of Extension prior to the event, which goes against common thought that few people are aware of Extension in urban areas (Yep 1981). The 2013 survey found 68% of surveyed participants never (48%) or rarely (20%) contact Extension with questions. One reason why many residents do not contact USU Extension with gardening questions may include perceived difficulty accessing Extension expertise and relative ease accessing other sources of gardening information such as garden center staff. Kuhns and Reiter (2009) found that 47% of respondents to a tree-care-related survey used nurseries for tree-related information, compared to only 29% using Extension. Trust was different though. Only 21% who used nurseries trusted the tree information they got from them, while 60% trusted Extension.
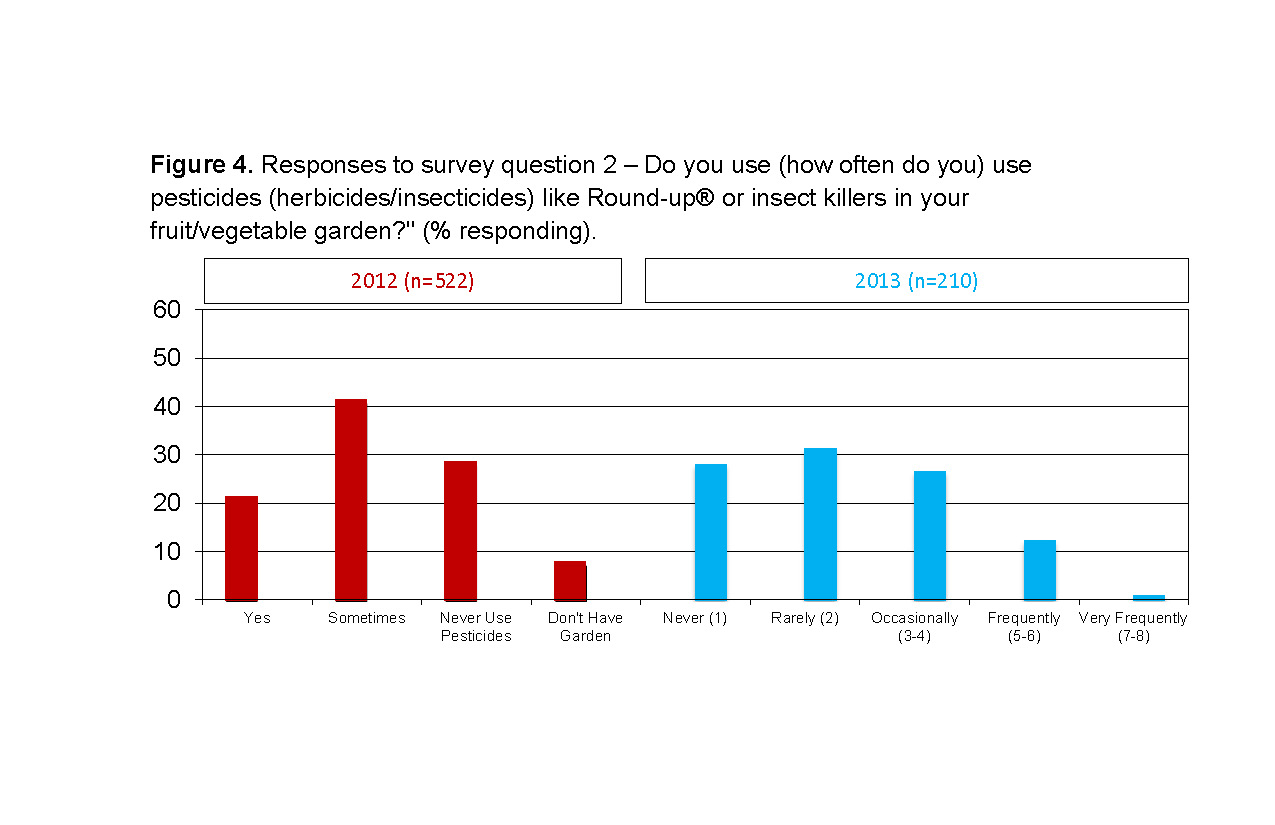
 In 2012 nearly all respondents had a garden of some kind, though perhaps this was to be expected given that participants were attending a home and garden show. Almost two-thirds of respondents in 2012 use pesticides to some extent in their fruit or vegetable garden compared to almost three-fourths in 2013 (Figure 4). This result is fairly similar to a national survey by the EPA (1992) that reported that 85% of U.S. households had at least one pesticide in storage. Because less than 10% of respondents stated they do not have a garden, lack of a garden space is not likely to greatly impact other response choices. With the after-show statistics indicating that 82% of attendees were homeowners, and our results indicating that nearly all have gardens, it appears that the vast majority of survey respondents grow fruits and/or vegetables at home and many of those use no pesticides. The 2013 survey results found 83% of respondents grow fruits or vegetables in most years (Figure 5).
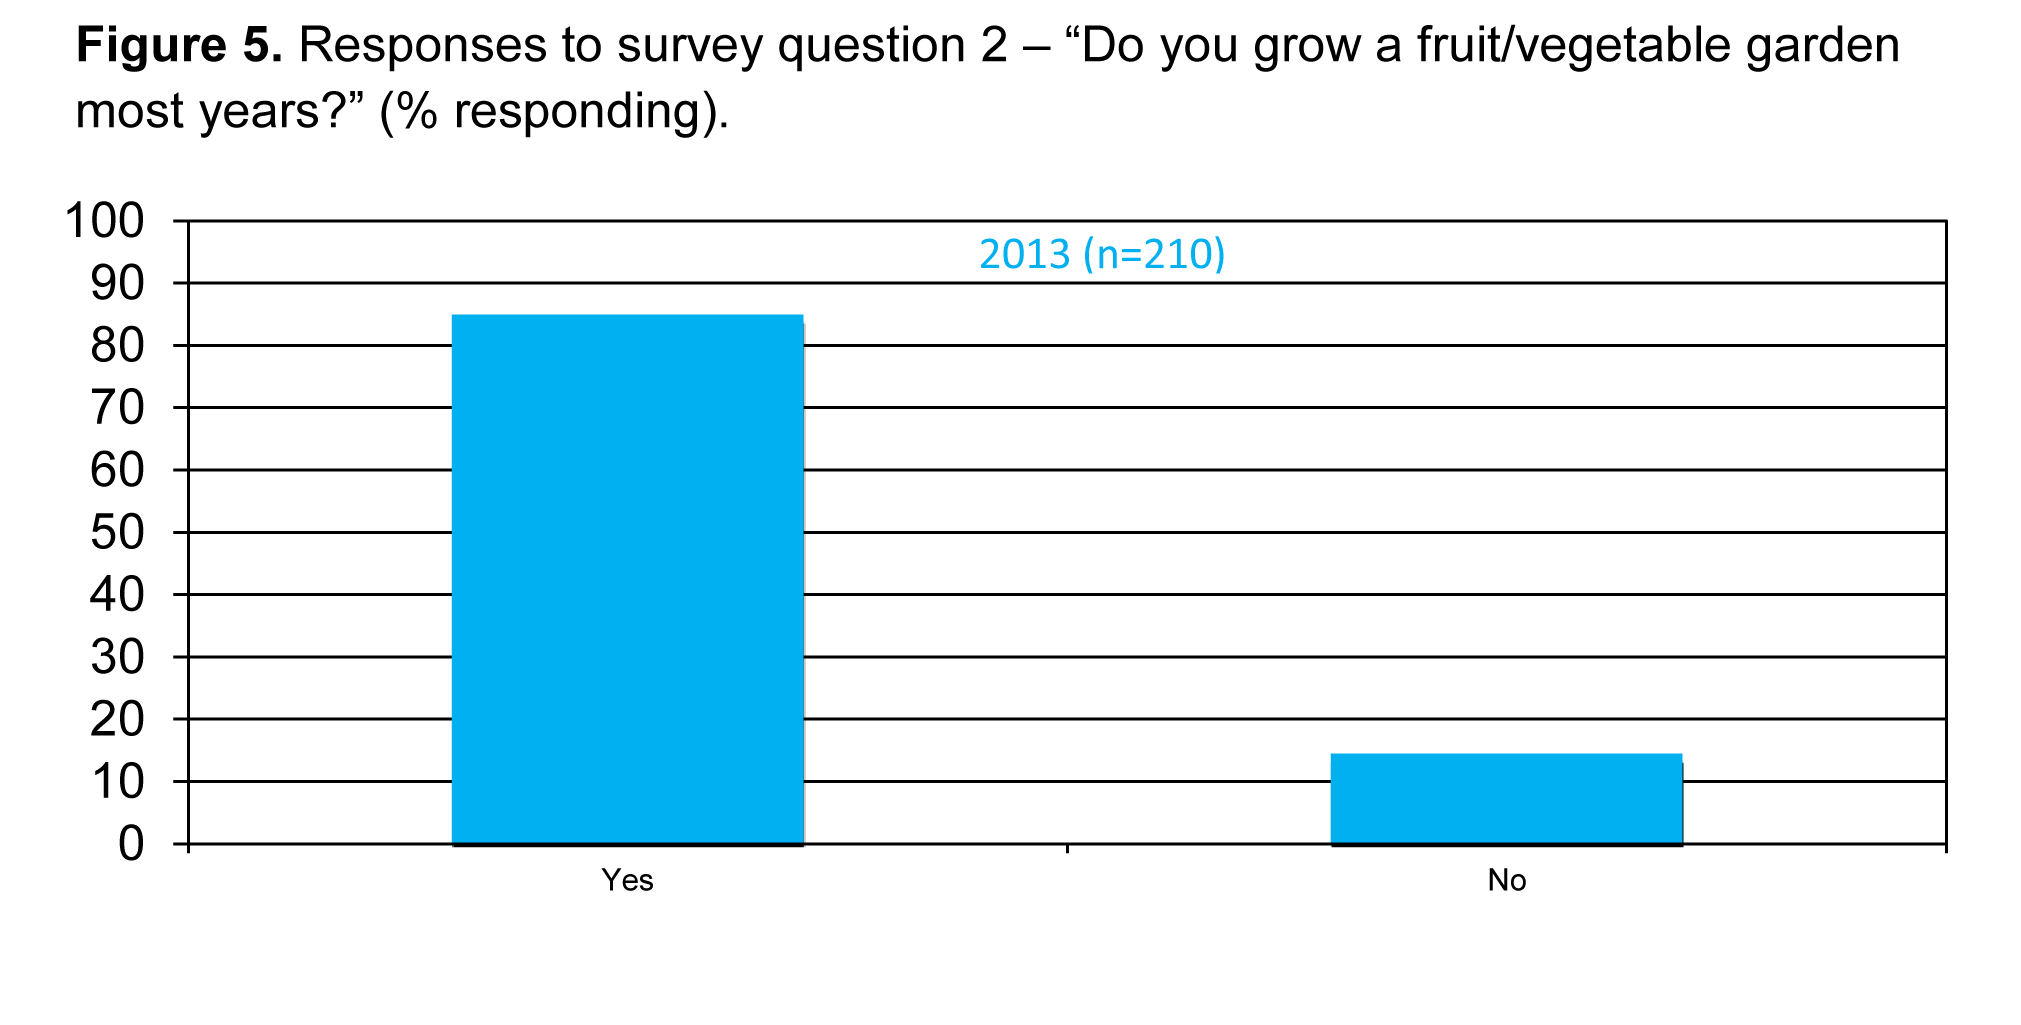
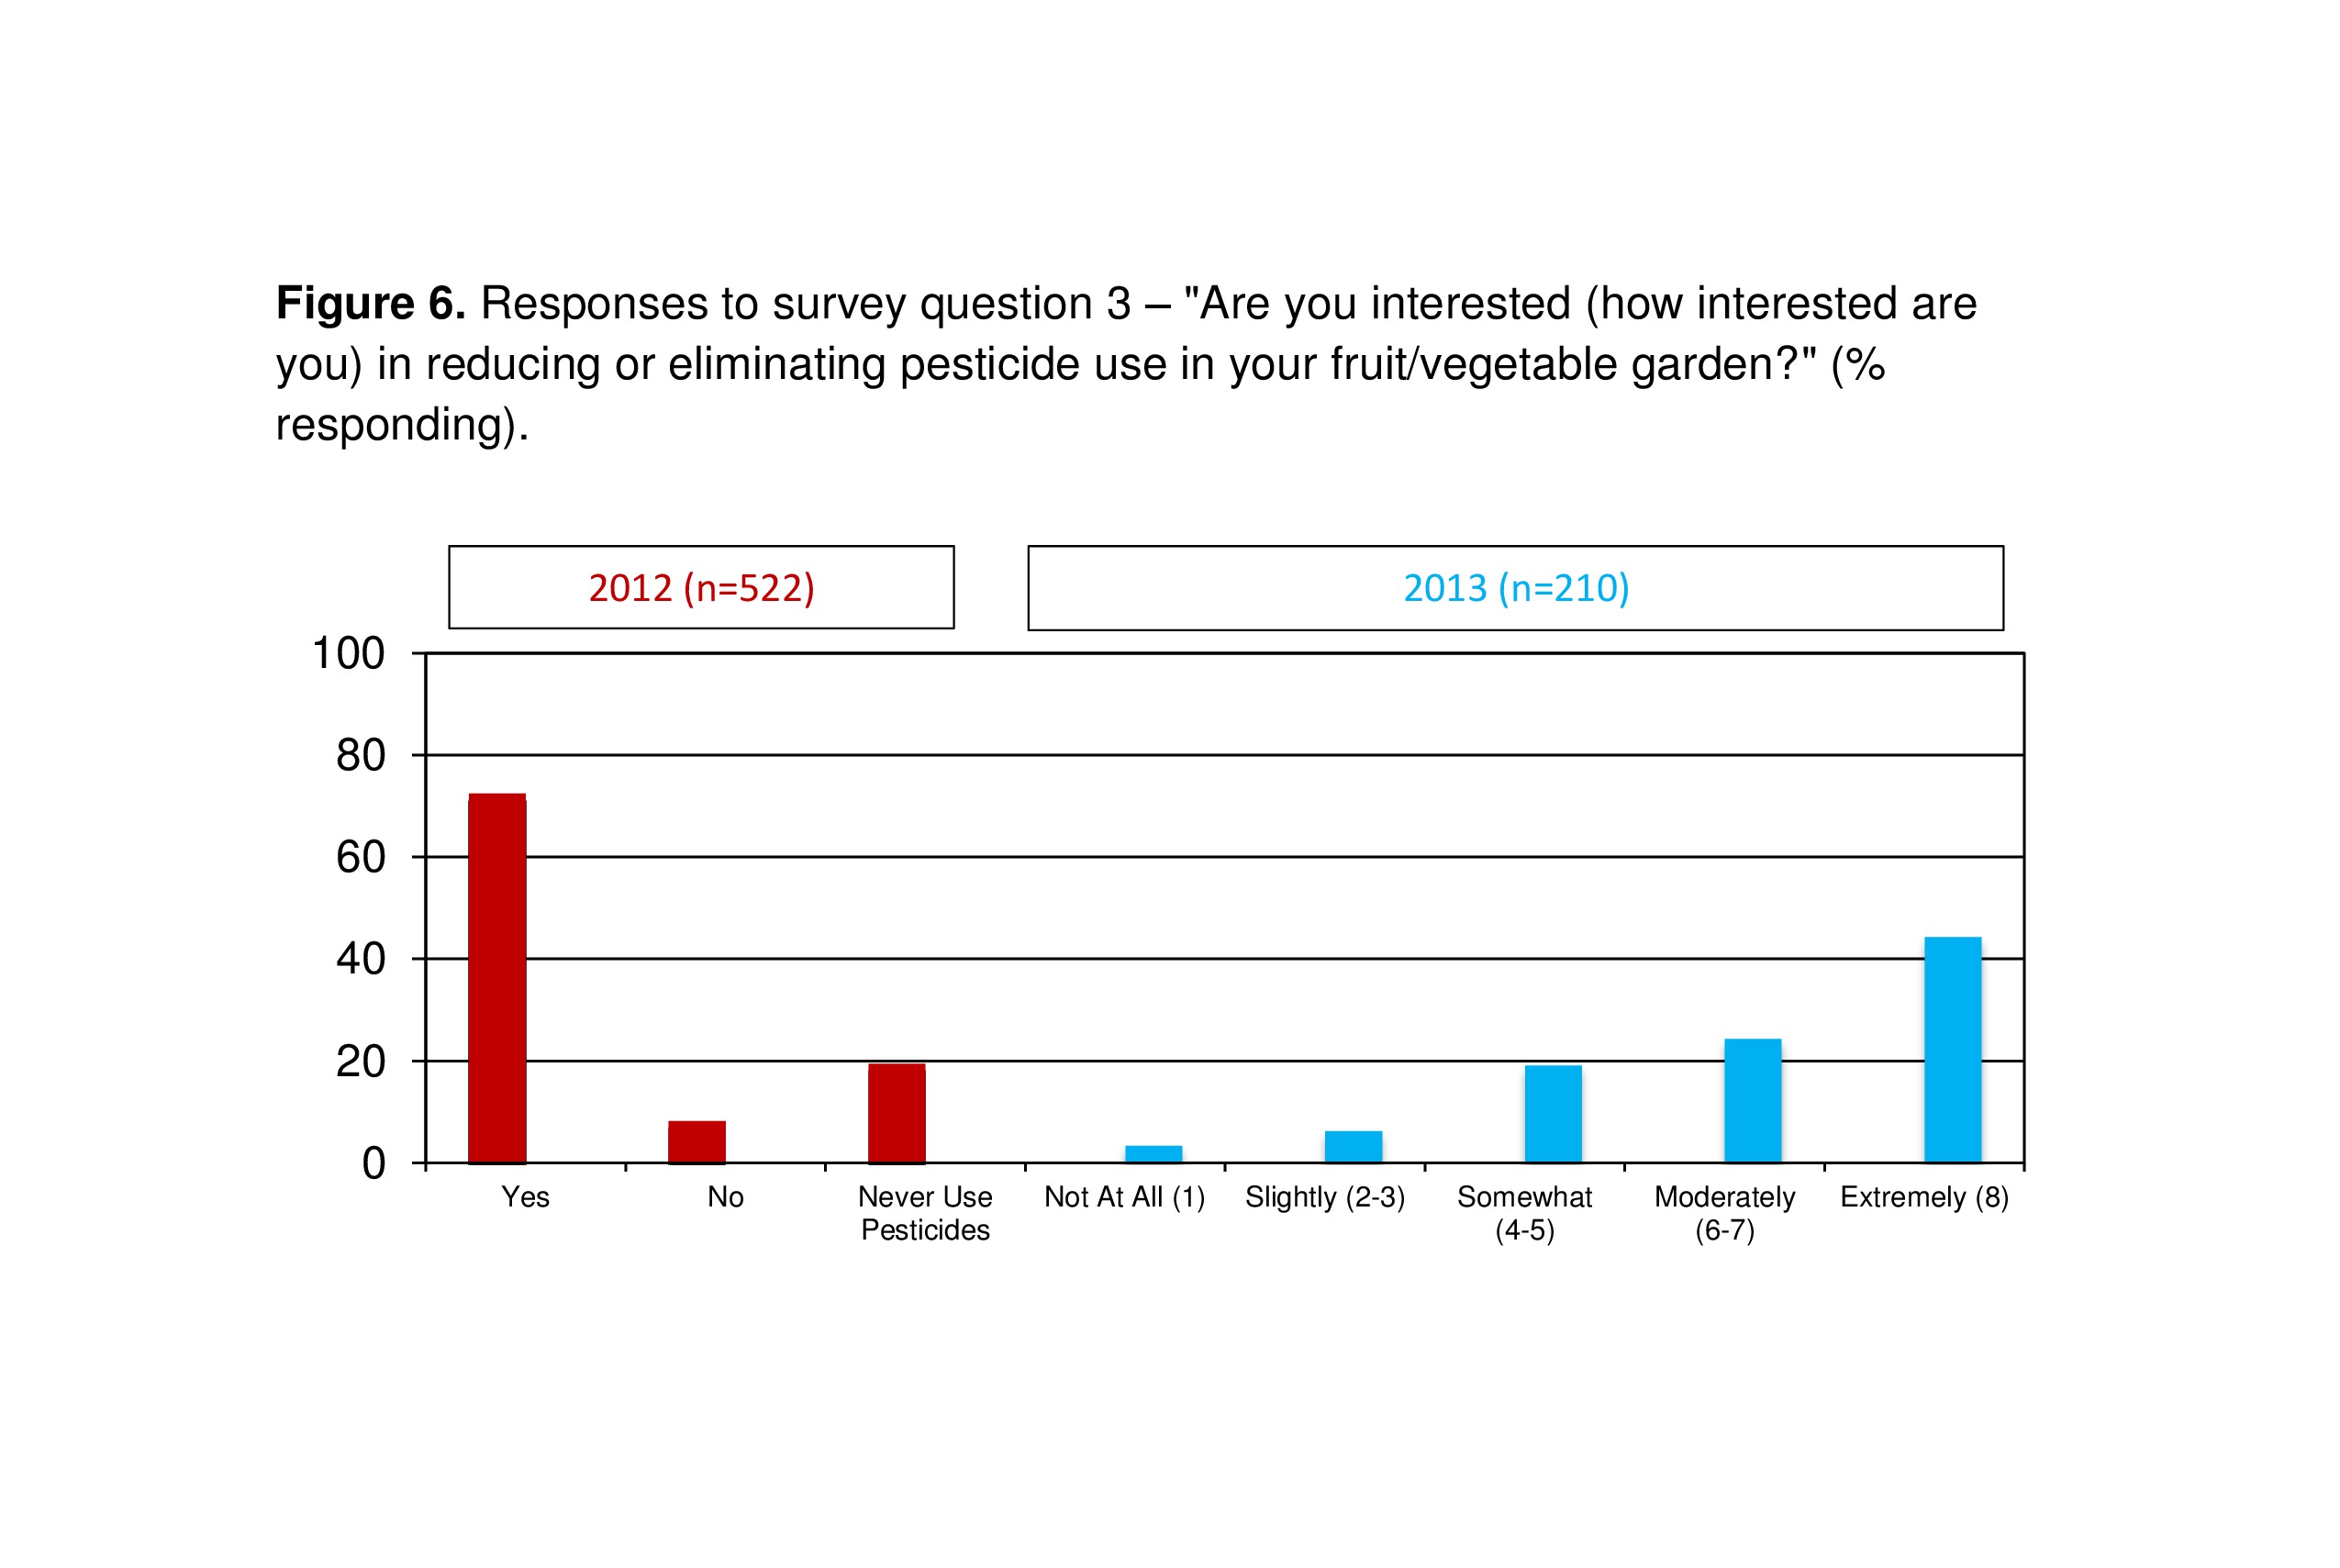
We found that, though most of our respondents used pesticides in their gardens in 2012, a large majority (over 70%) want to reduce pesticide use (Figure 6). There is an interesting discrepancy here, in that 19% of respondents said they never use pesticides in their garden, while 31% said they never used pesticides. Perhaps the addition of examples like "Roundup®" and "herbicides/insecticides" brought the never-use answer numbers up. In the authors' experiences, we have often encountered Extension clientele who indicate that they do not use pesticides, but when a specific pesticide or a different term like weed killer is mentioned, they reveal that they do use pesticides. It seems that those who answered "sometimes" (they sometimes use pesticides) are likely less serious or committed users of pesticides than those who answered "yes". This is indicated where 81% of respondents who answered "yes" that they currently use pesticides also answered "yes" that they wanted to reduce use. A higher proportion (87%) wants to reduce pesticide use if they answered "sometimes" about their pesticide.
In 2013 we found 59% of survey respondents never (28%) or rarely (31%) use pesticides and 68% were moderately (24%) or extremely (44%) interested in reducing or eliminating pesticide use. Interestingly, of the respondents who circled they were "not at all" interested in reducing pesticide use, 5 of 7 also indicated they "never use" pesticides in their fruit or vegetable garden.
Though these results strongly show most peoples' interest in reducing pesticide use in their garden, it is unclear whether they would partake of educational programs aimed at this behavior. In the past, reduced pesticide gardening education was not a primary focus of USU Extension horticulture or agriculture agents in Salt Lake County. However, these survey results will be used to make the case for offering more education on low pesticide input gardening.
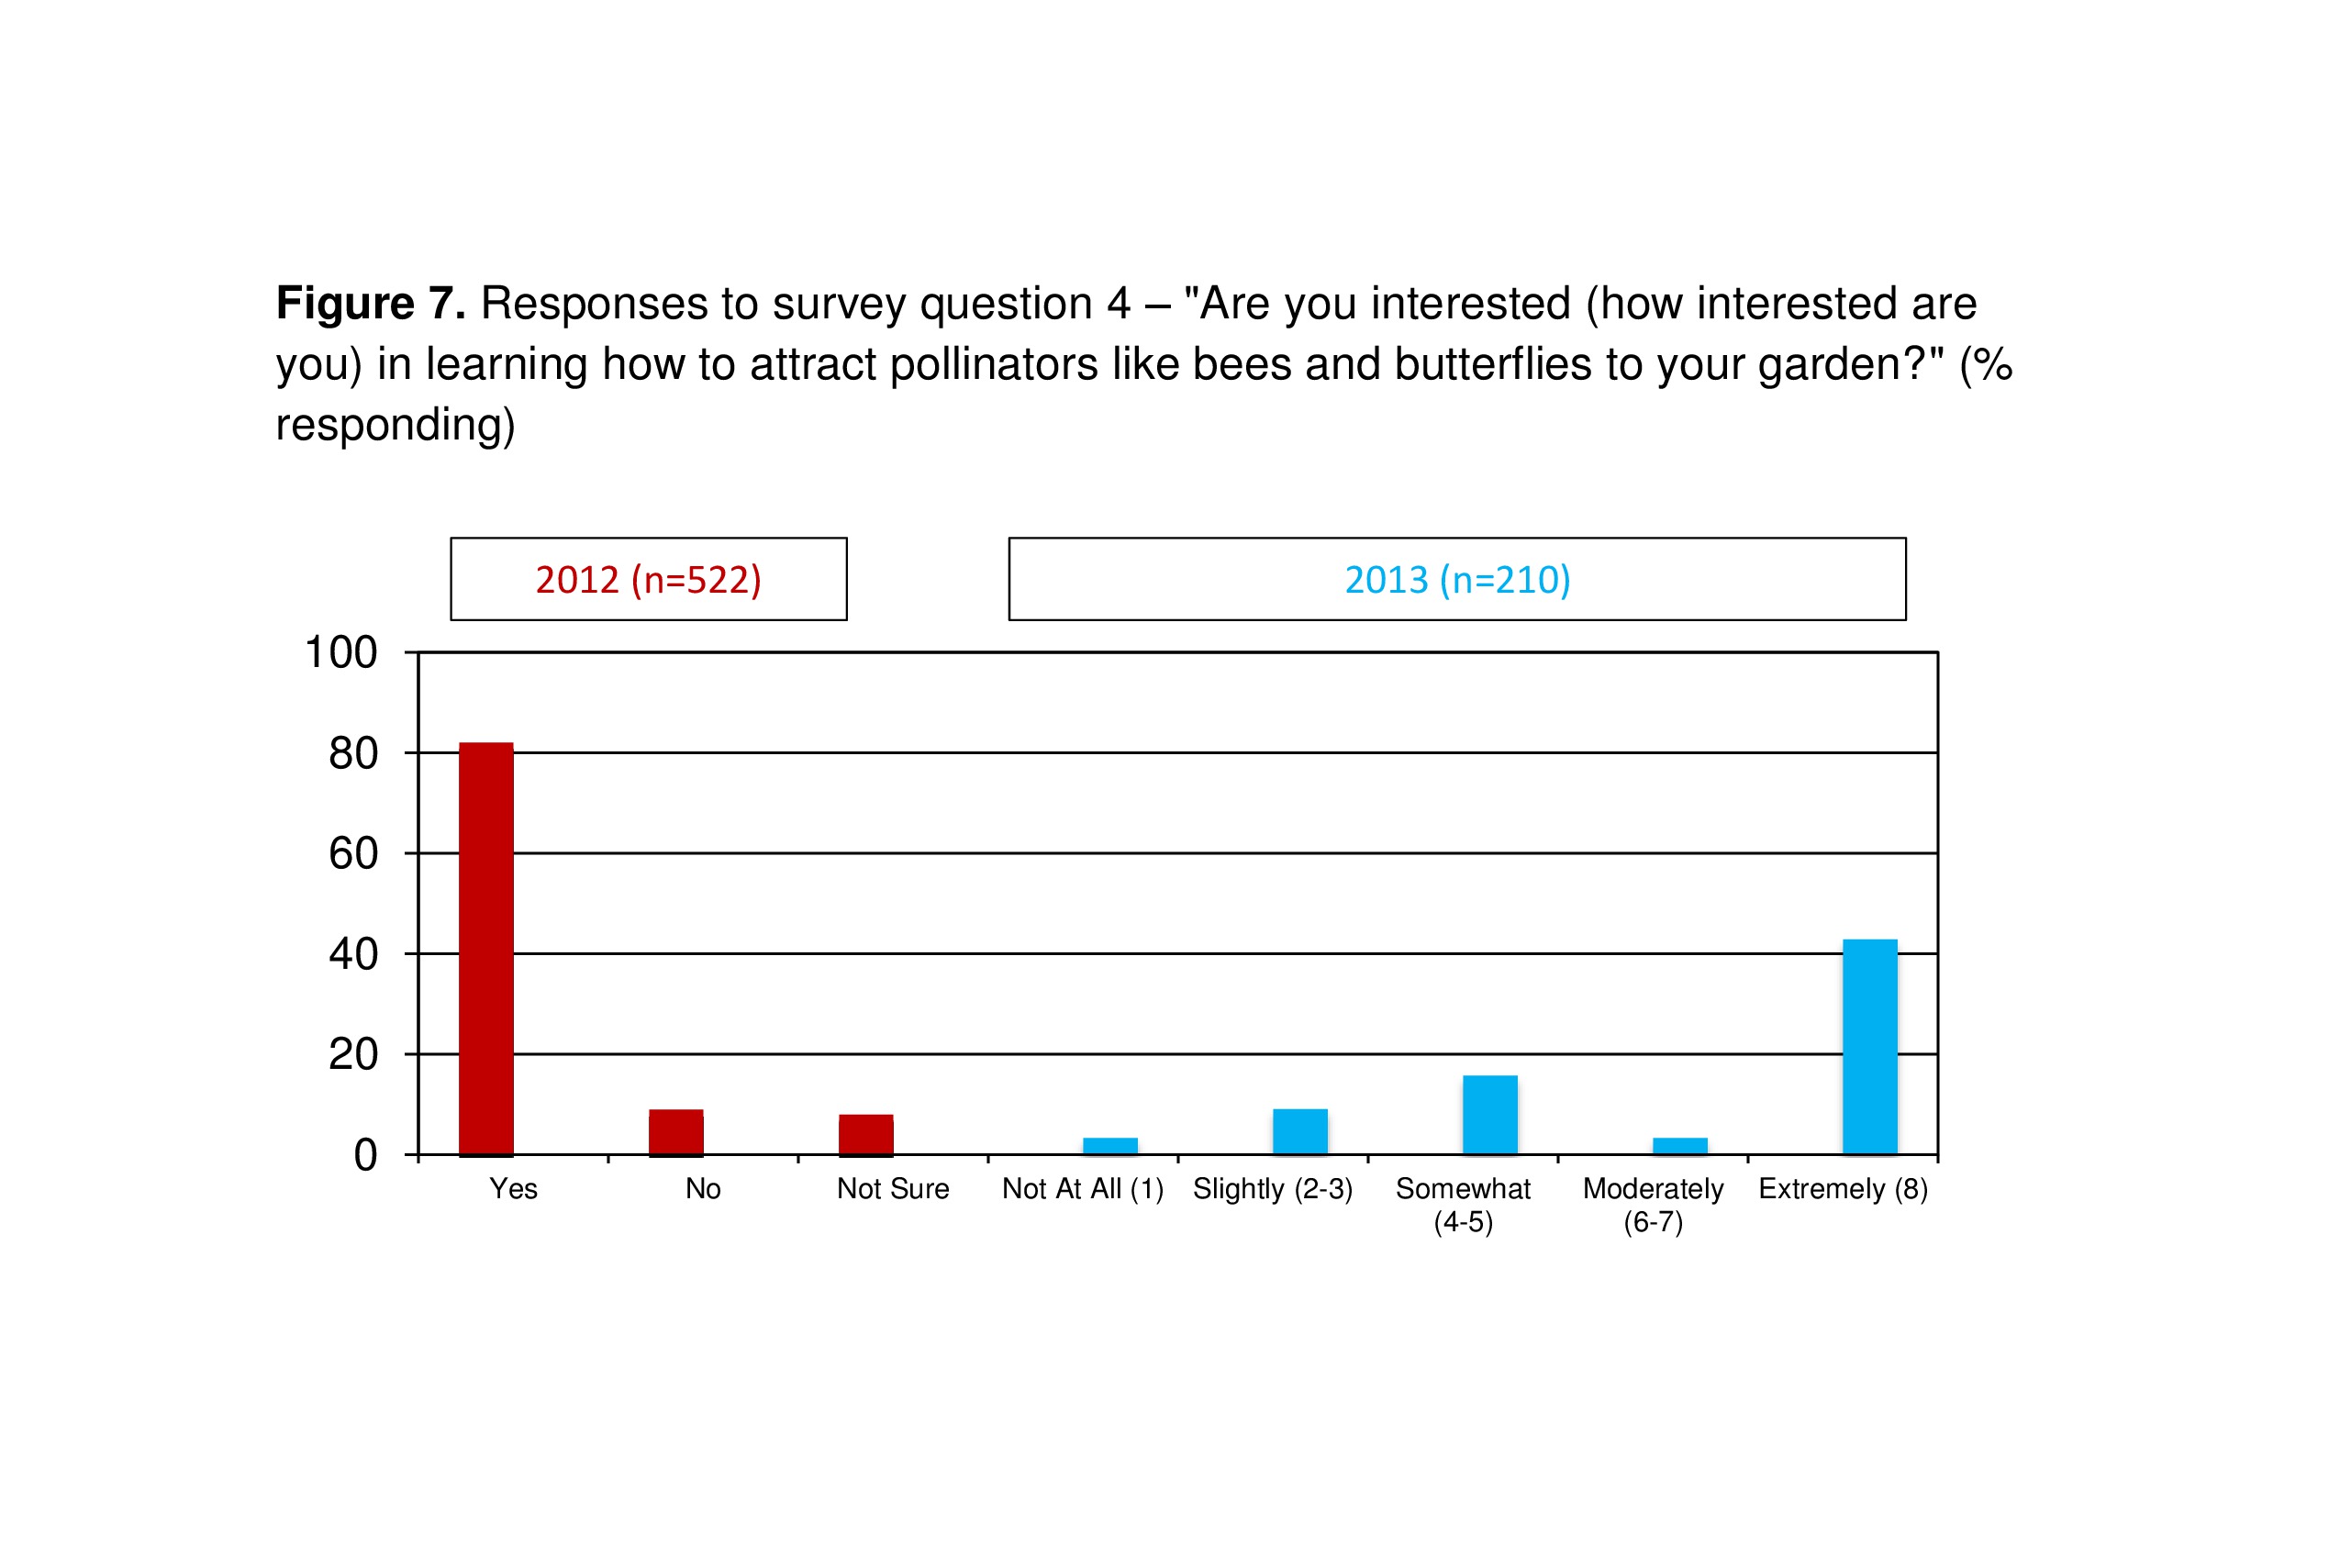
In 2012 most respondents were interested in learning how to attract pollinators to the garden (Figure 7). A few respondents indicated that they were beekeepers on their surveys, but we meant to include all pollinators including native bees, butterflies, and birds. A strong interest in pollinator education was reported in 2013 with over two-thirds of respondents indicating they were moderately (24%) or extremely (44%) interested. Interestingly, of the 2013 respondents who indicated they were only slightly to not at all interested in reducing or eliminating pesticide use (n=20), just over half (11) indicated they were moderately to extremely interested in learning how to attract pollinators. This result may show indication of the impact of wording on responses. Because the use of insecticides, primarily broad spectrum insecticides, can be harmful to pollinators, theoretically those interested in attracting pollinators would also be interested in reduced pesticide use. It is possible some respondents did not recognize the connection between insecticide use and pollinator promotion. It is also possible some respondents had bias against the wording ‘reduced pesticide use’; for example, they see nothing wrong with using pesticides, and answered they are "slightly" or "not at all" interested in reduced pesticide use but are "moderately" or "extremely" interested in learning how to attract pollinators. Therefore it might be beneficial to consider the audience before Extension educators market such programs. Pollinator education was also not a main programming area of previous USU Extension Salt Lake County horticulture or agriculture agents, but it will be expanded in the future.
In 2012, two-thirds of respondents indicated that the most popular form of access to Extension information was online factsheets, followed closely by emailing a knowledgeable gardener (Figure 8). Yep (1981) mentioned the importance of well-organized publications for Extension education in urban areas, and Woodson, Linder, and Lawver (2008) reported that in Extension, “mass delivery strategies such as newspaper, video, and fact sheets are at least as effective in educating clientele as face-to-face delivery strategies”. Classes and online videos also were popular with about half of our respondents. About a third liked the idea of calling a helpline or reading a gardening blog. Walking into the Extension office and using Facebook were preferred by few. Certainly Facebook and other social media are not heavily used by the mostly older group we contacted, though this use has increased (Pew Research Center 2010). And in a spread-out county like Salt Lake County, even though the Extension office is well situated, it is far away from where most of the population lives.
Educational preferences were very similar in 2013, with almost two thirds of respondents indicating they would use online factsheets, followed closely by emailing. Also similar to 2012, walk-in and Facebook were less popular choices. The 2013 survey also included the ‘KSL Greenhouse Hour’, a popular radio show featuring gardening information from USU Extension; 27% indicated they receive information from that program.
Out of 2,113 total gardening inquiries received by Salt Lake County Extension from January to September 2012, 73% were answered via a gardening helpline (our survey showed 32% preferred this). Walk-in clients made up 19% of the questions (same as in our survey), and almost none (0.08%) were answered via email (58% preference in our survey). These discrepancies may be due to a lack of public knowledge of the resources of the office. Based on these results, in the future the Salt Lake County Extension office plans to continue to advertise diagnostic services via business cards with the Salt Lake County Extension office location, the helpline phone number, and an email address where clientele can send gardening questions and attach photos. Salt Lake County horticulture faculty use the email address mastergardener@usu.edu to accept gardening questions via email, and this service will be emphasized more in the future. It may help if we shift Master Gardener resources to make sure that email inquiries get answered completely and quickly.
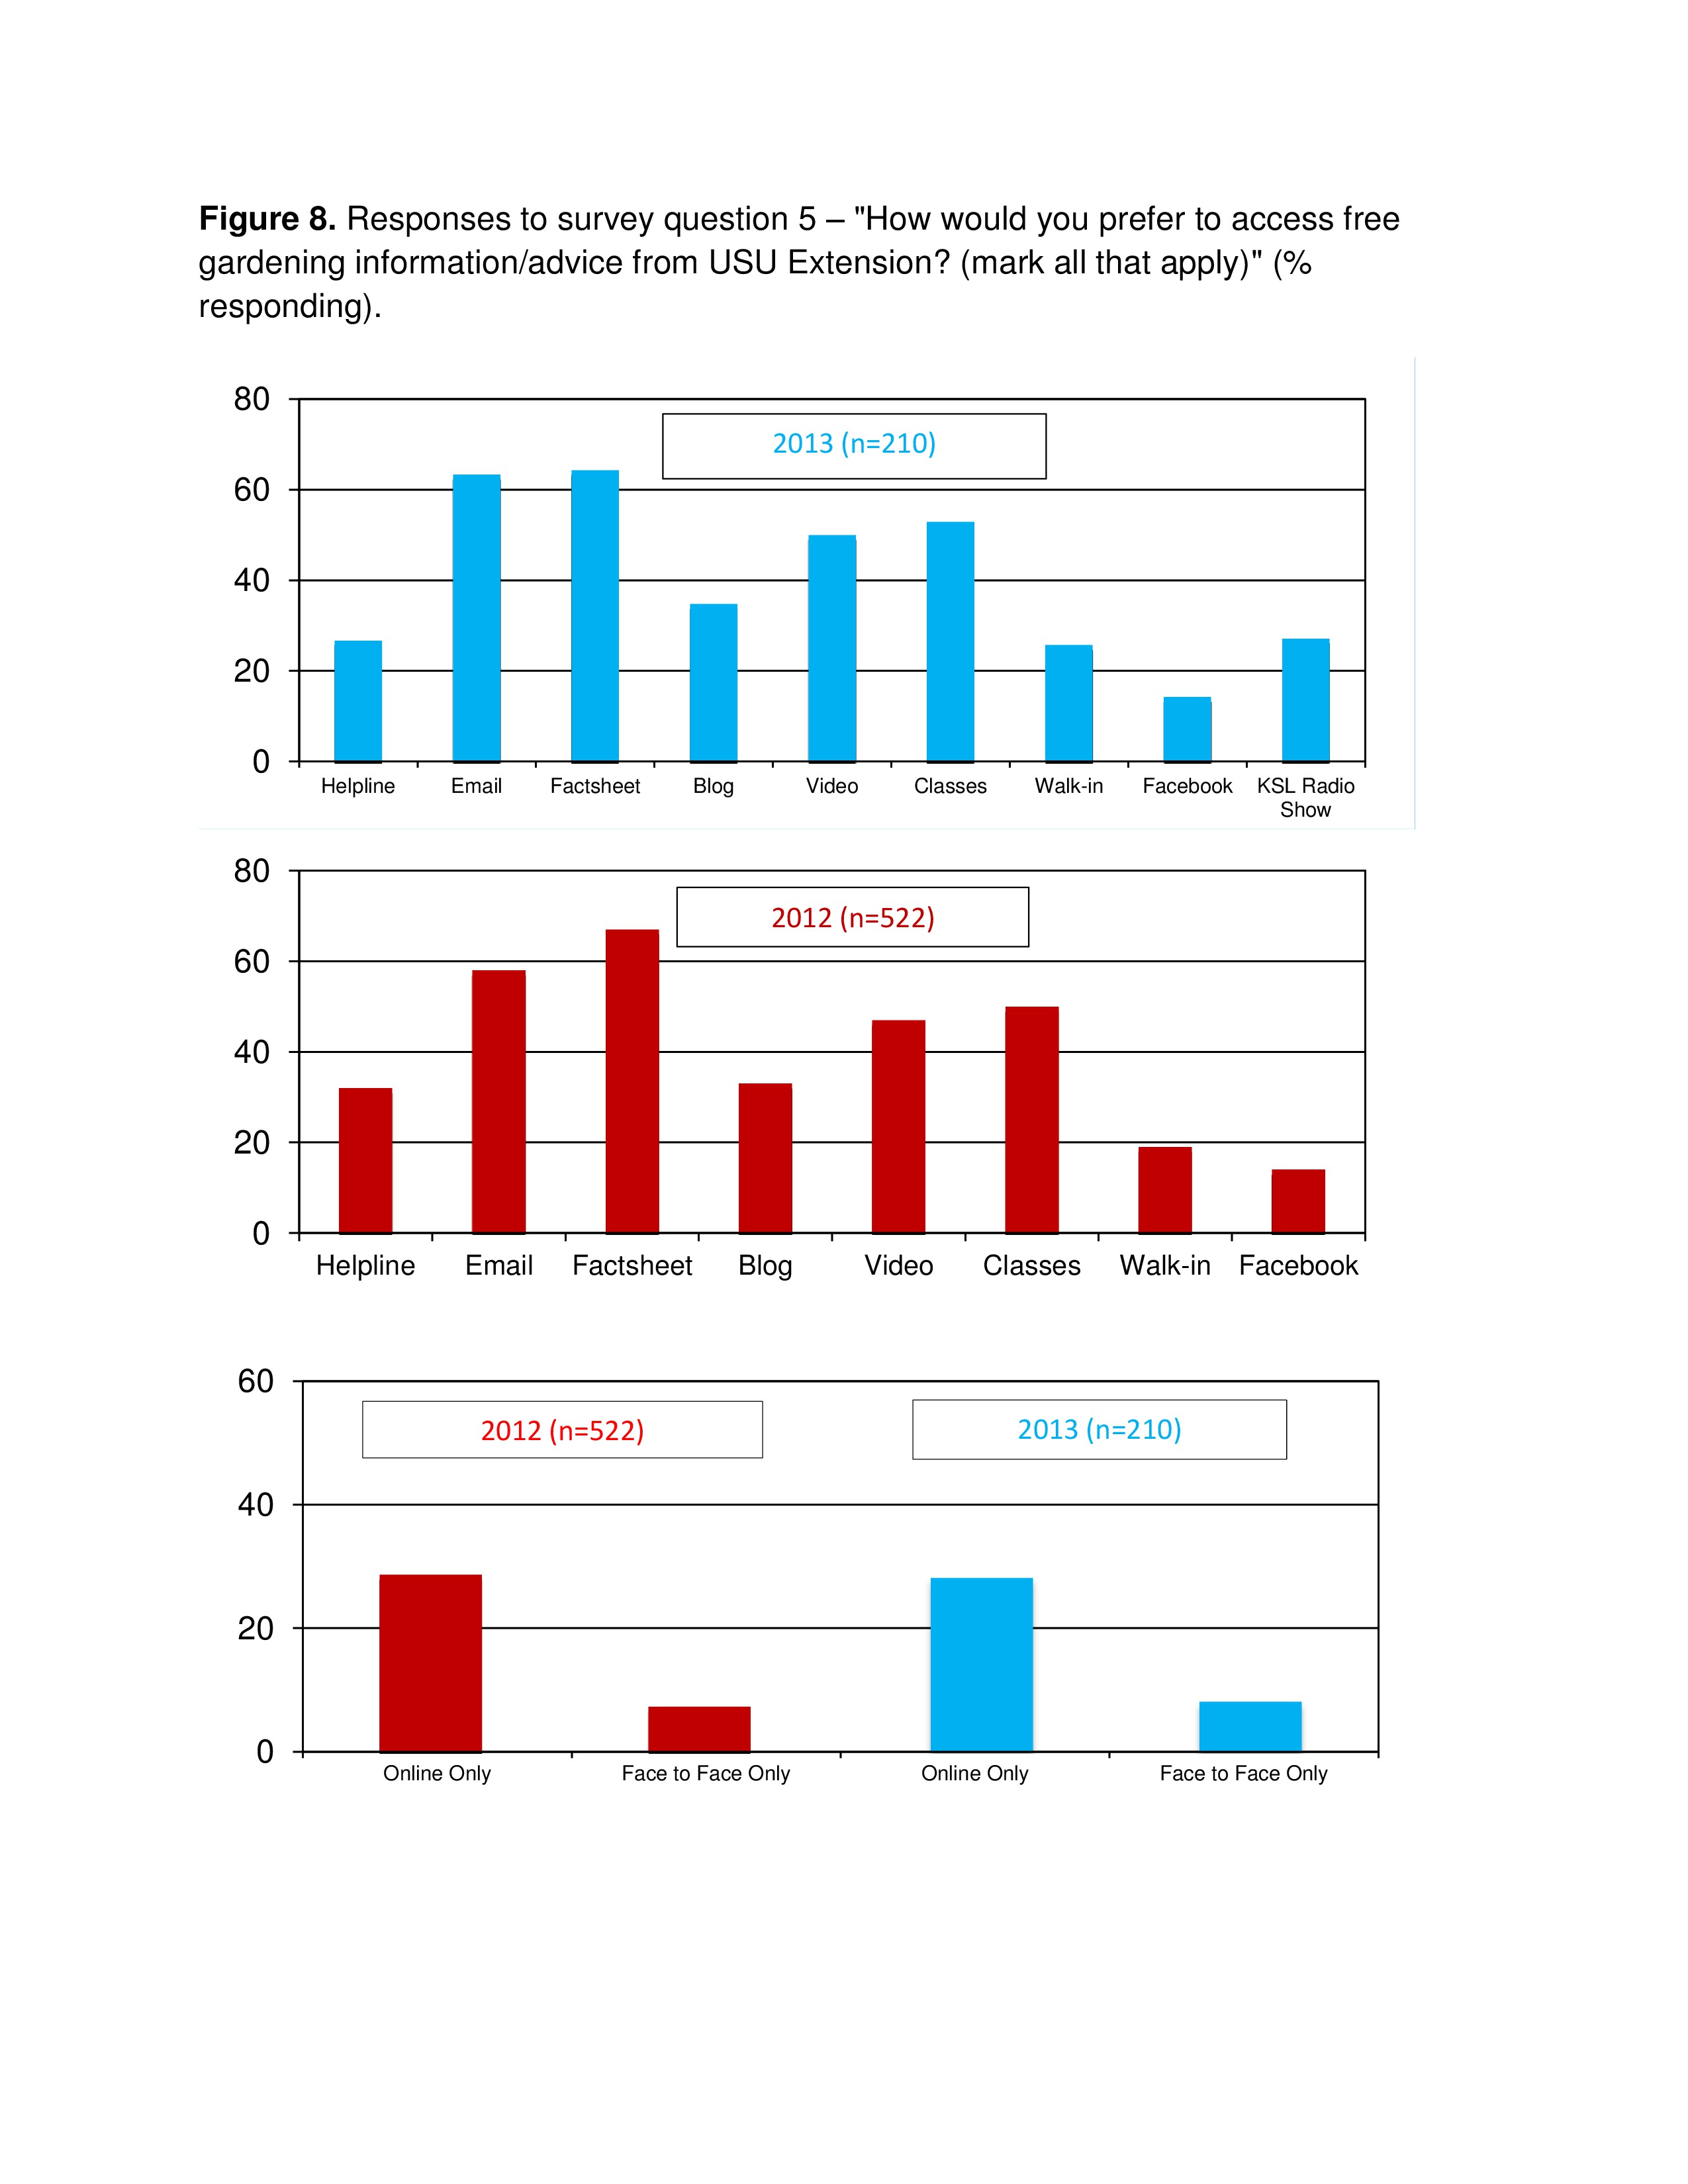
A little less than one third (29% in 2012, 28% in 2013) of respondents indicated that they prefer to access information only from online resources, while few (7% in 2012, 8% in 2013) respondents indicate that they prefer to access information only from person-to-person resources (Figure 8). It seems that people want convenience and easy-to-access information and mostly do not want to be tied to a schedule, as indicated by their preference for email, online factsheets, and online videos. This somewhat matches preferences identified by forest landowners in Utah (Salmon et al. 2006), especially the desire for easy-to-access sources. However, many are willing to give up some convenience and tie themselves to a scheduled event if they perceive a major benefit, like with classes. Certainly if Salt Lake County Extension faculty has the time and resources, they should provide information in a variety of both online and person-to-person methods. Of the respondents that liked both online and person-to-person resources (mixed responses), most preferred online resources coupled with classes (80% in 2012, 81% in 2013), followed by a helpline (42% in 2012, 35% in 2013), then followed by walking into the Extension office (28% in 2012, 35% in 2013). A small minority (9% in 2012, 1% in 2013) preferred access to information via Facebook, blogs and videos only.
Summary
In summary:
- Of the surveyed population, people attending a home and garden festival who came by an Extension booth, there was substantial interest in reduction of pesticide use in fruit and vegetable gardens and promotion of pollinators in urban settings.
- The surveyed population's top-rated ways to access information were easy-to-access factsheets, email, and classes.
- Most of the survey respondents prefer to access information from both online and person-to-person sources, although a significant proportion of respondents prefer electronic only, and a very small minority prefers person-to-person resources only.
Literature Cited
Bogen, K. (1982). The effect of questionnaire length on response rates: A review of the literature. U.S. Bureau of Census. Available at: http://www.census.gov/srd/papers/pdf/kb9601.pdf.
Church, C.S., Buhler, W.G., Bradley, L.K., & Stinner, R.E. (2012). Assessing Extension educators’ needs for homeowner pesticide use and safety information. Journal of Extension [On-line], 50(5) Article 5RIB7. Available at: http://www.joe.org/joe/2012october/rb7.php.
CSA Utah. (2012). Available at: http://csautah.org.
Edible Wasatch. Spring (2012). 2012 CSA’s. Issue No. 8:44-45. Available at: http://digitaleditions.sheridan.com/publication/?i=102949.
Etling, A. (1992). Needs assessment: A handbook. Journal of Extension [On-line], 33(1) Article 1TOT1. Available at: http://www.joe.org/joe/1995february/tt1.php.
Fehlis, C.P. (1992). Urban Extension Programs. Journal of Extension [On-line], 30(2) Article 2FEA3. Available at: http://www.joe.org/joe/1992summer/a3.php.
Healy, W. (1991). Horticulture education trends in an urban state. Journal of Extension [On-line], 29(2) Article 2RIB5. Available at: http://www.joe.org/joe/1992summer/tp3.php.
Hopwood, J., Vaughan, M., Shepherd, M., Biddinger, D., Mader, E., Hoffman Black, S., & Mazzacano, C. (2012). Are neonicotinoids killing bees? A review of research into the effects of neonicotinoid insecticides on bees with recommendations for action. The Xerces Society for Invertebrate Conservation. Available at: http://www.xerces.org/wp-content/uploads/2012/03/Are-Neonicotinoids-Killing-Bees_Xerces-Society1.pdf.
Kuhns, M.R., & Reiter, D.K. (2009). Tree care and topping beliefs, knowledge, and practices in six western U.S. cities. Arboriculture & Urban Forestry 35(3):122-128.
Lamm, D. (1992). Face urban needs through issues-based programming. Journal of Extension [On-line], 30(2) Article 2TP3. Available at: http://www.joe.org/joe/1992summer/tp3.php.
Pew Research Center. (2010). Computer and cell phone usage up around the World: Global publics embrace social networking. News release dated 12/15/10. Accessed by author on 12/18/12 at: http://pewglobal.org/files/2010/12/Pew-Global-Attitudes-Technology-Report-FINAL-December-15-2010.pdf.
Salmon, O.L., M.W. Brunson, & Kuhns, M.R. (2006). Benefit-Based Audience Segmentation: A Tool for Identifying Nonindustrial Private Forest (NIPF) Owner Education Needs. Journal of Forestry, 104(8): 419-425.
Salt Lake County Urban Farming Initiative. (2012). Available at: http://www.urbanfarming.slco.org/.
U.S. Census Quickfacts Data for Salt Lake County, Utah. (2010). Available at: http://quickfacts.census.gov/qfd/states/49/49035.html.
U.S. Department of Agriculture – Utah Natural Resource Conservation Service. (2012). Salt Lake County resource assessment. Available at: http://www.ut.nrcs.usda.gov/technical/nri/RA-saltlake.html.
U.S. Environmental Protection Agency. (1992). National home and garden pesticide use survey. No. RTI/5100/17-01f. U.S. Environmental Protection Agency.
U.S. Geological Survey, (1999). The quality of our nation’s waters: nutrients and pesticides. U.S. Geological Survey Circular 1225. Available at: http://pubs.usgs.gov/circ/circ1225/.
Wasatch Community Gardens. (2012). Available at: http://wasatchgardens.org.
Woodson, D.M., Lindner, J.R., & Lawver, D.E. (2008). Urban Extension clientele competencies by mass media delivery. Journal of Extension [On-line], 46(2) Article 2RIB6. Available at: http://www.joe.org/joe/2008april/rb6.php.
Yep, B.H. (1981). Expanding urban programming. Journal of Extension [On-line], 19(3). Available at: http://www.joe.org/joe/1981may/81-3-a4.pdf.
