Journal of the NACAA
ISSN 2158-9429
Volume 6, Issue 1 - May, 2013
Maryland Nutrient Management Training: Impacts Assessment
- Dill, S.P., Extension Educator, University of Maryland Extension
Lazur, A., AGNR Program Leader, University of Maryland Extension
McCoy, T., Evaluation Specialist, University of Maryland Extension
Rhodes, J.L., Extension Educator, University of Maryland Extension
ABSTRACT
For more than 10 years, the University of Maryland Extension (UME) has conducted nutrient management educational programs to bring university research to Maryland farmers and landowners as well as to assist them in complying with State of Maryland regulations through workshops, recertification classes and publications. Goals of the Agricultural Nutrient Management Program (ANMP) include increasing farm productivity, minimizing environmental impacts and meeting regulatory requirements. To evaluate impacts of the ANMP training a long-term evaluation was conducted revealing increases in education, environmental stewardship and farm profitability. Participants reported training impacting their farm business as follows: 74% better manage nutrients, 67% keep better nutrient application records, 40% better estimate and apply manure, 45% maintain or improve condition of soil, and 86% met regulatory requirements. In addition, respondents estimated the training increased their profit by $7.49 per acre.
Introduction
The University of Maryland Extension (UME) Agriculture Nutrient Management Program (ANMP) is a program with stringent guidelines from the State of Maryland Water Quality Improvement Act. There are many program components that UME delivers. The nutrient management voucher is one of these. It is a unique program in that every county educator in Maryland plans and/or instructs an annual training. UME Specialists provide materials and educational tools to educators in order for them to deliver local training. This includes updates on new regulations and topics for instruction. Winter training classes are then planned and conducted which provides credits and recertification to nutrient applicators.
Short-term program evaluations have been conducted by Extension Educators through end-of-class evaluations to assess increased knowledge and skills acquisition. However, there had not been a statewide program evaluation of the medium to long term outcomes of this program. In 2012, UME Agriculture and Natural Resources (AGNR) program team identified the need to focus on the statewide impact of the ANMP voucher program. Therefore, a statewide evaluation survey was collaboratively developed to focus on determining the extent to which producers implement nutrient education knowledge on the farm and whether their operations were more profitable because of the knowledge gained in the program. The AGNR program team provided funds to conduct the paper-based, mail survey.
Maryland Nutrient Management Program
In 1998 the State of Maryland passed the Water Quality Improvement Act. Since then Maryland nutrient management applicators are required to follow application, reporting and training guidelines. This includes commercial fertilizers, manures, compost and other nutrient materials. UME has had a major role in creating crop recommendations as well as education and outreach to the agricultural community. Maryland Department of Agriculture (MDA) is the regulatory agency that enforces the statewide Nutrient Management Law. Nutrient Management Vouchers are part of this law and are one of the areas in which county Educators connect directly with nutrient applicators. The State of Maryland requires any individual that applies nutrients to more than 10 acres of land must have a Nutrient Voucher (Maryland Department of Agriculture, 2010). This is in accordance to the 1998 Water Quality Improvement Act and Maryland law. There are 4,854 Nutrient Vouchers according to MDA.Vouchers are valid for three years and to renew the individual must attend a two hour recertification training. UME provides recertification training for each county as well as credits available at regional production meetings.
Methods
The purpose of this evaluation study was to determine the impacts of UME ANMP Nutrient Voucher Trainings in the areas of regulatory compliance, nutrient use and increased farm profits. The method used to collect data was a survey questionnaire containing 26 questions. Individual responses were confidential and the research was approved by the University of Maryland Institutional Review Board.
To ensure the best response rate, adequate coverage, and minimal error and nonresponse, Dillman’s (Dillman, Smyth, & Christianson, 2009) Tailored Design Method (TMD) was used. Dillman’s TDM is based on social-exchange theory in that respondents will determine that the benefits of providing the information outweigh the costs of time and effort to provide the information. This method relies on such factors as multiple contacts, giving respondents information and respect, being appreciative of their help, making the survey interesting and easy to use and providing some type of incentive.
The survey questions were developed using a team approach to elicit subject-matter, organizational, and evaluation expertise. This approach helped to ensure face validity asking the question, does the instrument and measures make sense as presented to get at the construct (Remler & Van Ryzin, 2011). The team included two county-based faculty members, the UME Assistant Director for Agriculture and Natural Resources, and the UME Evaluation Specialist. The survey was pilot tested for understanding by three individual private applicators. These applicators were excluded from the sampling pool.
Farmers in Maryland comply with the nutrient management law as well as pesticide regulations. Most often certifications in both areas are obtained and kept current. When planning this survey it was felt that both programs could be successfully evaluated through one survey saving additional time and expense. The researchers determined that the survey should be paper-based because email addresses were not available. The decision was made to draw a random scientific sample and focus efforts on obtaining a high response rate. The names and addresses of pesticide private applicators were contained in an Excel database with each person identified as the row number in the spreadsheet and the names entered into particular pattern in the spreadsheet. With a 5% margin of error and a confidence level of 95%, the recommended minimum sample size is 345. Therefore, a random sample of 500 applicators was drawn by generating numbers through a randomizing selector in Microsoft Excel. Once the numbers were generated, those respondents with the same row number in Excel were drawn.
The survey was conducted by mail in the fall of 2011 with a plan for multiple contacts as recommended by Dillman, Smyth, and Christianson (2009). A pre-notification letter was sent to those chosen for the survey explaining the purpose of the research and emphasizing the confidentiality and importance of the information that would be collected. One week later, an instruction letter and the survey were sent along with a self-addressed return envelope. One week after the survey was sent, the first reminder postcard was mailed and one week later (two weeks after the survey was initially sent), and the second reminder was mailed via a postcard. In total, four contacts were made with the potential respondents. In addition, an incentive was included. Participants who completed the survey were asked to return a post card with their name, address, and email that would be entered into a drawing for a basket filled with pesticide safety materials worth $100. The materials were donated by local merchants with no expectation for access to the data.
The survey questions included demographic, farm and commodity information, as well as pesticide implementation, nutrient management and farm profitability questions specific to Maryland. However, the researchers believe that the survey could be used as a model for other states.
Results and Discussion
The survey response rate was 42%. For a paper-based survey, the response rate somewhat exceeded the researchers’ expectations and confirms Dillman, Smyth, and Christian’s (2009) experiences. According to these experts, “when the questions and questionnaires are well designed … and solid implementation procedures are used, we see response rates of 50% to 70% time and time again” (Dillman, 2009, p. 236). A response rate of 42% indicates that the questionnaire itself and the implementation process were well constructed. Respondents were asked about their licensing for Pesticide Private Applicator (99%), Nutrient Management Voucher (60%) and both (59%).
Demographics
Twenty two of the 23 Maryland counties were represented in this survey. For the number of acres farmed, the mode (37%) was 101-500 acres. Forty-three percent reported farming fewer than 101 acres, and 20% farmed more than 501 acres with 5% of these farming over 2,000 acres. Most of the respondents were full time (67%) farmers growing field crops (75%). Other commodities included livestock, fruit and/or vegetable and nursery. Most respondents were male (89%), white (98%) and between the ages of 50-64 (37%) which is consistent with USDA statistics. Respondents reported length of nutrient voucher with the majority greater than 7 years (77%).
Knowledge Gained and Implementation of Practices
Nutrient applicators reported implementing information learned in ANMP for: : determining crop nutrient needs (81%), the amount of nutrients to apply to a crop (94%), best time to apply nutrients (50%), estimating manure generated on the farm (33%), estimating manure application on the farm (39%). Surveyed participants reported overall as a result of training received that 81% have better managed nutrients on the farm and 70% have reduced nutrients on the farm.
In estimating the impacts of training on their farm business, participants responded as follows: 74% better manage nutrients, 67% keep better nutrient application records, 40% better estimate and apply manure, 45% maintain or improve condition of soil, and 86% met regulatory requirements (Figure 1).
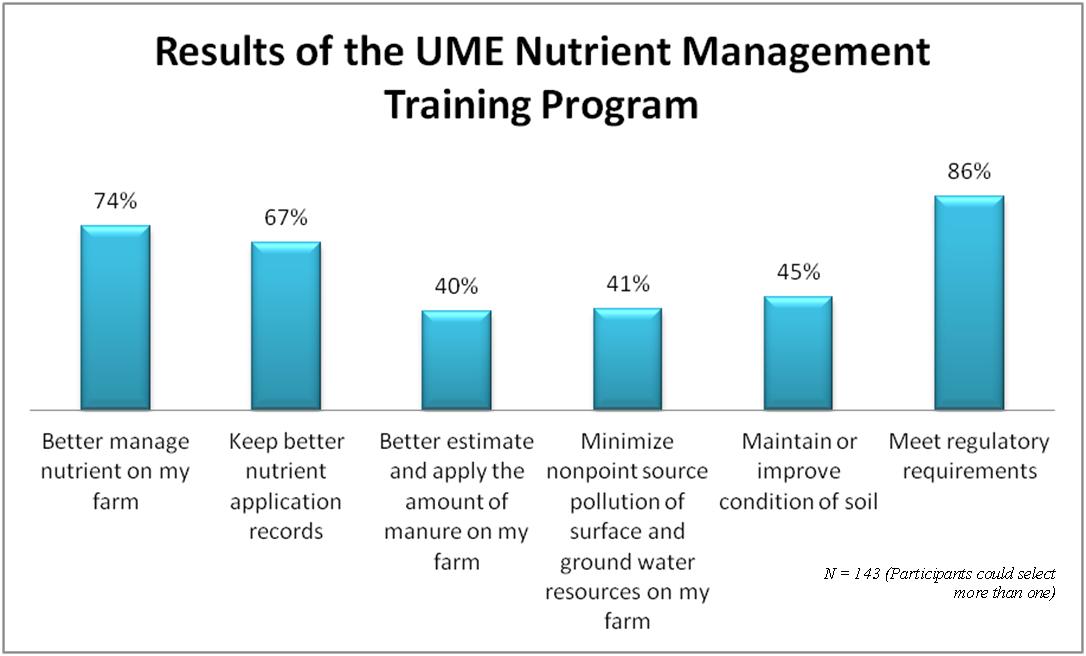
Figure 1. Outcomes of the Nutrient Management Training Program.
A significant result of this survey includes participants’ response to implementing nutrient management practices. Voucher training is mandatory for those applying nutrients, and a high rate of regulatory compliance (86%) as a result of the training would be expected. However, 74% of respondents also reported positive impacts on managing nutrients on the farm and better nutrient application records (Figure 1.). These percentages suggest that farmers understand the benefits of implementing nutrient management practices on the farm have applied knowledge gained and validate the need for continued education on nutrient management.
Farm profitability
Survey participants were asked questions regarding an increase in profitability due to education received through UME ANMP. Of these 143 participants, 90 responded they were not sure of the economic benefit of the training. From the 53 participants who did note an increase in profit, the range was $1.00 to over $11.00 per acre, and a mean of $7.49 per acre (see Figure 2., Table1.). Respondents were provided a range of dollars per acre to choose from. Based on data reported for average acres farmed (421.09 acres), the total dollar impact per participant of the ANMP represents a $3,153.96 (421.09 ac x $7.49) increase in profits. Total statewide dollar impact of surveyed participants translates to a total of $652,865.85 (87,165 ac x $7.49) increase in profits.
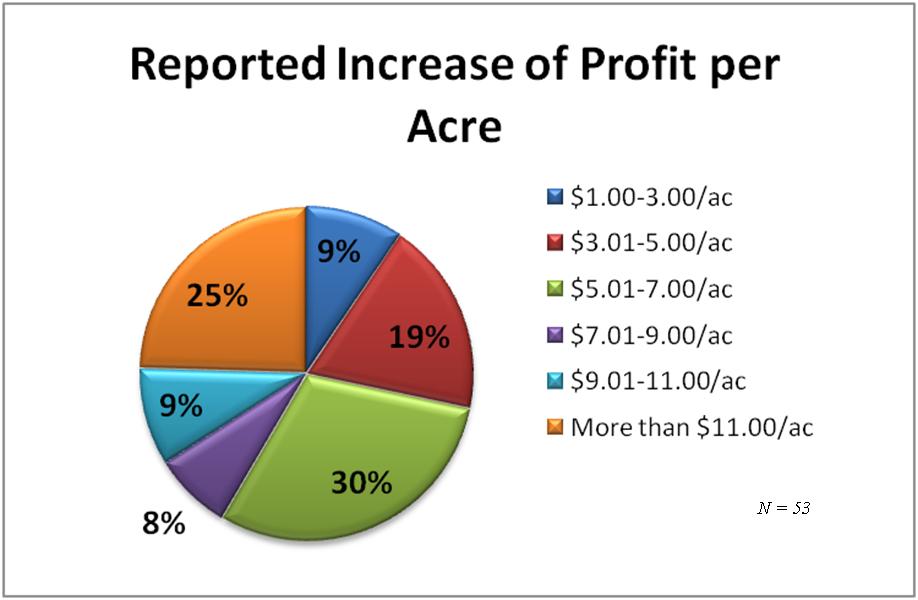
Figure 2. Profits reported as a result of implementing recommendations form nutrient management training
|
Nutrient Management Training Reported Increase Profit per Acre |
|||
|
Low |
Medium |
High |
|
|
MEAN |
$ 6.25 |
$ 7.49 |
$ 8.74 |
|
MEDIAN |
$ 5.01 |
$ 6.00 |
$ 7.00 |
|
SD |
3.4034 |
3.7602 |
4.0939 |
|
Average Acres Farmed per Respondent |
|||
|
|
Low |
Medium |
High |
|
MEAN |
255.88 |
421.09 |
625.27 |
|
MEDIAN |
101 |
250 |
500 |
|
SD |
469.5314 |
692.5519 |
910.0092 |
Table 1. Profit per acre and average acres farmed for ranges reported.
Results were further analyzed to determine any statistical correlations for nutrient applicators reporting increased profits. A regression using SAS 9.2was conducted with profit as the dependent variable and demographics as the independent variables. Using R-square statistics, no correlation was found with gender (.0025), full/part-time (..004), crops grown (.002), years of certification (..009), education (.0008), race (.010), size of farm (.0009) or age of the applicator (.0009). These results suggest that farm profitability is not dependent on demographic factors, and that all sectors of the population instructed have profited equally.
Conclusion
The follow-up impact based evaluation for the UME ANMP has been a beneficial investigation for educators, specialist and administrators of UME. As a result of locally-delivered nutrient management education programs, UME has improved management of nutrients, increased farm profitability, and assisted in meeting regulatory requirements. Respondents report as a direct result of training 74% better manage nutrients, 67% keep better nutrient application records, 40% better estimate and apply manure, 45% maintain or improve condition of soil, and 86% met regulatory requirements. Additionally respondents overall felt they were better able to manage nutrients on their farm (81%) and reduce nutrients on the farm (70%). Participants also estimated increasing farm profitability by an average of $7.49 per acre.
This investigation provides evidence that UME ANMP delivers both quantitative and qualitative public value. The results are currently being communicated to stakeholders and administrators about the significance and impact of this important program which supports the agricultural industries in Maryland. Data is also being used by the impact team and Extension Educators in reporting programmatic impacts and outcomes. Furthermore, the methods employed in this evaluation effort serves as a model for other UME program impact evaluations.
Acknowledgments
We offer a special thank you to Maryland Nutrient Applicator respondents and to our nutrient education team that has delivered timely and relevant information to agricultural producers for the past 15years. Funding for this study was provided by the University of Maryland Extension Agriculture and Natural Resources Impact Team.
References:
Dillman, D. A., Smyth, J. D., & Christian, L. M. (2009). Internet, mail, and mixed mode surveys: The tailored design method (3rd ed.). Hoboken, NJ: John Wiley and Sons, Inc.
Maryland Department of Agriculture (2010). About Maryland’s Nutrient Management Program. Available from http://mda.maryland.gov/resource_conservation/Pages/nutrient_management.aspx.
Remler, D.K., & Van Ryzin, G. G. (2011). Research methods in practice: Strategies for description and causation. Thousand Oaks, CA: Sage.