Journal of the NACAA
ISSN 2158-9429
Volume 6, Issue 2 - December, 2013
A Farmer Survey of Phosphorus Issues
- Hoorman, J.J., Assistant Professor & Extension Educator, Putnam County, Ohio State University Extension
Willaim B. Clevenger, Assistant Professor & Extension Educator, Defiance County, Ohio State University Extension
Curtis E. Young, Assistant Professor & Extension Educator, Van Wert County, Ohio State University Extension
Steven P. Prochaska, Associate Professor & Extension Area Specialist, Ohio State University Extension
Jefferson S. McCutcheon, Associate Professor & Extension Educator, Morrow County, Ohio State University Extension
ABSTRACT
Farmers (N=133) were electronically surveyed at the Conservation Tillage Conference, Ada, Ohio (March 2013) about phosphorus (P) management practices, knowledge, and attitudes. As farm size increases (Chi Square, p<0.0273), farmers use more intensive soil sampling including grid soil sampling (50%, N=65) on 2.5 acre parcels and zone sampling by soil type (21.5%, N=28). The majority of farmers (72.6%, N=93) agreed that P runoff is an issue in Ohio. Farmer attitudes had 17.8% (N=22) agreeing that Tri-State Fertilizer recommendations limit crop yields. Farmer P knowledge for Bray P1 was fairly low with only 12.3% (N=14) knowing when to stop applying P fertilizer. Farmers reported applying P mostly in the spring (47.2%, N=59) or fall (41.6%, N=52). Farmers (32.0%, N=41) reported broadcasting P with no incorporation.
Introduction
Hazardous Algae Blooms (HAB), caused by a form of a bacteria; cyanobacteria have the ability to produce toxins that can be quite harmful to people, fish and animals. These toxins can be neurotoxins, heptatoxins, endocrine toxins or tumor promoters. HAB outbreaks have been associated with phosphorus loading of water (Ohio Phosphorus Task Force, 2010). Many studies have been conducted that link agricultural field phosphorus losses to the increase in phosphorus (P) loading of Ohio water resources (Sharpley, 2001; Clevenger and Allred, 2011; Hoorman, 2008). The Ohio regulatory agencies, Ohio Department of Agriculture (ODA), Ohio Environmental Protection Agency (OEPA) and Ohio Department of Natural Resources (ODNR) have put forth a plan that focuses on mitigating agricultural field/tile losses of phosphorus (LaBarge, 2011).
The majority of agricultural land (60 to 80 percent) in the Upper Mississippi River watershed needs more conservation and nutrient management to decrease agricultural P field losses (U.S. Department of Agriculture's Conservation Effects Assessment Project, July 2012). Phosphorus runoff has become a major issue in Ohio in Lake Erie and Grand Lake St. Marys, leading to eutrophication and toxic algae blooms (Ohio Lake Erie Task Force Final Report, 2013). This is similar to issues faced in the Chesapeake Bay (Chesapeake Bay Program website). This article will focus on farmer knowledge, attitude and management practices associated with P fertilizer and management.
Audience response technology uses electronic transmitters to record information from survey questions posed by presenters (Gustafson and Crane, 2005; Massey et al. 2005). These devices increase participation and poll clientele in the program (Gustafson and Crane, 2005). The electronic transmitters allow numeric responses to survey questions and are generally easy for meeting participants to utilize. Each transmitter has an individual code and response(s) are recorded to a computer. Data from these responses then can be downloaded into various formats and analyzed (Gustafson and Crane, 2005).
Purpose and Objectives
The purpose of this project was to describe farmer attitudes, knowledge, and field management practices related to P issues and concerns. The results of this study will be useful to Extension educators on focusing educational resources to better serve farmers about reducing P runoff to surface water.
The survey objectives were as follows:
1. Perform an assessment of farmer methods of P soil testing.
2. Perform an assessment of farmers’ level of knowledge on when to apply P fertilizer based on critical phosphorus Bray P1 soil test values as established in the Tri-State Fertility Recommendations (Ohio State, Purdue and Michigan State).
3. Collect information on time of year when farmers apply P fertilizer and on the application method by which farmers apply P fertilizer.
4. Measure the attitude of farmers on the significance of P runoff in Ohio surface water.
5. Measure the attitude of farmers about the Tri-State Fertility recommendations for P.
Methods
A valid electronic survey was utilized to gather data from farm clientele attending the 2013 Conservation Tillage Conference (CTC). Ohio State University Institutional Review Board approval was obtained for this work. The Conservation Tillage Conference is a two day conference for farmers, consultants, and agency personnel to learn about new farming methods to increase crop yields and to protect the environment (Hoorman et al., 2010). The target population of this study consisted of Tri-State farmers (Indiana, Michigan, and Ohio) who primarily grow corn, soybeans, and wheat. Farmers who attend this conference tend to be full-time farmers, repeat attendees, committed to gaining knowledge about conservation practices and new technology, and committed to soil conservation. Agribusiness, agency personnel, and consultant responses were tabulated and reported separately.
Audience response technology was used to conduct an electronic survey on March 5, 2013 at the Conservation Tillage Conference at Ohio Northern University, Ada, Ohio. The electronic survey was used to measure P attitude, knowledge, and fertilizer management practices of farmers. The 4 Rs nutrient stewardship program (right source, rate, time, placement) served as the basis for this farmer survey (4 Rs nutrient stewardship website).
Approximately 500 audience response technology electronic recorders were randomly placed in three rooms with an expected population of 900 to 1,000 participants. Participation was completely voluntary and anonymous. There was no feasible way of identifying any individual's responses. Participants could stop taking the electronic survey at any time. A total of twelve questions were asked with seven questions analyzed for this article. The survey took fifteen minutes to complete. All responses were grouped and summarized. A Likert scale was used and it is a technique that is used to determine the level of agreement or attitude towards a statement (Ary,D., Jacobs, L.C., & Razavieh, A. 1990).
The results of farmer P knowledge, attitude and management practices are summarized in this article. SAS 9.3 statistical software was used to analyze the data using Chi-Square analysis (p=0.05) (SAS 9.3, 2011).
Research Results
A total of 425 surveys were recorded from 500 electronic clickers with 133 usable surveys for participants who identified themselves as farmers. Not all farmers answered all questions. Reported farm sizes ranged in size from less than 250 acres to greater than 2,500 acres (<250 acres (N=18, 13.5%), 251 to 500 acres (N=20, 15.0%), 501 to 1,000 acres (N=31, 23.3%), 1,001-2,500 acres (N=42, 31.6%), and more than 2,500 acres (N=22, 16.5%)) with a total of 133 (100.0%) farms surveyed.
Farmers were asked to describe the soil testing method that best described the method used on their farm (N=128). The farmers reported the following: 2 farmers (1.5%) used no soil testing or their soil tests were greater than five years old, 7 farmers (5.4%) used more than 25 acres per soil sample test, 21 farmers (16.2%) used less than 25 acres per soil sample test, 65 farmers (50%) used grid soil sampling using 2.5 acre grids, 28 farmers (21.5%) used zone soil testing by soil type, and 7 farmers (5.4%) used zone soil testing by yield.
Soil testing method by farm size is presented in Table 1. A Chi-Square test was conducted and a relationship was found between soil testing method and farm size X2 (20, N=130) = 33.83 p = 0.0273. There were 17 (13.1%) farmers operating less than 250 acres, 20 farmers (15.4%) who farmed 251-500 acres, 29 farmers (22.3%) farmers operating 501-1,000 acres, 42 (32.3%) farmers operating 1,001-2,500 acres, and 22 (16.9%) farmers operating greater than 2,500 acres.
The individual farmer data (Table 1) showed farmers that ran small farm operations with less than 250 acres used primarily grid soil sampling (N=6, 35.3%) although at a lower rate than larger farms, took soil samples representing less than 25 acres (N=5, 29.4%) and used zone soil sampling by soil type (N=3, 17.7%). However, the 2 (11.8%) farms that did not soil sample were small farm operations with less than 250 acres. Farmers in the 251-500 acre category used primarily grid soil sampling (N=7, 35.0%), and zone soil sampling by soil type (N=6, 30.0%) and took soil samples representing less than 25 acres (N=5, 25.0%). Farmers in the 501-1,000 acre category primarily used grid soil sampling (N=20, 69.0%) with some having used zone soil sampling by soil type (N=4, 13.8%) and soil samples representing less than 25 acres (N=3, 10.3%). The largest farm group were the 42 (32.2%) farmers with 1,001-2,500 acres utilized grid soil sampling (N=19, 45.2%), zone soil sampling by soil type (N=12, 28.6%), zone sampling by yield (N=5, 11.9%), and soil samples representing less than 25 acres (N=5, 11.9%). The largest farm operation category, greater than 2,500 acres, used grid soil sampling (N=13, 59.1%), one soil sampling by soil type (N=3, 13.6%), and soil samples representing less than 25 acres (N=3, 13.6%). As farm size increased, farmers used more intensive soil sampling methods including grid soil sampling and zone sampling by soil type or by yield.
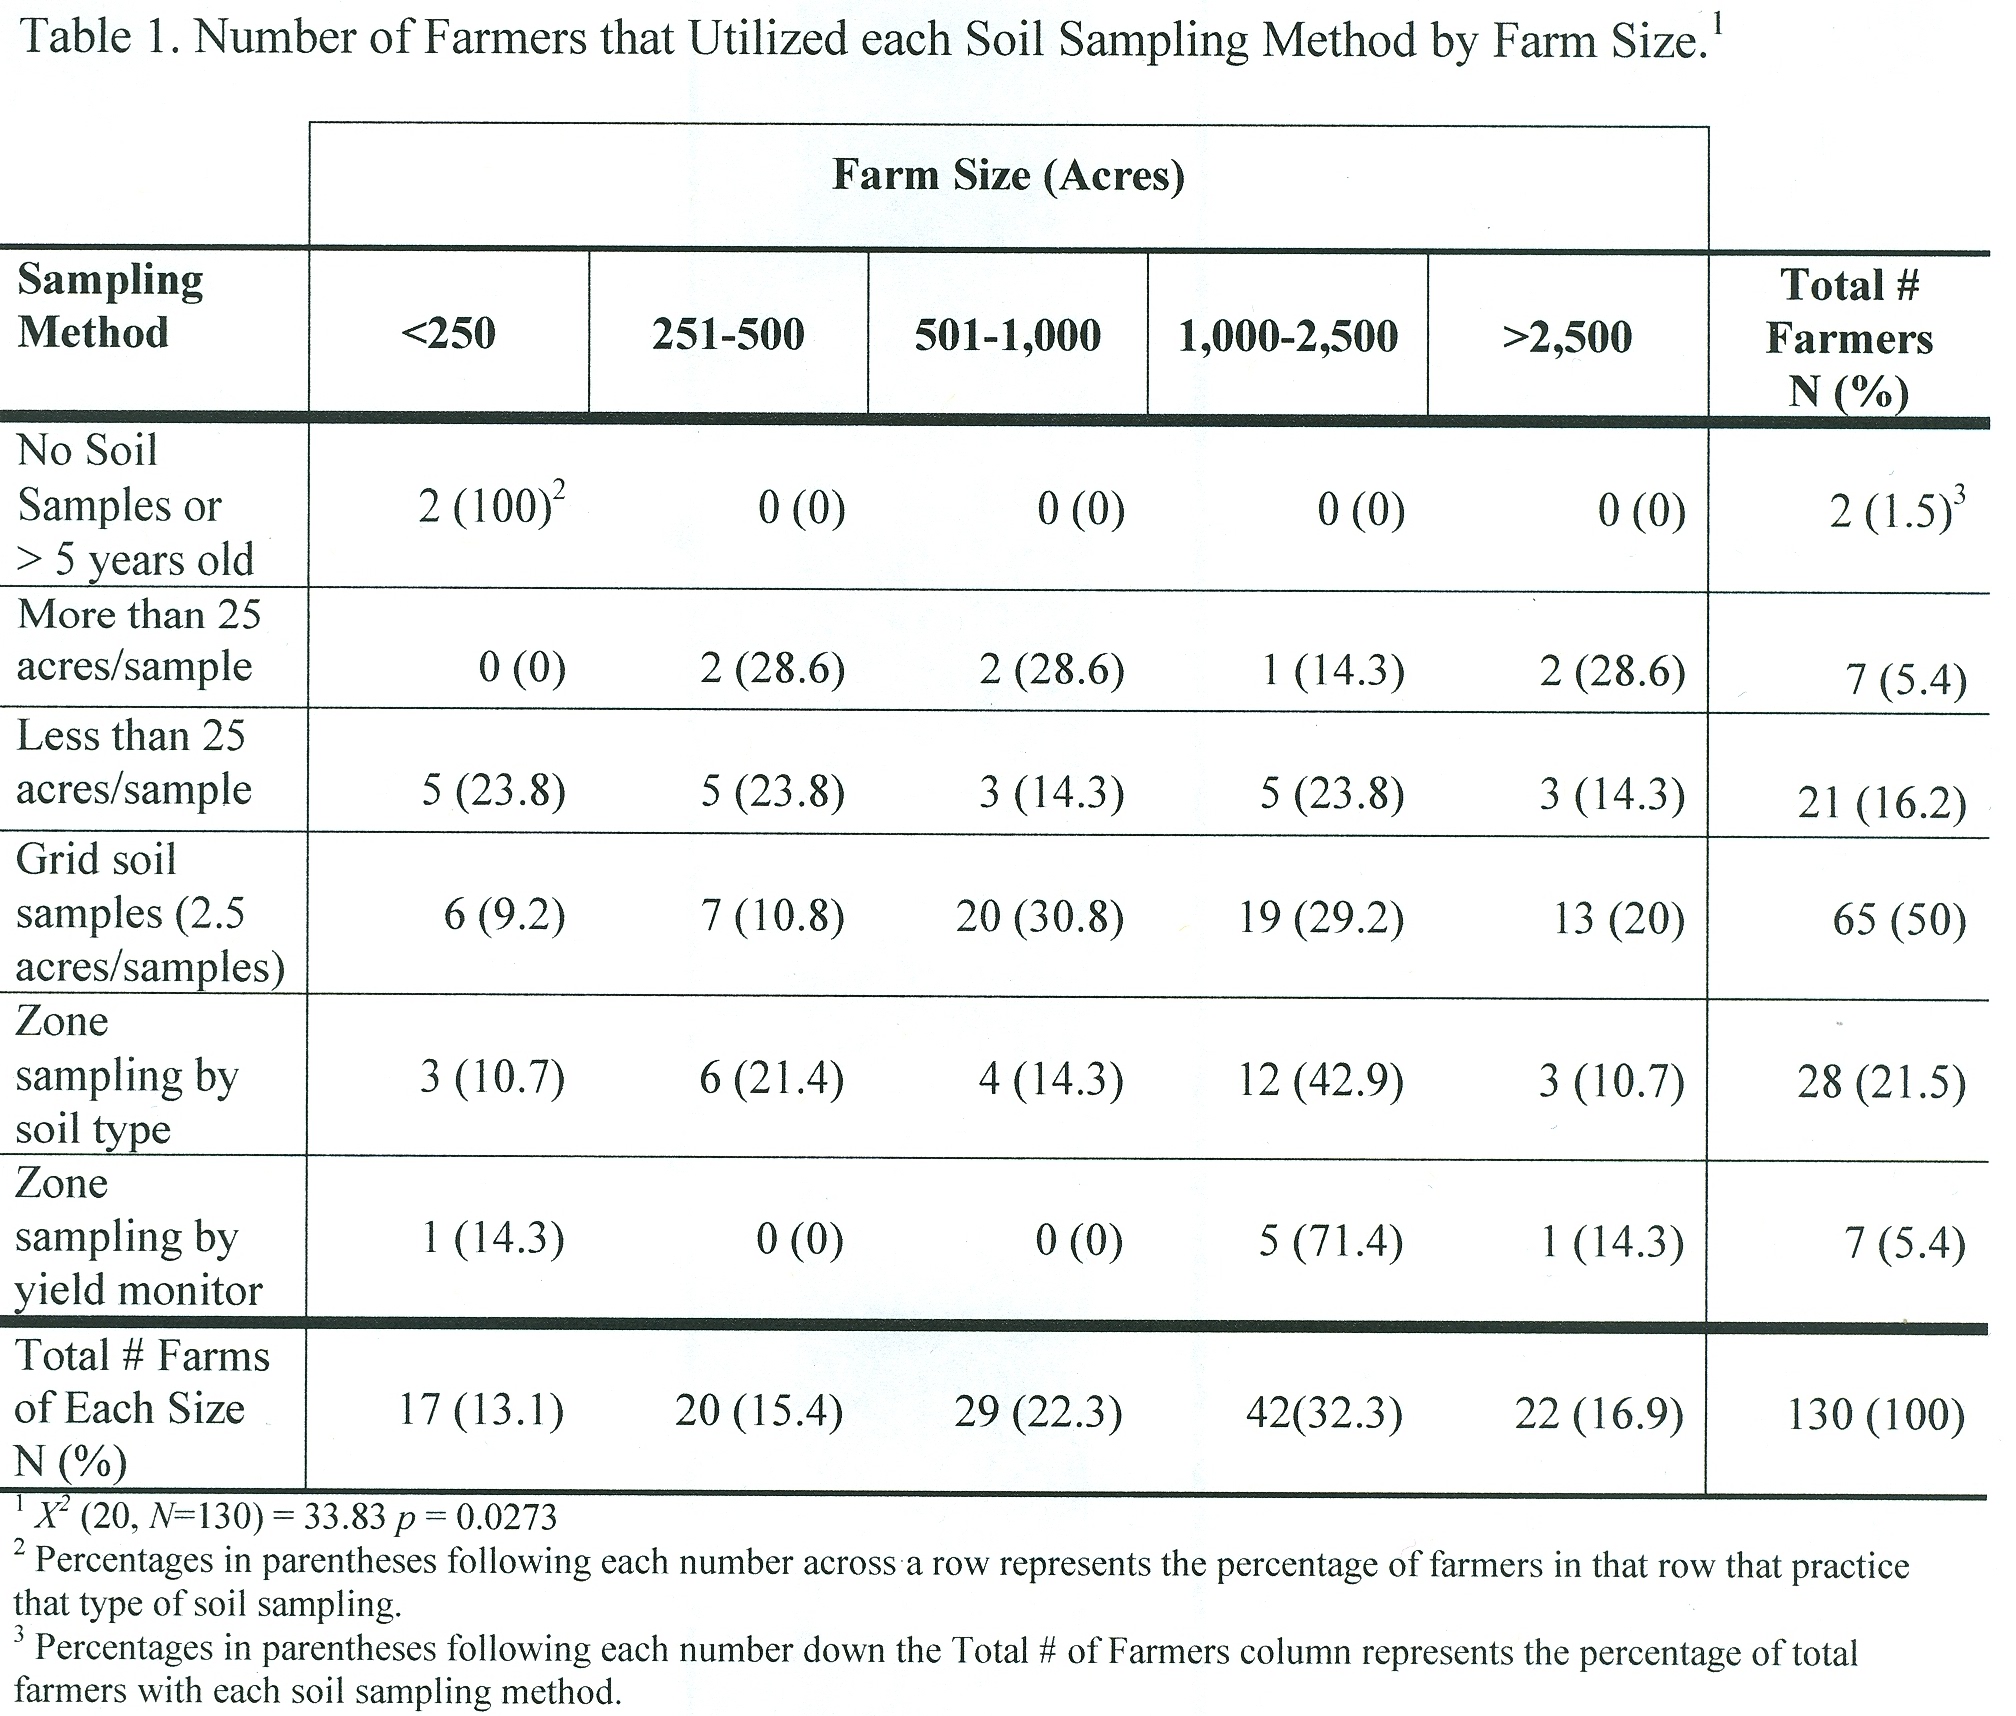
When soil testing methods were compared by size of farms, small farm operations with less than 250 acres (N=2) are the only farms that did not soil sample in this survey, representing 1.5% of all farms. Only 7 farms (5.4%) sample fields greater than 25 acres per sample and 21 farms (16.2%) sample fields with less than 25 acres. On grid soil testing, the mid-sized and larger farm operations used this technique more intensively with 501 to 1,000 acre farms (30.8%), 1,001 to 2,500 acre farms (29.2%), and farms greater than 2,500 acres (20.0%) used this technique the most often. Zone soil testing by soil type was used extensively by 1,000 to 2,500 acre farms (42.9%) and by 251-500 acre farms (21.4%). Zone sampling by yield was used mainly by the larger farms with 1,001 to 2,500 acres (71.4%).
Farmers were asked, “At what Bray P1 phosphorus (P) soil test level would they (farmers) stop applying additional commercial fertilizer?” One potential issue with this question has been that some soil test laboratories (almost 50%) were using Mehlich-3 phosphorus soil testing methods and farmers may not have known the difference between the two testing methods. A Chi-Square analysis showed no relationship between farm size and the answers to Bray P1 levels X2 (16, N=114) = 12.95 p = 0.678.
Farmers were asked, “What time of year did they apply P fertilizer?” No relationship was found between farm size and timing of P fertilizer application, X2 (12, N=125) = 16.26 p = 0.1798.
Farmers where asked how P fertilizer was applied on their farm fields. A Chi-Square analysis showed no relationship when this question was analyzed by farm size X2 (16, N=128) = 12.78 p = 0.4003.
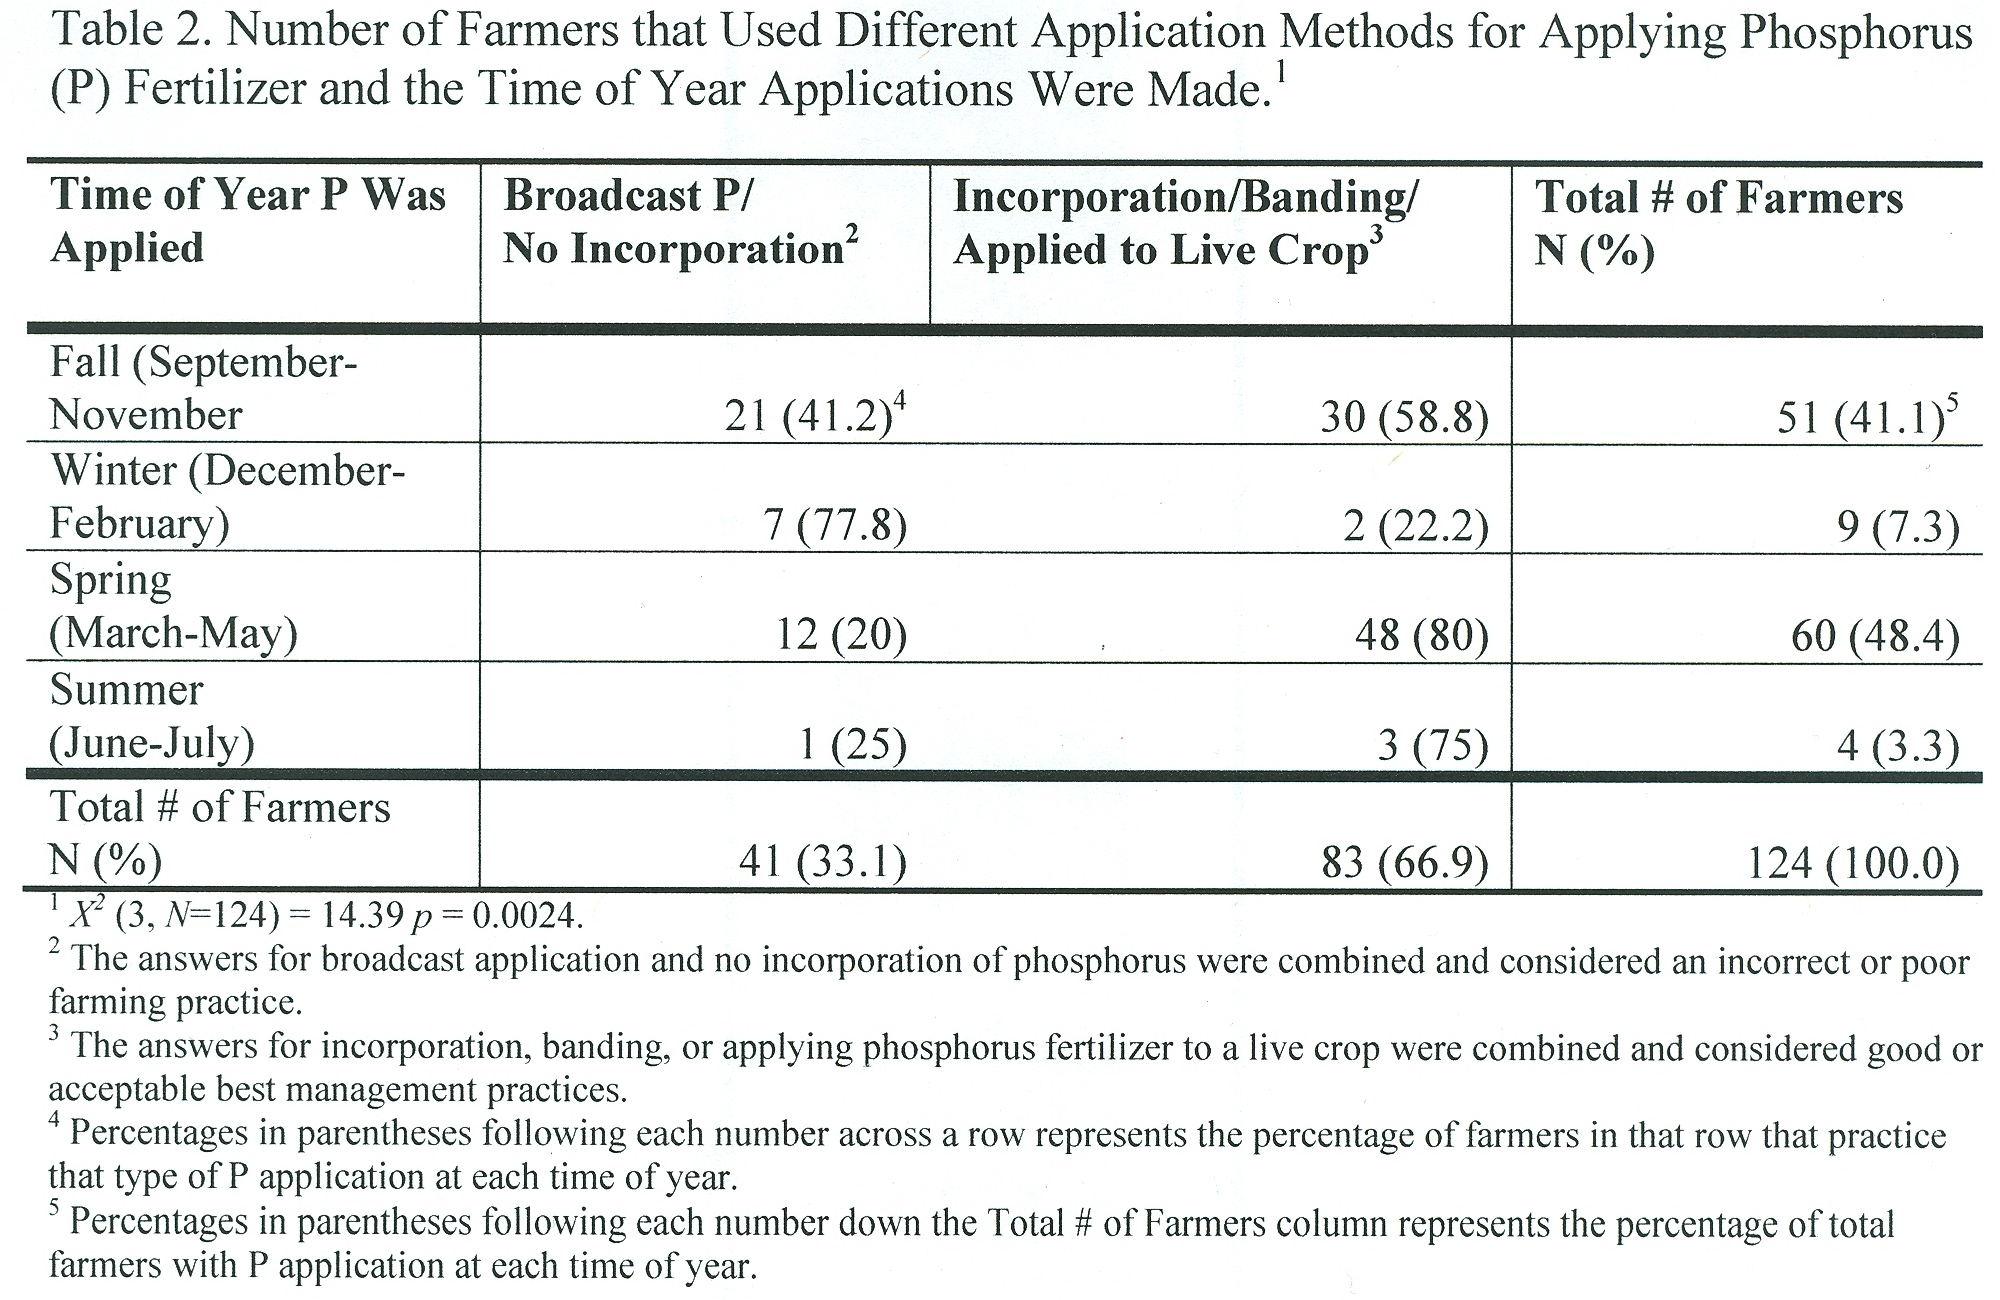
Application method by the time of year farmers applied P fertilizer is presented in Table 2. A Chi-Square analysis showed a relationship between application method and time of the year P fertilizer was applied X2 (3, N=124) = 14.39 p = 0.0024. Farmers who broadcast fertilizer with no incorporation (N=41, 33.1%) applied P fertilizer differently than farmers who incorporated P fertilizer, banded, or applied P to a standing crop (N=83, 66.9%). The farmers that broadcast P fertilizer with no incorporation applied less fertilizer in the spring (March-May) (N=12, 20%) and summer (June-August) (N=1, 25%) than farmers who used other application methods (spring (N=48, 80%) and summer (N=3, 75%).
A Likert-type scale (Strongly Agree, Agree, Neutral, Disagree, and Strongly Disagree), was used to assess farmer attitudes about whether “Farm Phosphorus loss is a significant problem in Ohio’s waters?” (Table 3). Overall, 21.9% farmers (N=28) strongly agreed with this statement, 50.8% agreed (N=65), and 19.5% were neutral (N=25). However, 7.8% disagreed or strongly disagreed (N=10) that P runoff was an issue in surface water in Ohio. A Chi-Square analysis showed a relationship between farm size and attitude about farm P loss is a significant problem in Ohio’s waters X2 (16, N=128) = 27.04 p = 0.0411.
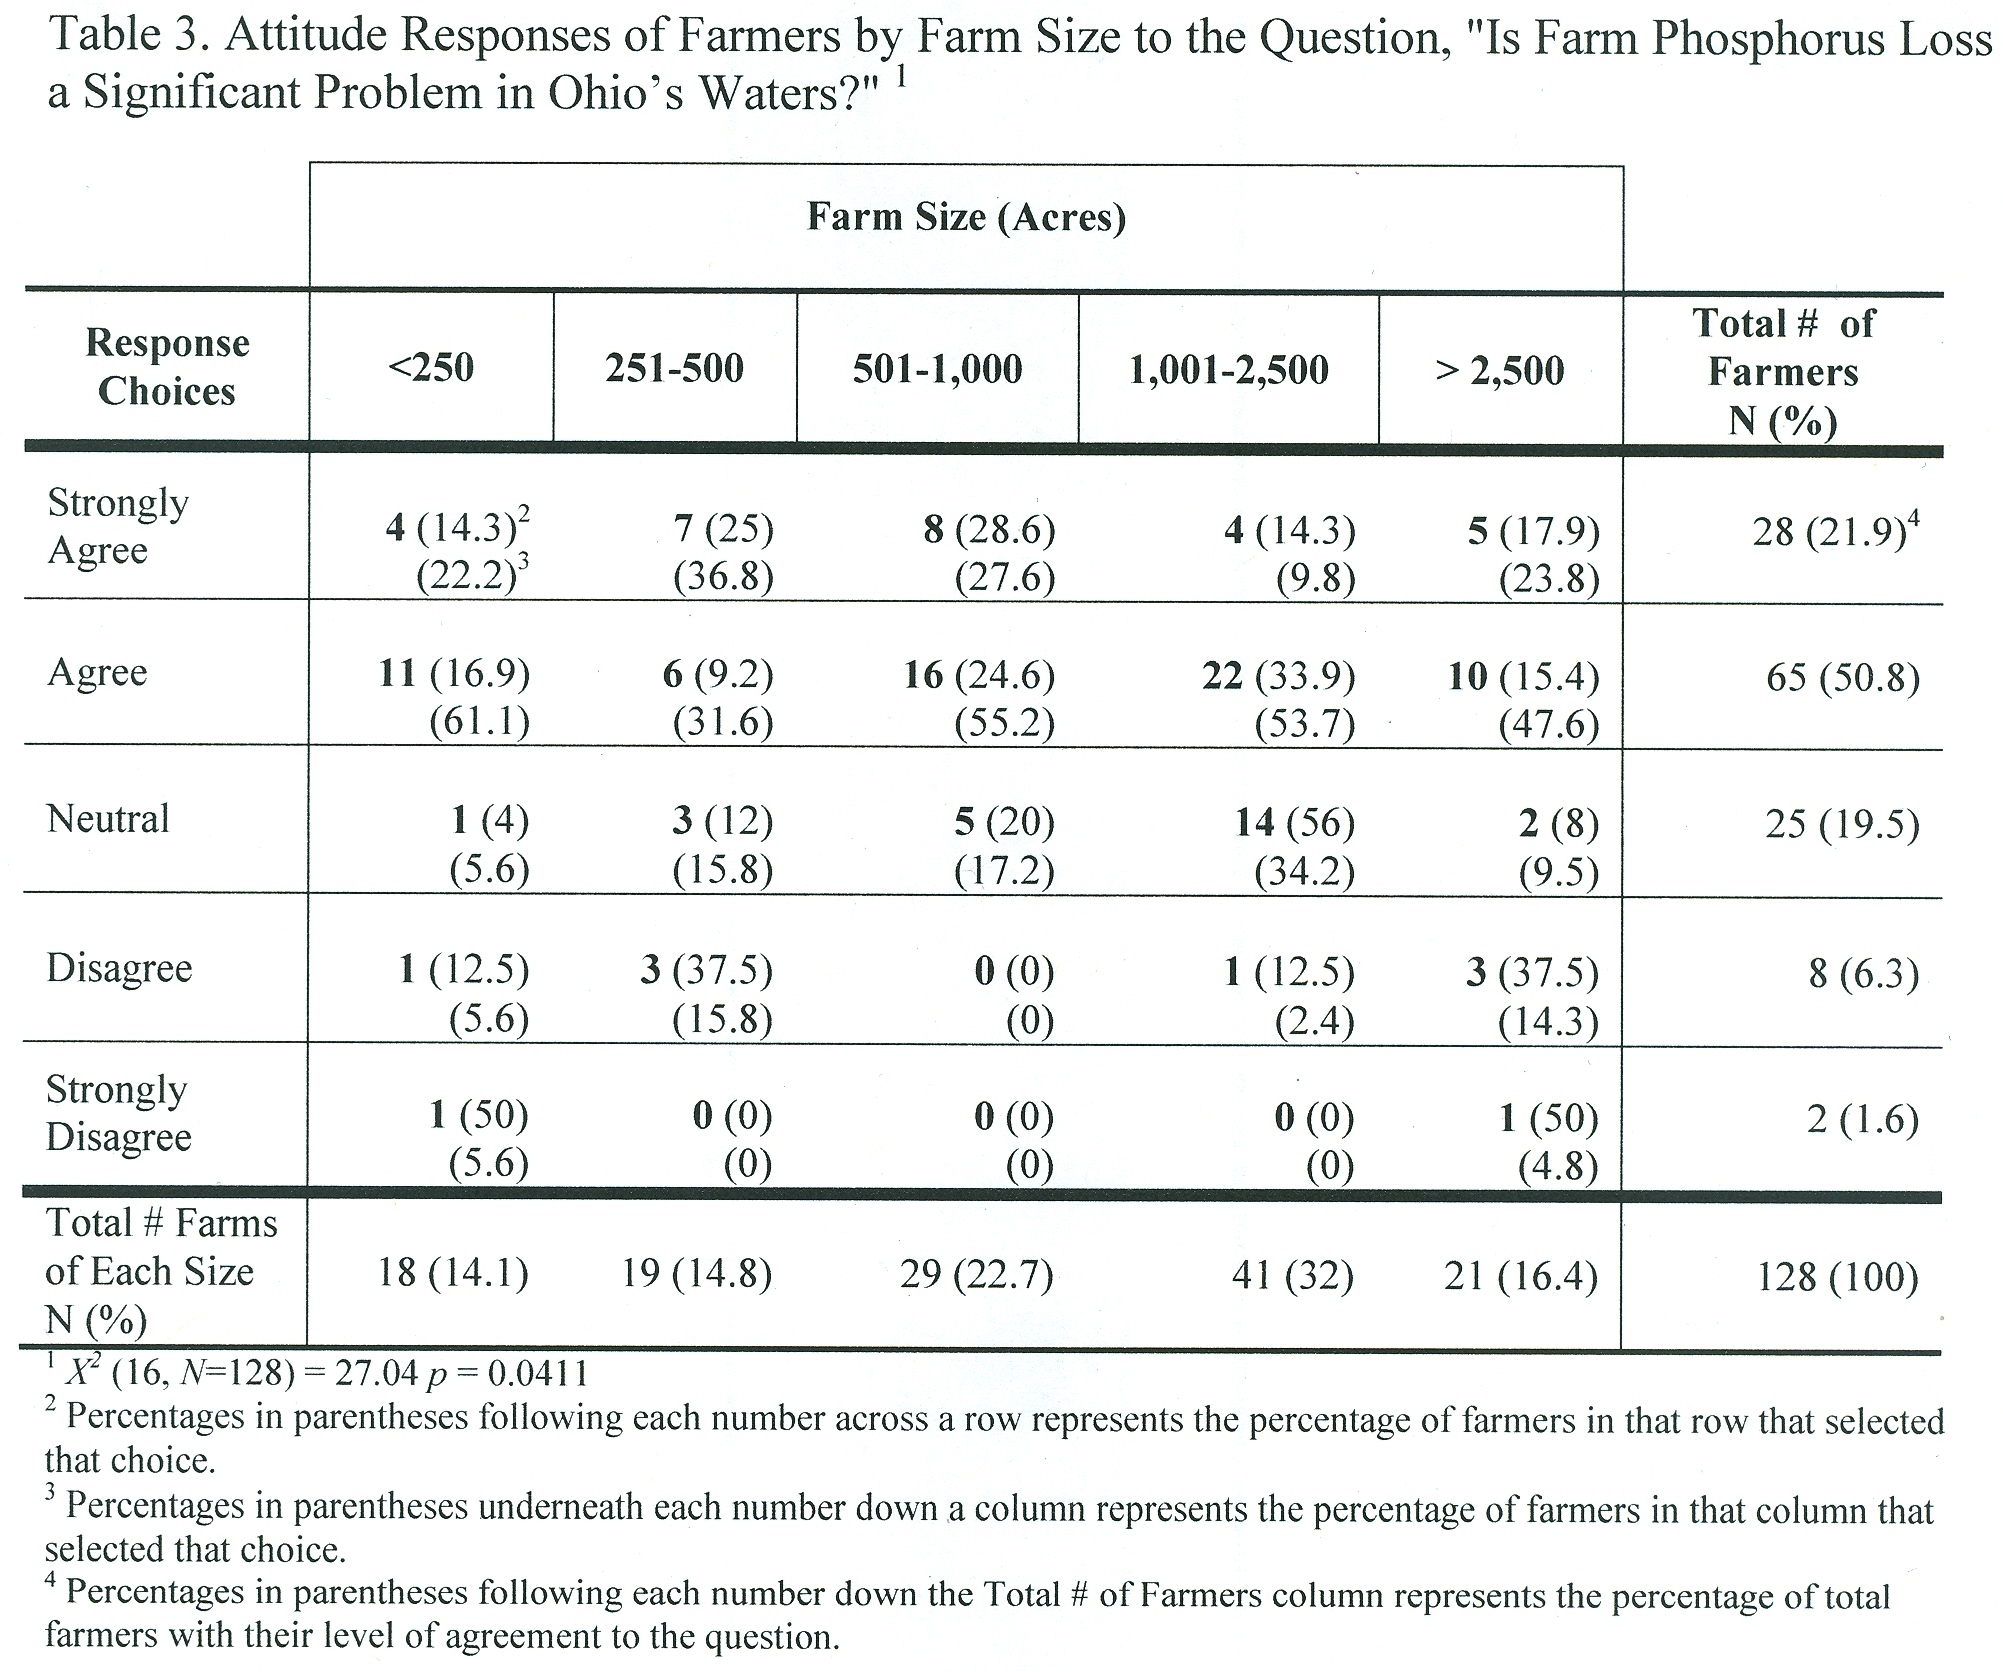
The smallest farm operations with less than 250 acres reported that 83% (N=15) agreed or strongly agreed that P runoff in surface water is an issue in Ohio. However, about 16.6% (N=3) either were neutral, disagree, or strongly disagree with that statement. Farm operations in the 251 to 500 acre range, had more farmers who strongly agreed (36.8%, N=7) with 31.6% agreed (N=6) and 15.8% neutral (N=3). Only a few farmers (N=3, 15.8%) disagreed. Middle size farms, 501 to 1,000 acres appeared to be the most supportive of the statement with no farmers either strongly disagreed or disagreed. The largest number of middle size farms simply agreed (55.25, N=16) with 27.6% strongly agreed (N=8) and 17.2% neutral (N=5).
The largest group of farmers (N=41) is the 1,001 to 2,500 acre group who appeared to mirror the previous group except they have a few less farmers who strongly agreed and more neutral farmers. The largest farm operations with more than 2,500 acres appeared to be the most diverse group with 71.4% either agreed or strongly agreed (N=15), however, 28.6% (N=6) were neutral, disagreed, or strongly disagreed. Overall, the smallest and largest farmers appeared to be the most diverse in their attitudes toward P runoff in surface water and appeared to be more likely to have disagreed that P runoff in surface water is an issue in Ohio.
Those who strongly agreed with the statement that P runoff is an issue in surface runoff in Ohio, the 501 to 1,000 (28.6%, N=8), and 251 to 500 acre farms (25.0%, N=7) were the most supportive of this statement. The 1,000 to 2,500 acre farms (33.9%, N=22) and the 501 to 1,000 (24.6%, N=16) acre farms were the most likely to simply agreed with the statement or remained neutral (34.2%, N=14), (17.2%, N=5) respectively. The largest farms with greater than 2,500 acres and the 251 to 500 acre farms (37.5%, N=3 each group) were the most likely to have disagreed and the largest and smallest farms were also the most like to have strongly disagreed (5.6%, N=1).
The same Likert scale was used to ask farmers if Tri-State Fertility Recommendations on P fertilizer limit maximum crop yields. There was no relationship between farm size and the response to this question X2 (16, N=124) = 11.98 p = 0.7453.
Major Conclusions and Implications
The 4 Rs nutrient stewardship program (4Rs nutrient stewardship website) is being promoted in Ohio with specific emphasis on rate, time, and placement as ways to reduce agricultural P losses. Farmers (N=133) responded to seven questions about their P management practices, knowledge, and attitudes.
Soil testing method (N=130) and attitude on whether P runoff is an issue in Ohio were significantly different based on farm size. Farmers soil test regularly (98.5%) and as farm size increases, farmers use more intensive forms of soil testing including grid soil testing and zone soil testing by soil type. The majority of farmers (72.6%) strongly agreed or agreed that P runoff is an issue in Ohio. Farmer attitudes towards the Tri-State Fertility recommendations were mostly positive with only 17.8% of farmers feeling that Tri-State Fertilizer recommendations limit crop yields.
Farmer P knowledge on when to stop applying P fertilizer was low with only 12.3% knowing the critical soil test level to stop applying P fertilizer for corn and soybeans. While this knowledge level is low, the survey population (farmers) may be responding on memory alone and farmers may not develop fertilizer applications without the Tri-State Fertility Recommendations Bulletin in hand. Extension professionals may use this low knowledge level on when farmers should stop applying P fertilizer as reason to prioritize teaching P fertilizer rate management. Farmers with improved knowledge of when to stop applying P fertilizer may help avoid unnecessary P fertilizer applications when communicating with local agribusiness. Statewide, P application in Ohio is being applied at crop replacement levels when mass balance calculation is done (crops grown and fertilizer sold in Ohio/year) indicating that farmers are not over applying P fertilizer (Bast et al 2009).
Farmers reported applying phosphorus mostly in the spring (March to May, 47.2%) or fall (September to November, 41.6%). Dr. Thomas Bruulsema as Director for the International Plant Nutrition Institute has stated that “Right placement may have largest impact in mitigating P runoff.” Almost one third (32.0%) of farmers reported broadcasting P with no incorporation.
Literature Cited
4 Rs Nutrient Stewardship. What are the 4 Rs? Available at: http://www.nutrientstewardship.com/what-are-4rs. Verified as of November, 18, 2013.
Ary, D., Jacobs, L.C., & Razavieh, A. (1990). Introduction to research in education (3rd Edition). New York: Holt , Rinehart and Winston.
Bast, L., R. Mullen, I. O’Halloran, D. Warncke and T. Bruulsema. 2009. Phosphorus Balance Trends on Agricultural Soils of the Lake Erie Drainage Basin. Better Crops 93(1):6-8.
Bruulsema, T.W. January 2013. 4Rs and Fertilizer Fate presentation. Ohio Agri-Business Association Crop Production Conference, Columbus, OH.
Chesapeake Bay Program, Reducing Phosphorus Pollution, Available at: http://www.chesapeakebay.net/indicators/indicator/reducing_phosphorus_pollution. Verified as of November, 18, 2013.
Clevenger, W.B. and B. J. Allred. 2011. Concentrations of Nitrate-Nitrogen and Phosphate-Phosphorus In
Subsurface Drainage Water From Cropland With Free Drainage and Controlled Drainage Management. Proceedings of 2011 National Association of County Agricultural Agents Annual Meeting and Professional Improvement Conference. Overland Park, Kansas. http://www.nacaa.com/ampic/2011/proceedings.pdf. Verified as of November, 18, 2013.
Gustafson, C. and L. Crane. 2005. Polling Your Audience with Wireless Technology. Journal of Extension [On-Line], 43(6), Article 6TOT4. Available at: http://www.joe.org/joe/2005december/tt3.php. Verified as of November, 18, 2013.
Hoorman, J.J., R.C. Reeder, A.P. Sundermeier, and G.W. Wilson. 2010. Ohio’s Conservation Tillage Conference Keeps Growing. Journal of National Association of County Agricultural Agents, Volume 6, Issue 1, December, 2010. ISSN 2158-9429. Available at: http://www.nacaa.com/journal/index.php?jid=72. Verified as of November, 18, 2013.
Hoorman, J.J., Hone, T., Sudman, T. Jr., Dirksen, T., Iles, J. and Islam, K.R. 2008. Agricultural impact on lake and stream water quality in Grand Lake St. Mary’s watershed, Western, Ohio. Journal of Water, Air, and Soil Pollution 193:309-322.
Labarge, G. (2011). Ag nutrient and water quality report released. Available at: http://corn.osu.edu/newsletters/2011/2011-38/#2
Massey, R., N. Jaskolski, and L. Sweets. 2005. The Use of Personal Response Transmitters in Extension Settings. Journal of Extension [On-Line], 43(6), Article 6TOT4. Available at: http://www.joe.org/joe/2005december/tt4.php. Verified as of November, 18, 2013.
Ohio Phosphorus Loading and Concentration Recommendations (2013).Ohio Phosphorus Task Force. Available at: http://epa.ohio.gov/Portals/35/lakeerie/ptaskforce2/P_Load_ConcRecs.pdf. Verified as of November 18, 2013
Ohio Lake Erie Task Force Final Report. 2010. Ohio Environmental Protection Agency, Division of Surface Water. Pg. 1-109. Available at: http://www.epa.state.oh.us/portals/35/lakeerie/ptaskforce/Task_Force_Final_Report_April_2010.pdf. Verified as of November, 18, 2013.
SAS Institute Inc. 2011. SAS/STAT® 9.3 User’s Guide. Cary, NC: SAS Institute Inc.
Sharpley, A.N., R.W. McDowell, J.L. Weld, P.J. Kleinman. 2001. Assessing site vulnerability to phosphorus loss in an agricultural watershed. Journal Environ. Qual. 30: 2026-2036.
Tri-State Fertilizer Recommendations. 1995. Bulletin E-2567, Michigan State University, The Ohio State University, Purdue University, pg. 10-13. Available at: http://www.extension.purdue.edu/extmedia/AY/AY-9-32.pdf. Verified as of November, 18, 2013.
United States Department of Agriculture (USDA) Natural Resource Conservation Service (NRCS). 2012. Key Findings from the CEAP-Cropland Assessment of the Effects of Conservation Practices on Cultivated Cropland in the Upper Mississippi River Basin. Available at: http://www.nrcs.usda.gov/Internet/FSE_DOCUMENTS/stelprdb1042093.pdf. Verified as of November, 18, 2013.