Journal of the NACAA
ISSN 2158-9429
Volume 7, Issue 1 - May, 2014
Using Weekly Pasture Measurements to Estimate Growth and Utilization on Dairy Pastures in Oregon
- Downing, T., Dairy Extension, Oregon State University
Seymour, J., Graduate Student, Oregon State University
ABSTRACT
Managing pastures on grazing dairies is a continuous challenge because pasture quality, quantity and growth rate are changing daily. The objectives of this study were to document weekly pasture growth, forage quality and utilization and to understand how to use this information to make management decisions on US dairies. Two dairies were studied for a year. Pastures were measured and mapped and total standing dry matter was estimated weekly in all 65 pastures using a calibrated rising plate meter. Weekly grazing wedges were developed and printed for each farm and were used to make grazing decisions that week. Paddocks grazed and residual pasture covers were recorded daily and forage cover measurements were measured weekly and entered into management software. Paddock grazing and residual heights were also included in the electronic recordkeeping. Annual dry matter yields ranged from 11,277 to 19,638 + 2582 lbs. /acre. Daily growth rates ranged from 5 to 121 lbs. per acre a day throughout the season and averaged 74 for Farm1 and 48 for Farm 2. Pasture quality and productivity in Oregon is comparable to some of the most productive pastures reported from around the world.
Introduction
High relative feed prices for dairy production have increased interest in New Zealand style pasture production in the United States as a way to remain profitable. Pasture systems and feeding more forage provides a less expensive alternative to concentrates and have been used extensively in other parts of the world (Mosquera-Losada, 1999). There are a few areas throughout the country that have done considerable work with grazing dairies (U Missouri). Comparisons between the New Zealand dairy model and conventional farming in Pennsylvania (Parker, 1992) have been made but no comparisons between New Zealand and the Pacific Northwest. It was found that farms in the Northeast US could gain $121 per cow profit by using a grazing system compared to a confinement feeding system (Parker, 1992). During the last twenty years, New Zealand has made an effort to improve its low-cost system through pasture, livestock, and grazing management. Monitoring individual paddock pasture cover is one of the key factors for achieving profitable farm management in the New Zealand dairy system. Informative data on farm pasture cover increases feed utilization by optimizing rotation lengths, improving forage conservation, and timing of fertilizer applications and forage supplementation (Dalley, 2009). Even with these highlighted benefits, only 25% of New Zealand dairy managers use a formal feed budgeting system. Observations need to be made on whether implementing pasture measurement techniques, developed in New Zealand, in Western Oregon will result in some of these stated benefits for dairy managers using forage grazing systems. The objective of this study was to measure pasture weekly for the entire grazing season and report on its effectiveness and whether the information generated was beneficial to dairy managers.
Materials and Methods
This study was conducted on two dairy farms in Tillamook County, Oregon. Farm 1 is an organic dairy that milks 220 cows and has 22 grazing paddocks and a total of 143 acres. Farm 2 is a conventional grazing dairy that has 42 paddocks with and a total of 180 acres. Farm 2 managed their herd in two mobs (groups) and milked an average of 280 cows throughout the grazing season. Herds consist of Jersey X Friesian crossbred animals for both farms that have been selected for various traits including performance on pasture. Animals were housed in free-stall barns when environmental conditions were poor. The pastures on both farms are a mixture of perennial ryegrass and white clover varieties that have been selected for use based on their performance under grazing systems. Farms 1 and 2 used irrigation when needed throughout the study. Farms also had periods of crop rotation and pasture renewal throughout the year which was documented. Soil types on both farms were favorable for pasture production as they were predominantly well drained silt loams, however, some drainage problems did exist on farm 2. Pasture cover was measured throughout the grazing season by weekly estimating standing forage cover in every paddock using a rising plate meter (Jenquip, Feilding, New Zealand) and tabulating that data using Pasture Coach software (Farm Software Solutions Ltd, Darfield, New Zealand). The route through the fields was the same every week in addition to the amount of samples taken in order to reduce error. Calibrations for the rising plate meter were performed three times to account for seasonal variability. Calibration was done by measuring a known pasture area, cutting forage within the area using hand shears, drying the sample at 122 degrees F for 24 hours, and weighing the dried result. Field measurements with the rising plate meter were taken as a composite of 30-50 individual samples as suggested by the equipment manual and the literature (Gourley and McGowan, 1991). Paddock samples varied by field size and established sampling route. Weekly farm walks were recorded in a field notebook for each paddock and then entered into electronic recordkeeping software (Pasture Coach). Dairy farm managers also kept track of when fields were grazed, the paddock grazing residual, and when/how much supplemental feeding took place.
Grazing feed wedges were generated on the farm after each farm walk with a laptop computer and printer. Feed wedges were printed weekly after calculating paddock covers and entering the pasture dry matter into grazing management software. These grazing wedges showed graphically all the pastures on the farm and the total standing dry matter that week. They also showed growth rate for the week expressed in pounds of dry matter per acre.
Bulk tank weights were recorded and monthly milk shipped was totaled for the each herd. Every tank shipped was analyzed for somatic cell count, fat content, protein content and lactose content using mid-infrared spectrophotometry (TCCA lab, Tillamook, OR. Organic Valley Cooperative). Forage mass in each paddock was measured and analyzed using Pasture Coach software (Darfield, New Zealand). Weekly Pasture samples were collected at random and analyzed for desired characteristics with Near Infrared Reflectance spectroscopy (NIR) and Wet Chemistry (Dairy One Forage Lab, Ithaca, New York). The amount and cost of feed that was purchased to supplement grazing was recorded to calculate the economics of the pasture systems.
Results and Discussion
Feed wedges were used to monitor when pastures were getting ahead of the herd utilization to make stocking change decisions and timing of feed conservation. The red diagonal line is termed ‘the grazing window’ and represents a trend line that grazing managers use to compare to their current inventories. Figure 1 and Figure 2 are examples of the grazing wedge that was produced weekly for each farm. In this example, these wedges were reported only a week apart. Typically we “ideally” graze pastures down to a residual of 1500 lbs. DM/acre and theoretically harvest or graze around 3000 lbs. DM/acre. This grazing window is an arbitrary line that can be manipulated to incorporate different residual and grazing targets. Keeping pasture cover at or below the desired grazing window allows managers to maintain pasture quality throughout the grazing season.
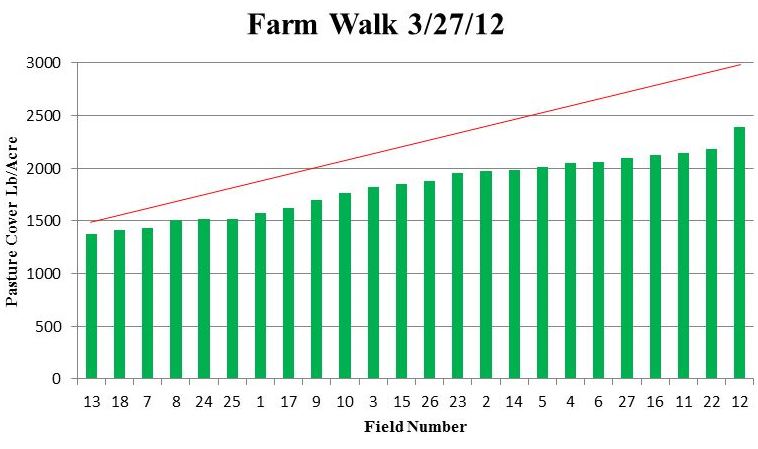
Figure 1. Farm 1 grazing wedge from 3/27/12. Field dry matter cover amounts are represented by vertical bars and grazing window is represented by black, horizontal line. All of the bars fall well under the red diagonal line so the farm cover is less than ideal.
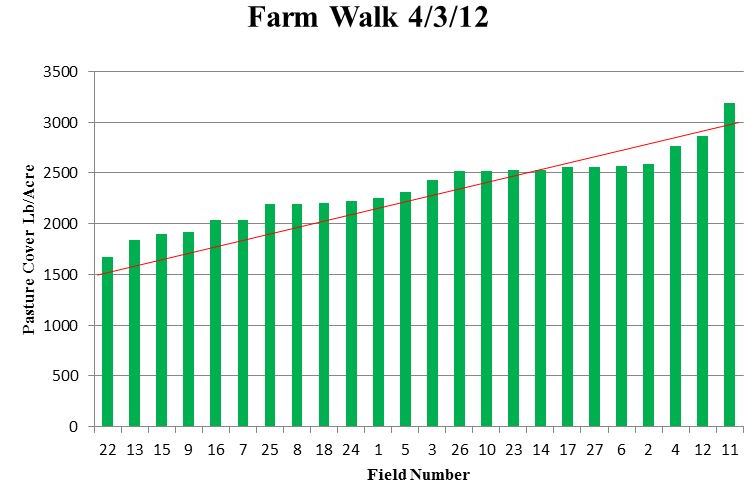
Figure 2. Farm 1 grazing wedge from 4/3/12. Here we can see pasture dry matter cover is starting to rise above the grazing window for some fields. This situation is typical of rapidly growing spring pastures.
Figure 3 below illustrates what happened when spring pastures were rapidly growing and got too mature. This dairy was late in timing feed conservation because they had to wait on a contract team to cut and bale their silage and resulted in the wedge seen in Figure 3. However, this wedge gives the operator the confidence to harvest the surplus aggressively because they can see the inventories and we know the current growth rate. This is really the data that helps make good decisions in these grazing systems.
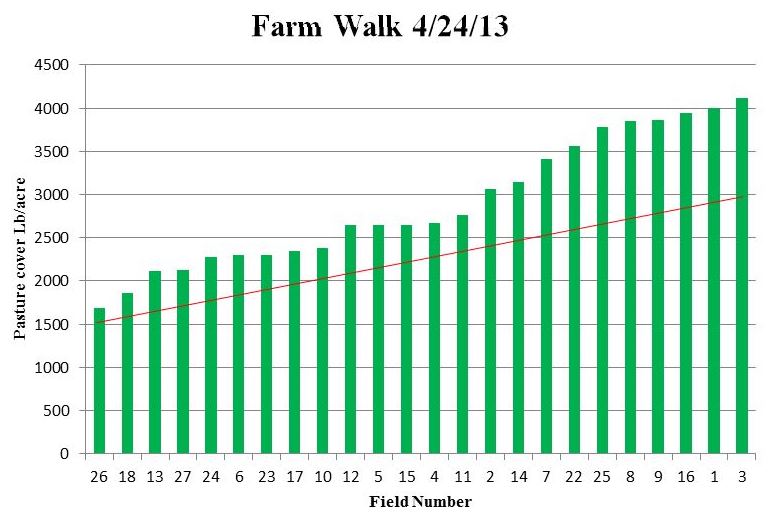
Figure 3. Farm 1 grazing wedge from 4/24/13. Many pastures are now above the grazing window line and pasture quality is decreasing.
Results from using the feed wedge for daily management decisions were positive. Managers on both farms found it to be a valuable tool and want to continue to use them in the future to aid in management decisions. Feed wedges provided a good way to evaluate overall pasture performance at the paddock level and allowed for paddock to paddock comparisons. Feed wedge reports showed the managers graphically that paddock cover was getting out of hand during points throughout the year. Managers on both farms stated they would like to continue to use the feed wedges to improve their pasture management practices.
Annual growth data was collected during farm walks and reported using the Pasture Coach software. There was variation in growth when comparing paddocks with some performing better than others. Paddock comparisons can be made from this data to influence management decisions. From this data we were also able to generate annual production curves for both farms. Annual production by month had the same trend as annual growth rate by paddock which is shown in Figure 4. Both farms had a charateristics dip in growth rates during a period when we would have expected the highest growth rates of the year potentially. We have hypothosized this depression is really a result of the maturity of the whole farm getting further along and causing the growth rates to slow.
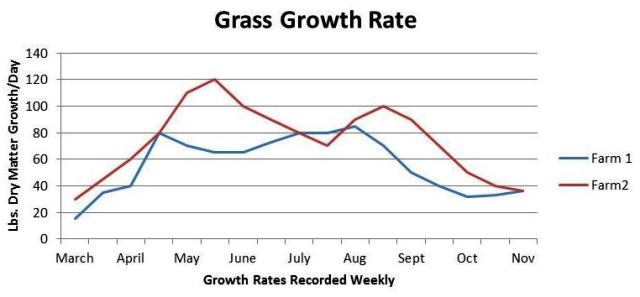
Figure 4. Daily grass growth for Farm 1 and Farm 2 throughout the growing season expressed as lbs. DM/acre/day.
Daily dry matter growth took a substantial drop in the summer after the rapid spring growth phase. After this summer depression, growth on both farms rose again in the fall before their eventual decline leading into winter. Growth rate overall was higher on Farm 2 likely as a result of superior fertility as Farm 1 was not able to utilize commercial fertilizer (Table 1). The drop in summer growth was greater on Farm 2, falling to the same growth per day as Farm 1 but the fall growth on Farm 2 increased significantly compared to Farm 1 (Figure 4).
Forage samples were taken every week representing the approximate quality of grass being grazed. Pasture analysis data averaged over the study is shown below for both farms are shown in Table 2. Farms were evaluated for their performance based on milk volume and milk solids produced per acre of pasture. Supplemental feed was totaled daily and from that an estimate of the amount of milk and milk solids from pasture were made in Table 3.
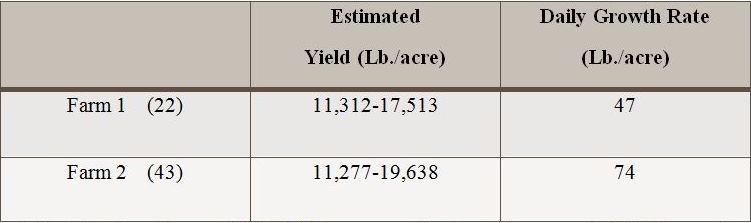
Table 1. Estimated annual DM yeild per acre and estimated average daily DM growth rates for Farm 1 and Farm 2.
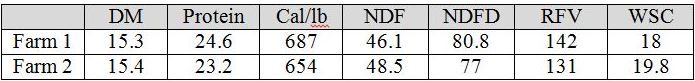
Table 2. Average weekly forage analysis of pasture (36 weeks) from March through November.
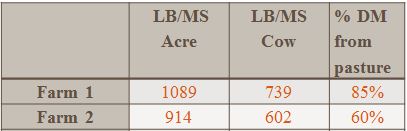
Table 3. Milk solids produced per acre and per cow from grazing pasture throughout the 9 month grazing season.
Figure 5 and Figure 6 show the percentage of DM fed by month as pasture or conserved feed for Farm 1 and Farm 2 respectively. Farm 1 showed a high return of pasture harvested to milk solids produced at 1089 lbs. per acre and 739 lbs. per cow from pasture and Farm 2 showed a lower level milk solids (MS) from pasture because they fed more grain and alfalfa hay early in the spring and into the fall. Farm 2 had 914 lbs. of milk solids per acre and 602 per cow. For the grazing season in 2012, milk solids in the organic herd were valued over $4.00 per pound so we conclude this dairy produced ($4 x 1089 lbs.) over $4350 of milk solids per acre for the whole farm from grazed grass. Farm 2 milk solids were valued on average at $3.20 per pound so this dairy sold approximately $2924 worth of milk solids per acre from grass in 2012.
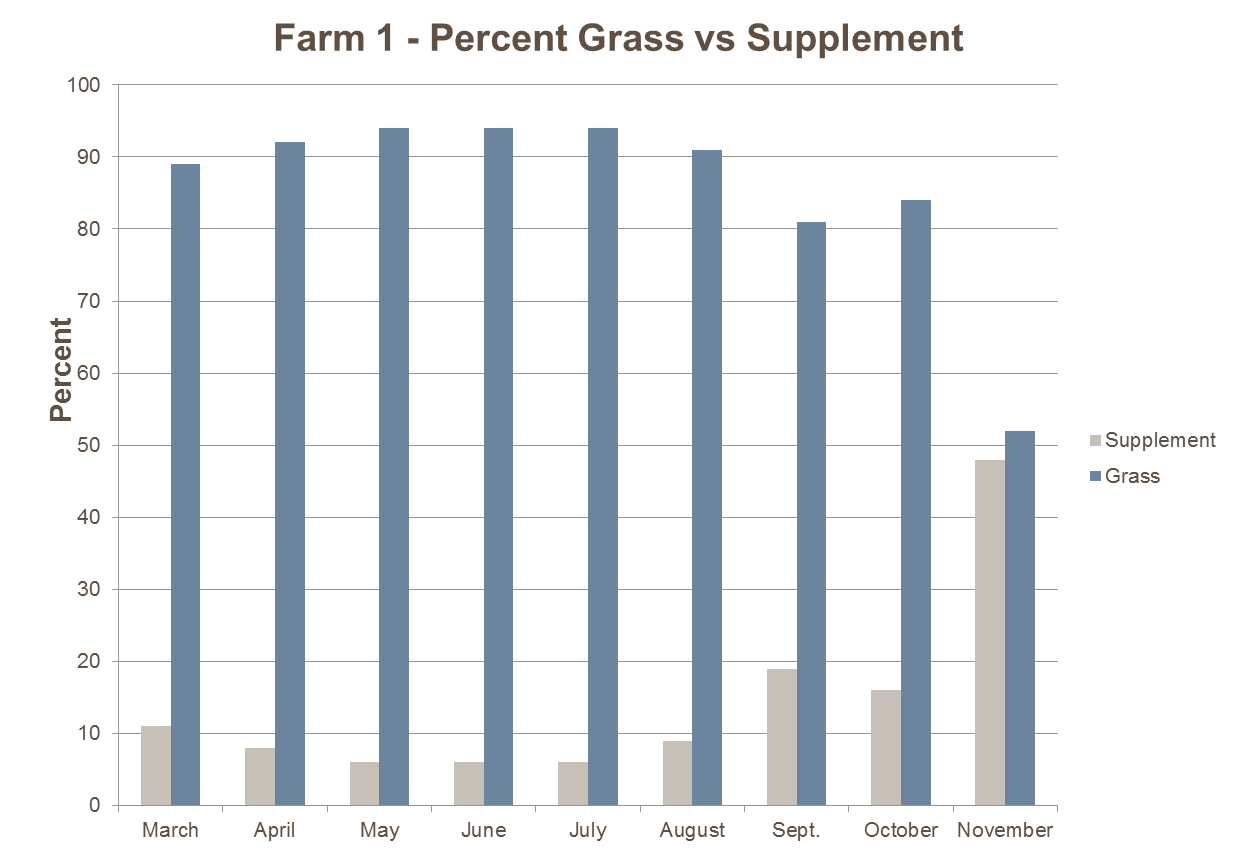
Figure 5. Percent of Pasture vs. Supplement fed by month for Farm 1 throughout the grazing season.
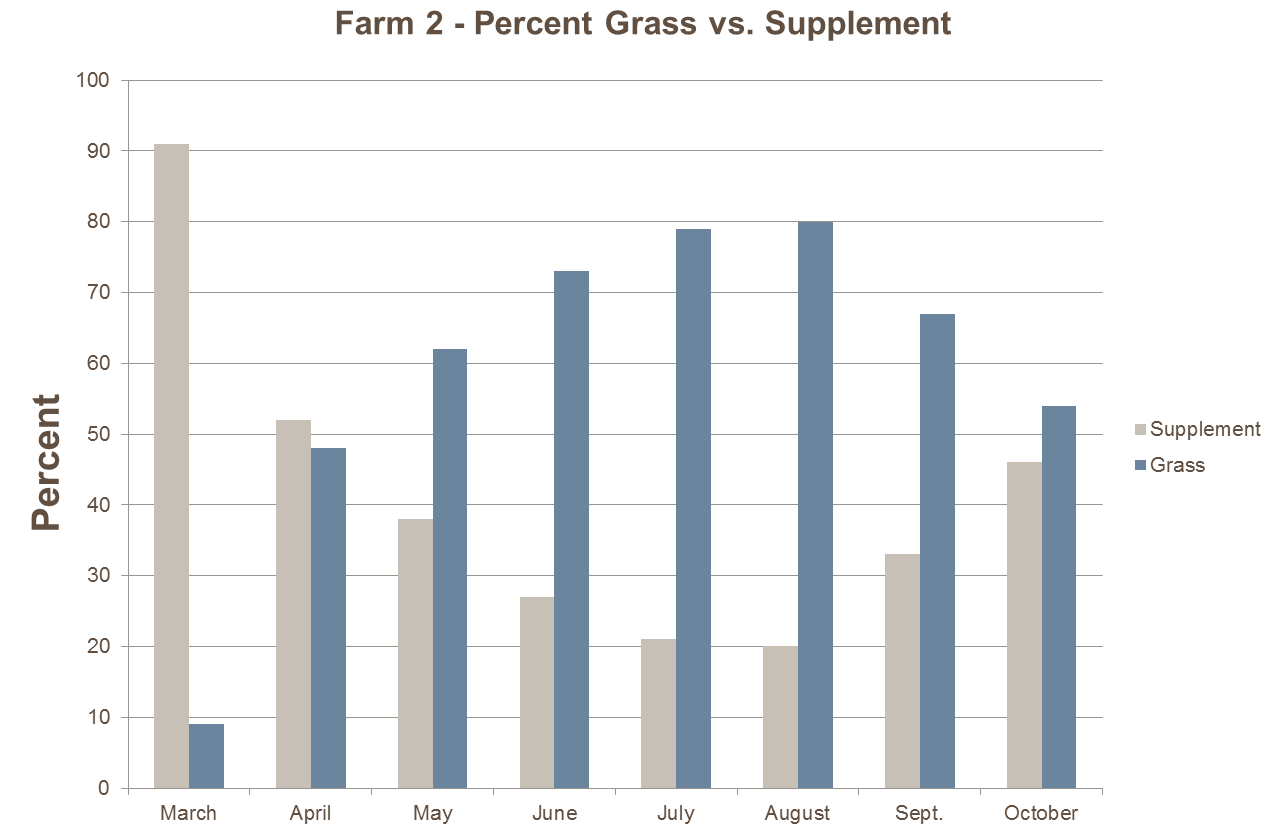
Figure 6. Percent of Pasture vs. Supplement fed by month for Farm 2 throughout the grazing season.
Conclusions
The main objective of this study was to help the cooperating dairymen design a system to successfully document pasture growth, feed quality, utilization, milk production and work with them to gather this data. At the completion of this project we are now able to calculate the value and quantity of pasture grown, the return to management, and the pounds of milk solids produced per acre. We hoped this project would provide real farm data that we could use to talk about the economics of pasture-based dairy production in Western Oregon and be able to share our results with farmers throughout the region and the country.
Cooperating farmers were able to utilize weekly feed wedge reports and found them very useful. Feed wedges provided an aid for daily management decisions including which paddock to graze and when to conserve feed. Annual growth data collected during the study showed that pasture production on both farms was highly variable due to seasonality and both farms experienced a period in the spring with rapid pasture growth followed by a growth depression in summer. Pasture energy values were comparable throughout the season to the Lincoln University Dairy Farm in NZ, a farm which has established itself as an operation with excellent pasture quality.
Throughout the course of the study pasture cover was found to be highly variable on both farms during seasonal changes during the year. This can be seen by the numerical values in cover change with lbs. DM/acre/day being 75 at the beginning of April on Farm 1 and 29 lbs. DM/acre/day at the beginning of October. Further variation can be seen on a field to field basis with individual paddocks ranging from 11,000 to 19,000 lbs. per acre for the year. As researchers, we admit this season long approach to measuring pasture productivity is an estimate at best and the values are certainly not exact. Even as we continued to try and calibrate the rising plate meter is difficult to pick a formula that was perfect at the low end (around 1500 lbs. per acre) and at the high end (around 3000 lbs. per acre). These two cases show the need for continual pasture measurement and management to keep up pasture quality and facilitate maximum growth in order to reduce dependency on purchased sources of feed. Parker (1992) also found that it was important to look at the entire farm system and that doing so can result in an economic advantage if grazing is managed properly.
Dairy managers found the weekly farm walk report the most interesting and helpful tool during the study. It provided the farmers with a graphical representation of the pasture cover in each paddock in a way that every employee on the farm could understand. Being able to comparatively rank pastures against one another provided an aid for making daily paddock grazing decisions. In addition, both dairy managers saw how through utilizing feed wedges they could plan on when to cut silage and in which fields to do so and they had actual average growth rates for the grazing platform weekly. In hind sight, both dairies realized they had all the information needed to more aggressively harvest forage and silage.
Results from the forage analysis and milk solids produced per acre were very encouraging. Specifically, forage quality throughout the season was high with low NDF present in forage samples and high NDFD. These energy values reported in this project are as a high as many values reported from around the world leading us to believe that pastures in Western Oregon are as productive as the best grazing areas in the world for milk cows.
Literature Cited
Dalley, D., D. Clark, D. Pairman, R. Dynes, I. Yule, W. King, and G. Mata. 2009. Technologies for measuring grass/crops. In Proceedings of the South Island Dairy Event Conference. 134–151.
Gourley and McGowan. 1991. Assessing differences in pasture mass with an automated rising plate meter and a direct harvesting technique. Australian Journal of Experimental Agriculture. 31:337–339.
Parker, W.J., L.D. Muller and D.R. Buckmaster. 1992. Management and economic implications of intensive grazing on dairy farms in the northeastern states. J. Dairy Sci. 75:2587-2597.
Mosquera-Losada R., and A. Gonzalez-Rodriguez. 1999. Pasture production in Northern Spain dairy systems. New Zealand Journal of Ag Research. 42:125-132.
University of Missouri. 2014. www.dairy.missour.edu