Journal of the NACAA
ISSN 2158-9429
Volume 7, Issue 2 - December, 2014
When Science and Public Demand Are in Conflict: The Case of Wildlife Food Plots
- McPeake, R. J., Extension Specialist - Wildlife, University Of Arkansas
Barry, J., Extension Forester, University of Arkansas
Walkingstick, T., Associate Director - Forest Resources, University of Arkansas
ABSTRACT
Extension professionals occasionally face dilemmas about how to respond to public requests for information regarding popular practices when science suggests other alternatives are preferable. Wildlife professionals encourage practices which establish native vegetation over non-native food plots. Yet a substantial industry has convinced hunters to purchase seeds and equipment presumably to increase antler growth in deer. We implemented demonstration trials in which wildlife grazing was evident in plots planted with seed and control plots with natural vegetation. Hunters are asked “why plant seeds when you can grow weeds?” It is doubtful this message will be well received, but should be given, nonetheless.
Introduction
Extension professionals occasionally face dilemmas about how to respond to public requests for information regarding popular practices when science suggests other alternatives are preferable. In this case, a substantial industry has convinced hunters and landowners to purchase seeds and equipment presumably to improve health and increase antler growth in white-tailed deer (Odocoileus virginianus). Many wildlife professionals view food plots as a minor habitat management tool in a comprehensive deer management plan. Wildlife professionals prefer more economical practices implemented over larger acreages than food plots, such as prescribed burning and forest thinning, to encourage native plants.
We describe how Extension personnel implemented demonstration trials which addressed hunters’ information needs despite wildlife science indicating alternative practices produce better, more economical outcomes. The demonstration trials compared plots planted with commercially-available seed with a control plot (no seed) to help local county agents address hunters' questions about plantings to attract white-tailed deer. Plots were disked, and fertilizer and lime was applied to each plot. Exclosure cages were installed and plant materials collected inside and outside cages. Although plants were grazed in seeded plots as expected, grazing also occurred in "control" plots where little or no grazing was expected initially. Results in food plot demonstration trials unexpectedly supported native plant practices, though the educational message is still difficult to diffuse among hunter audiences.
Background
County Extension agents, agronomists, forage specialists, and wildlife professionals receive numerous requests from hunters seeking the “magic bean” to produce large-antlered bucks as displayed on seed packages. Increased media marketing has changed hunter expectations for deer harvest (Brown & Cooper, 2006). Agriculture and outdoor stores promote planting cultivated, introduced seeds in food plots.
The concept of food plots (i.e., food patches) using farm crops was introduced in the 1930’s to buffer game birds from inclement weather in an emergency (Leopold, 1933). Food plots have increased in acceptance among hunters today who plant farm crops to attract deer. Marketers have succeeded at selling food plots as a management practice. Wildlife professionals are concerned that hunters and landowners are ignoring improvements to native vegetation which benefit not only deer (which some contend are already overabundant), but other less-abundant wildlife species.
Many wildlife professionals believe it is unrealistic for deer to grow bigger antlers from food plots alone (e.g., Miller & Marchinton 1995). Food plots undoubtedly attract deer particularly when surrounding habitat quality is poor, but deer require optimal nutrition and health for antlers to reach their full potential. Environmental and genetic factors play a role in antler growth and development. Deer population characteristics (e.g., age and sex ratios) and harvest management strategies also contribute to antler size indirectly through competition and food availability.
Achieving optimal growth conditions for deer and their antlers requires implementing a combination of management strategies and practices which promote a diversity of native grasses and forbs. Native plants respond to prescribed burning, forest thinning, and other practices which create soil disturbance and set back plant succession. Typically native plants are more economical and resilient to drought and flooding than those found in food plots. Native plant practices can be implemented more economically over larger acreages for improving overall deer nutrition, health, and antler size.
Establishing food plots can be valuable to hunting clubs which lease forest industry lands. Oftentimes lease agreements with the forest industry limit wildlife management practices which conflict with timber production goals. Food plots are one of the few practices hunters are allowed to implement. In this case, food plots can create plant diversity in pine plantations, for example, where other wildlife food resources are limited.
Extension professionals recommend agronomic practices, such as taking soil tests, seeding rates, and adding inoculants to legumes when advising hunters about establishing food plots. These recommendations are provided to hunters despite it being highly unlikely that establishing a food plot alone will improve antler growth. Clients may want to simply attract deer for observation or harvest, but the underlying message is that planting food plots will improve antlers,or lead to harvesting a large antlered deer.
In response to client demand, personnel at the University of Arkansas (UA) Division of Agriculture and the Arkansas Forest Resources Center established food plot demonstration trials in 2003, even though some disagreement existed about the utility of food plots among UA personnel. Some academic faculty were reluctant to support such demonstration trials because of the potential for misdirecting hunters. Others believed dialogue about food plots would lead to discussions about practices benefitting deer and other wildlife. Unexpectedly, results from demonstration trials supported implementing practices that improve native vegetation.
Methods
Extension agents and faculty volunteered to establish food plot demonstration trials following a standardized protocol. Site coordinators were responsible for selecting demonstration sites, establishing plots, and collecting data. Trials were designed to compare dry plant weights from within and outside cages in treatment and control plots. All treatment and control plots received soil amendments and were disked. Treatment plots were seeded with the same material each season as determined by consensus among site coordinators, with some planting additional products.
Study Areas
From 2003 through 2010, site coordinators selected 44 demonstration trial locations in one-third of Arkansas’ counties (n=25) (Table 1). Cooperators in various years included (1) private landowners willing to provide land and machinery (e.g., tractor and disk) for establishing food plots, (2) University of Arkansas Agricultural Experiment Stations (i.e., Pine Tree Research Station, Forestry and Livestock Research Station, Southwest Research and Extension Center), (3) the C.A. Vines Arkansas 4-H Center, and (4) Camp Joseph T. Robinson training facility for the U.S. Army National Guard.
| Planting season | County | Seed type | Seed variety and/or proportion in mix |
|---|---|---|---|
| Fall 2003 | Cleveland, Dallas, Desha, Hempstead, St. Francis | White clover | Tripoli |
| Fall 2003 | Cleveland, Dallas, Desha, Hempstead, St. Francis | Ryegrass | Marshall |
| Fall 2003 | Desha | Biologic® | Type unknown |
| Fall 2003 | Desha | Oats | Type unknown |
| Spring 2004 | Pulaski, St. Francis | Cowpeas | Iron and clay |
| Spring 2004 | Pulaski, St. Francis | Lablab | ---- |
| Fall 2004 | Dallas, Hot Spring, Independence, Johnson, Saline |
Rackmaster® Supreme Fall Mix |
Delta King grazer wheat (39%), wintergrazer 70 rye (29%), bob oats (19%), Dixie crimson clover (5%), Austrian winter peas (5%) |
| Fall 2004 | Dallas, Hot Spring, Independence, Johnson, Saline | Wheat and white clover | Natchez wheat (94%) and Durana white clover (6%) (clover seed with inoculant) |
| Fall 2004 | Johnson | Acres for Wildlife seed mix | Laredo soybeans (29%), red ripper cowpeas (29%), milo grain sorghum (14%), hegari sorghum (14%), browntop millet (14%) |
| Fall 2004 | Johnson | Soybeans | Conventional (variety unknown) |
| Fall 2005 | Pulaski | Rye | Winter magic |
| Fall 2005 | Pulaski | Wheat | Amazin grazin (mixed wheat varieties, not listed on seed package) |
| Fall 2007 | Clark, Crawford, Fulton, Lonoke, Miller, Phillips, Pulaski, St. Francis | Arkansas mix | Ranger wheat (50%), arrowleaf clover, yucchi variety (13%), purple top turnip (9%), white clover, Oseola variety (8%), common rape (20%), clover and arrowleaf inoculate (1 tbs per packet) |
| Fall 2007 | Clark, Crawford, Fulton, Lonoke, Miller, Phillips, Pulaski, St. Francis | Biologic® Full Draw | Madsen wheat (50%), tigri berseem clover (13%), civasto turnip (9%), border balansa clover (8%), kurow rape, bioroa rape, A3 rape, and nikos rape (20%) |
| Fall 2008 | Crawford, Lonoke, Miller, Pulaski, White | Arkansas mix | Ranger wheat (50%), arrowleaf clover, yucchi variety (13%), purple top turnip (9%), white clover, Oseola variety (8%), common rape (20%), clover and arrowleaf inoculate (1 tbs per packet) |
| Fall 2008 | Crawford, Lonoke, Miller, Pulaski, White | Biologic® Full Draw | Madsen wheat (50%), tigri berseem clover (13%), civasto turnip (9%), border balansa clover (8%), kurow rape, bioroa rape, A3 rape, and nikos rape (20%) |
| Fall 2009 | Crawford, Ouachita | Arkansas mix | Hass cover wheat (45 - 52%%), arrowleaf clover, yucchi variety (11 -13%), white clover (6 - 9%), common rape (26%), clover and arrowleaf inoculate (1 tbs per packet) |
| Fall 2009 | Crawford, Ouachita | Biologic® Full Draw | Tubbs wheat (45 - 52%), balady 1 or axi berseem clover (11 - 13%), border balansa clover (6 - 9%), kurow rape, bioroa rape (5%), A3 rape (11%) |
Table 1. Seed types and mixes used in food plot demonstration trials in Arkansas counties, 2003 – 2010.
Protocols
A team of agriculture and wildlife researchers, county agents, and other Extension professionals prepared the protocol for demonstration trails (McPeake et al., 2004). The protocol provided a standardized, science-based procedure for administering the demonstration trials designed to minimize labor and material expenses for data collection. Each site consisted of three rectangular replicates with three plots (9.14 m x 9.14 m; 30 feet x 30 feet) within each replicate (9.14 m x 37.43 m; 30 feet x 90 feet). Soil amendments were applied as needed to each replicate. Replicates were placed at least 3.05 m (10 feet) apart and ran parallel to a tree line, such that wildlife would have equal access to escape cover. At one site, all three replicates were placed side by side in a square (37.43 m x 37.43 m; 90 feet x 90 feet) to fit inside the forest opening.
Circular exclosure fences (i.e., cages) were placed near the middle of each plot. Cages were constructed from 5 cm (two inch) by 10 cm (four inch) welded-wire livestock fence and were a minimum of 1.5 m (five feet) in height. A 3.05 m (10 foot) section of fence was wrapped and affixed with plastic ties to two 1.52 m (five foot) or 1.83 m (six foot) T-posts set 0.91 m (three feet) apart in the middle of each treatment. Poultry wire was affixed to the bottom of the cage at one site to prevent encroachment by Eastern cottontails (Sylvilagus floridanus).
Food Plot Seed
Site coordinators agreed on seed types prior to the planting season for two treatment plots (Table 1). No seed was planted in a third plot to serve as a control. A modified block design was used (Steel & Torrie, 1980) with a particular treatment assigned to the middle plot and on either end. A diagram of the design and assigned treatment was provided in the protocol (McPeake et al., 2004).
Seed was purchased from central Arkansas suppliers or donated (Pennington Seed Company, Rackmaster® Supreme Fall Deer Mixture and Durana white clover; AgSouth Genetics, wheat variety). An Extension livestock forage professor updated planting procedures each season and formulated seed mixtures from locally-available seed sources when required. Seed from single or multiple bags with the same lot number were weighed and placed into seed packets for each treatment. When legumes were present in the seed mix, a teaspoon of dry inoculant corresponding to the plant type was added to each seed packet. Seeds were slightly dampened and mixed to stick the inoculant to the seeds and dried prior to planting.
Seeding rates were those recommended on commercially-bagged products. Those purchased from seed bins were planted at a rate comparable to commercially-bagged seeds. Seeding recommendations from the University of Arkansas Cooperative Extension Service were applied if commercial products were not part of the trial that season. Site coordinators planted seeds within a three-week timeframe. Seeds were broadcast on a firm seedbed then rolled, dragged or lightly disked to improve seed-to-soil contact.
Dry Weight Analysis
Food plots planted in the fall were hand clipped inside and outside cages in March or April depending on the growing season (Figure 1). Once notified, site coordinators were required to clip plots within a three-week timeframe. All plant materials were clipped the same day at a site. Food plots planted in the spring were clipped about 120 days after planting.
A sampling square was constructed from PCV pipe attached with 90-degree corner elbows to form a 0.43 m (17 inch) by 0.43 m (17 inch) square. The sampling square was placed inside the middle of the cage. When collecting plant materials outside the cage, the sampling square was centered 2.30 m (seven and one-half feet) to the right of the cage while facing the tree line.

Figure 1. A County Extension Agent clips plant material.
Clipped plant materials were placed inside brown paper bags and labeled according to vegetation type, plot location and replication. Paper bags were opened to air dry for a minimum of one week at room temperature to prevent mold before delivery to a central location for drying. All bags were placed in a plant drier set at 49 degrees C (120 degrees F) for at least 24 hours and weighed to the nearest tenth of a gram.
Mean difference in dry weight of plant materials was calculated by subtracting dry weight of plant materials inside cage minus outside cage. A paired t-test was conducted using SAS 9.2 (SAS, 2002) to compare dry weights of plant materials collected inside and outside cages (n=221). Plant types with at least three treatments (yielding > 2 df) were tested for significant differences (P < 0.05).
Results
Demonstration trials were implemented in one third (n=25) of 75 counties in Arkansas from 2003 – 2010 with 18 counties providing usable data (Table 1). Thirty-six percent of the 44 locations did not result in data for various reasons, including (1) lack of germination because of weather conditions (e.g., drought, flooding, tornado), (2) no plant materials to clip until after clover germination and establishment which occurred later in summer, and (3) ineffective inoculants. Some data were lost the first year when plant materials placed in white (wax) paper bags caught fire in the plant drier. Some plant materials were deemed unusable because of failure to follow protocol.
A grazing estimate was calculated using the total mean difference in dry weights of plant materials from inside and outside cages (Table 2). Negative mean differences in minimum plant weights reflected that mean weights of plant materials were higher outside than inside cages. In these instances, site coordinators reported seed did not germinate or environmental factors (e.g., shading, flooding) inside cages contributed to negative numbers.
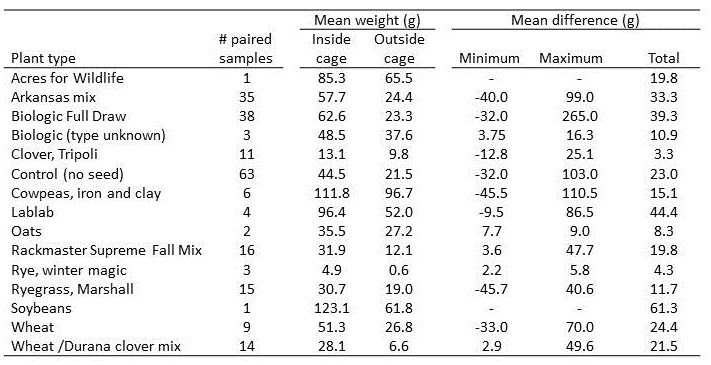
Table 2. Descriptive statistics of plant dry weights from Arkansas food plot demonstration trials, 2003 – 2010.
Control treatments (n = 63) competed well with cultivated, introduced plants (n = 158). Control treatments (23.0 g) were grazed less than Biologic® Full Draw (39.3 g), Arkansas Mix (33.3 g), Lablab (44.4 g), and conventional wheat (24.4 g). Control plots with natural vegetation (23.0 g) were grazed more than plots with wheat & Durana white clover (21.5 g), Rackmaster® Supreme Fall Deer Mixture (19.8 g), and nine others. The average mean difference among all plant materials was 25.2 g. When comparing production of individual plots, the single plot with the highest dry weight was Biologic® Full Draw (265 g). A control plot (103.0 g) edged out the Arkansas Mix (99.0 g) to rank second.
A paired t-test was conducted comparing all dry weights of plant materials. A significant difference was detected for the 221 samples collected inside and outside cages (t(221) = 11.33, P < 0.0001). Then paired t-tests were performed on plant types with at least three paired samples (Table 3). Significant differences (P < 0.05) were detected for the Arkansas mix, Biologic® Full Draw, Control, Rackmaster® Supreme Fall Mix, Marshall ryegrass, and wheat/Durana clover mix.
| Plant Type | t-value | df | P |
|---|---|---|---|
| Arkansas mix | 6.19 | 34 | <0.0001 |
| Biologic® Full Draw | 4.89 | 37 | <0.0001 |
| Biologic® (type unknown) | 2.91 | 2 | 0.1004 |
| Clover, Tripoli | 1.03 | 10 | 0.3262 |
| Natural vegetation (control plot, no seed) | 6.64 | 62 | <0.0001 |
| Cowpeas, iron and clay | 0.68 | 5 | 0.5280 |
| Lablab | 1.79 | 3 | 0.1714 |
| Rackmaster® Supreme Fall Mix | 5.40 | 15 | <0.0001 |
| Rye, WInter Magic | 3.95 | 2 | 0.0586 |
| Ryegrass, Marshall | 2.17 | 14 | 0.0481 |
| Wheat, conventional | 2.18 | 8 | 0.0608 |
| Wheat & Durana clover mix | 6.67 | 13 | 0.0001 |
Table 3. Paired t-tests of plant dry weights collected inside and outside cages in Arkansas food plot demonstration trials, 2003 – 2010.
Trial limitations and disclosures
Several limitations and disclosures should be noted concerning these demonstration trials.
- Any herbivorous wildlife species could have grazed the plots besides white-tailed deer.
- Plots were clipped in early spring before clover became well established, and therefore results underestimate biomass produced in subsequent months of the growing season.
- Cages may have created shade and inhibited photosynthesis of caged plants.
- Grazing can increase or decrease plant production (e.g., Brody & Irwin, 2012). Low grazing pressure may increase nutrient cycling resulting in an increase in plant growth. Heavy grazing pressure can reduce plant growth and result in plant mortality.
- The plant species in control plots were not recorded except in one trial season. Many species were found both inside and outside cages. Of the few found only inside or outside, we were unable to discern whether grazing, seed distribution in the soil, soil condition, or some other factor caused the difference.
Discussion
As Dunifon et al. (2004) noted, “In an age where information overload is a significant concern, it is often difficult for practitioners to distinguish legitimate science claims from pseudo-science” (p. 2). Contrary to food plot marketers and hunter expectations, evidence from these demonstration trials indicated a substantial amount of grazing occurred in control plots where natural vegetation grew.
- Evidence of grazing was numerically and statistically significant in control plots.
- Grazing in control plots was less than in Biologic Full Draw/Arkansas mix plots but more than in Rackmaster Supreme Fall/wheat and Durana clover mix plots;
- The difference between grazing in Biologic Full Draw plots (2298.89 kg/ha; 2052.63 lbs/acre) and control plots (1807.76 kg/ha; 1612.34 lbs/acre) was less than 450 pounds of forage per acre (491.13 kg/ha; 440.29 pounds per acre).
By conducting food plot demonstration trials, county agents and other Extension professionals are building scientific evidence which questions the value of planting food plots compared to practices which encourage native vegetation. The message to hunters is “why plant seeds when you can grow weeds?” Considering costs for seed, equipment, fuel and labor, and the potential for crop failure (36 percent in these trials), “native” food plots appear a viable option. Even food plots that fail to germinate are likely to grow natural vegetation which will be grazed. We speculate soil amendments and/or disking contributed to grazing in control plots compared to surrounding native vegetation. Practices that could have been implemented to further encourage native plants, given the same inputs as in traditional food plots, were not considered.
Hunters continue asking Extension professionals for advice (i.e., public demand) about food plots, despite results from these demonstration trials. Discussions with hunters could focus on how simply establishing food plots does not address the complexity associated with habitat quality, deer health and antler growth. Some agricultural and wildlife professionals speculate hunters prefer food plots because they seek a hands-on activity that has a visible, relatively immediate reward of plant growth and is observably attractive to wildlife. Native vegetation management practices, such as disking or establishing native warm-season grasses, do not have the immediacy of establishment, visual appeal, or wildlife attraction relative to surrounding area. Can we reverse acceptance of traditional food plots and revert to growing weeds and acorns, i.e., “native” food plots? Because of considerable mass marketing and hunter expectations, it is doubtful this message will be well received, but should be given, if only as a gateway for discussing native vegetation management.
Anecdotal evidence indicates practices which establish native plants may gain traction locally. In 2012 a landowner announced at a University of Arkansas Cooperative Extension Service workshop that prescribed fire yielded more benefits and produced more vegetation on his land than his food plot for white-tailed deer. But despite this statement, even he still plants a food plot near his deer hunting stand.
Disclaimer
The mention of any commercial product does not imply its endorsement by the University of Arkansas Division of Agriculture or the Journal of NACAA over other products not named, nor does the omission imply that they are not satisfactory.
Acknowledgments
Many University of Arkansas county agents and professional staff contributed to these demonstration trials. County agents who performed these trials in cooperation with private landowners were Gerald Alexander (retired), Mike Andrews, Allan Beuerman (retired), Michelle Buchanan, Jesse Clark (retired), Jerry Clemons, Mitch Crow, Robert Goodson, Johnny Gunsalis, Bobby Hall, Brian Haller, Rex Herring, Wes Kirkpatrick, Kevin Lawson, Matt Lane, Keith Martin, Ron Matlock, Brad McGinley, Shawn Payne, Doug Petty (retired), Keith Perkins, Shaun Rhoades, Jaret Rushing, Susan Scott, Steven Sheets, Larry Smith (retired), Rebecca Thomas, Carla Vaught, and Les Walz. Chris Stuhlinger, University of Arkansas System Forest Manager, coordinated several demonstration trials at the Pine Tree Research Station and the Forestry and Livestock Research Station. Dr. Vic Ford, Dr. Terry Kirkpatrick and J.D. Barham at the Southwest Research and Extension Center (SWREC) provided food plot sites and use of their plant drier and laboratory scales. Dr. John Jennings, University of Arkansas Cooperative Extension Service (UACES) Animal Science forage specialist, provided consultations on plant material selection and establishment, and use of a plant drier. Arkansas Forest Resources Center (AFRC) faculty provided valuable insights, in particular Dr. Don White, Dr. Hal Liechty, Dr. Kyle Cunningham, and Dr. Jon Barry. Dr. Terry Kirkpatrick (SWREC), Quinton Hornsby (retired, UACES), Tom Riley (UACES, retired), Dr. Mike Daniels (UACES), Dr. Phil Tappe (AFRC) and Rex Roberg (AFRC) contributed to protocol development and/or administrative support. Southern Region Sustainable Agriculture Research and Extension program and Dr. Tony Windham (UACES) funded early efforts of this study. Joel Reagan, Pennington Seed Company, donated seed for the fall 2004 demonstration trials.
References
Brody, A. K. & Irwin, R. E. (2012). When resources don't rescue: flowering phenology and species interactions affect compensation to herbivory in Ipomopsis aggregata. Oikos, 121 (9), 1424 – 1434.
Brown, R. D. & Cooper, S. M. (2006). The nutritional, ecological and ethical arguments against baiting and feeding white-tailed deer. Wildlife Society Bulletin 34(2):519-524.
Dunifon, R., Duttweiler, M., Pillemer, K., Tobias, D., & Trochim, W. M. K. (2004). Evidence-based extension. Journal of Extension [On-line], 42(2) Article 2FEA2. Retrieved from http://www.joe.org/joe/2012october/a2.php
Leopold, A. (1933). Game management. New York, NY:Charles Scribner’s Sons.
McPeake, B., Alexander, G., J.D. Barham, J. D., Crow, M., Dinstel, C., Hall, B. Herring, R., Hornsby, Q., Jennings, J., Kirkpatrick, T., Kirkpatrick, W., Lawson, K., Riley, F., Roberg, R., Sheets, S., Smith, L., Stuhlinger, C., Tappe, P. & Walz, L. (2004). Protocol for wildlife food plot demonstration experiments. Pages 26 – 32 in 2004 Arkansas Forestry Symposium, Little Rock, AR. Retrieved from http://www.afrc.uamont.edu/symposium/Proceedings/2004%20Arkansas%20Forestry%20Symposium.pdf
Miller, Karl V. & R. Larry Marchinton (eds.) (1995). Quality whitetails: the why and how of quality deer management. Mechanicsburg, PA: Stackpole Books.
SAS. (2002). SAS 9.2 Help and Documentation. Cary, NC: SAS Institute, Inc.
Steel, R.G. D. & Torrie, J. H. (1980). Principles and procedures of statistics: A biometricial approach. New York, NY: McGraw-Hill Book Company.