Journal of the NACAA
ISSN 2158-9429
Volume 7, Issue 2 - December, 2014
Identifying the Factors Affecting Ohio Farmers’ Quality of Life
- Windon, S. R., Graduate Teaching Associate, The Ohio State University
Jepsen, S. D., Associate Professor, The Ohio State University
Scheer, S. D., Professor, The Ohio State University
ABSTRACT
The term “quality of life” is a multi-dimensional concept that creates a challenge for categorical assessment and measurement, especially when investigating a dynamic agriculture lifestyle. This exploratory study utilized a 34-item questionnaire to identify factors that affected the quality of life of 400 Ohio farmers. These farmers reported they experienced stress less than two days a week (48.6%) with the majority (95%) indicating they had a positive outlook on life. Overwhelmingly, 99.0% reported satisfaction with their overall quality of life. On a scale of Negative-Effect, No-Effect, and Positive-Effect farmers rated 12 external factors as having more negative effects on their quality of life, with such factors including input costs, financial pressures, and cost of agricultural equipment. Ohio farmers reported they were overall satisfied with their social activities (97.9%), the emotional support they received from family members (95.7%), their farm work during the busiest season (96.0%), their overall health status (94.5%), and the hours they work during the busiest season (91.4%). However they were not as satisfied with the hours of sleep they received in their busy season (19.2%), their management of farm work with family life in their busy season (13.6%), nor the amount of annual vacation time (11.4%). Findings of this study may be helpful for stakeholders to better understand farmers’ needs and provide appropriate educational and financial assistance programs to enhance their agricultural life.
Introduction
The multi-dimensional concept of “quality of life” refers to an individual’s overall well-being on a variety of subjective and objective domains. While these domains have been identified and studied in several contexts, researchers often differ in their interpretation of the exact relationship between these constructs. Several studies suggest quality of life is a broader category than well-being (McCoy and Filson,1996; Schuessler and Fisher, 1985). These researchers contend it integrates life satisfaction, happiness, socio-economical, and environmental factors. However research from Andrews and Withey (1976), Allardt (1993), and Molnar (1985) suggest no distinction between quality of life and well-being as reflected by a person’s feelings. A research team of Zullig, Ward, and Horn (2006) defines the term “quality of life” as an overall sense of well-being including satisfaction and happiness aspects.
The concept of measuring and assessing quality of life was a popular research topic in the health and social science disciplines in the 20th century. Despite the surge for new knowledge in this domain, no unified measurement instrument was established and replicated with consistency across multiple population groups. Likewise, no congruent or accepted theory emerged for this grand construct. The most helpful recommendation was given by McCoy and Filson (1996), whereby they stated that quality of life measurements must depend on the standards set by the research team.
According to the World Health Organization, quality of life is “an individual’s perception of their position in life in the context of the culture and value system in which they live and in relations to their goals, expectation, standards, and concerns” (WHOQOL-Group 1997: p.1). The construct of quality of life has elicited discussion in multiple contexts in that it addresses both the objective and subjective conditions affecting a person’s daily life.
Subjective health related well-being was associated with health status, psychological well-being, and life satisfaction in a study by Aycan and Eskin (2005). In Diener’s (1999) study, subjective health status depended on the individuals’ perception and was influenced by personality and emotional characteristics. Gabriel and Bowling (2004) associated an overall ‘good health status’ with higher reported quality of life and well-being measurements. Andrews & Robinson (1991) research included a cognitive component, concluding that mental health status needed to be taken into consideration to measure quality of life or subjective well-being.
Work environmental characteristics associated with job satisfaction and subjective well-being was found in several studies, suggesting a relationship between quality of life and quality of work (Campbell et al., 1976; Warr, 1994; Clark, 2010). An early study by Cooper and Marshall (1978) identified six categories of occupational stress related to a person’s working conditions, role in the organization, relationship at work, career development, organizational structure, and home-work interface.
Quality of Life Application to Farmers
There are several applications where quality of life (QOL) research included farmers. Such research started to appear in the literature between the 1970-1980’s time period. Sporadic studies have emerged since then, however limited in their focus or type of farmer studied. Additional research findings are presented here as they relate to farmers’ subjective well-being, farming system, economic well-being, occupational stress and health, socio-demographic factors, and farm structure.
Changes in the U.S. economic situation in rural areas have had significant consequences for the farmers’ quality of life over the years. In an early article by Dillman and Tremblay (1977), “…People are beginning to act on their preferences in ways that would suggest they are looking to rural America as a way of improving their quality of life” (p.117). Nitsch (1987) suggested the farm life provides values and qualities such as autonomy, closeness to nature, tradition and continuity.
Molnar (1985) reported that subjective well-being had a strong association to farm size, income, and off-farm work status categories. Farmers with a larger family income and older farmers indicated higher levels of subjective well-being. Farmers’ age had a positive relationship with quality of life and life experience; however age had a negative relationship with expectation for future quality of life. Furthermore, Molnar’s work identified individual characteristics being more important determinants of subjective well-being than farm structure. A wife’s off-farm work status was not associated with well-being.
Brooks, Bailey and Stucker (1986) studied income and the well-being of farmers. Researchers stated that farmers’ well-being increased with larger farm size and income. They found that the farmer’s view on agriculture’s future had the biggest impact on his personal well-being and his perceptions about non-economic factors. Findings suggest a part-time job increased well-being because of its direct effect to reduce financial pressure and increase overall family income.
Stress was an identified factor in several research studies. A study by Duncan, Lewis and Volk (1988) indicated that farm life had potential for developing stress due to decreased income and high debt ratio. Walker and Walker (1987) reported that relationship issues and farm work (especially during the busy season) were major stress factors for farmers. Ramesh & Madhavi (2009) specifically analyzed occupational stress among 200 farmers from four villages in India. Their research found the weather, work overload, farm hassles, financial situation, and social interaction led to increased stress. They concluded that financial factors possessed the highest influence on human’s stress.
Research by Melberg (2003) found that the freedom in the workplace had a positive influence on farmers’ well-being. He reported that “farm people are particularly resistant to distress” (p.70). The farming lifestyle brings positive aspects to mental health, factors of freedom, independence and fresh air as important aspects of farmers’ quality of life.
Coughenour and Swanson (1988) reported “satisfaction with farm work is an important component in satisfaction with farm life” (p. 457). Findings revealed relatively high satisfaction with farming in that 78% were “very satisfied” and “somewhat satisfied” with farming and only 3% were dissatisfied. These researchers concluded that economic and non-economic rewards from farming contribute significantly to satisfaction with farm work.
Garrison (1988) examined a series of socioeconomic-demographic factors for the quality of life of rural families. This study used five indicators: home, family and friends, household, finances, community, and environment. She found gender, age, marital status, employment status, family income, and residence had differing affects on the quality of life indicators.
The lack of a unified definition for “farmer’s quality of life” creates a challenge for categorical assessment and measurement. This exploratory study elicited farmers to identify factors they perceived important to their quality of life. Factors were based on the vast span of literature to provide health-related indicators, work-related factors, environmental or external forces, social and family-related support. This overall relationship between a farmer’s quality of life and his or her subjective indicators are provided in Figure 1. (Windon, 2014) This study set out to identify descriptors within these fields.
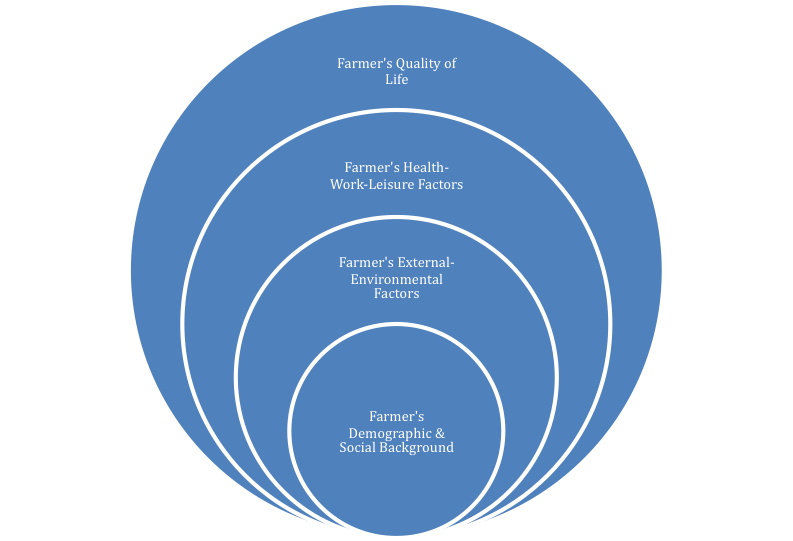
Figure 1. Conceptual model of relationship between farmer’s environmental-external factors, health-work-leisure factors and quality of farmer’s life. (Windon, 2014)
Purpose and Objectives
Ohio farmers were studied to examine various factors that affect their quality of life. Four research objectives guided the study.
- Describe the farmers according to selected social-demographic characteristics, outlook on life, disability and other health issues, and experience of stress;
- Describe external-environmental factors as related to farmers ‘quality of life;
- Describe health-work-leisure factors as related to farmers’ quality of life;
- Explore differences in farmers’ overall quality of life based on their demographic characteristics and social factors; external-environmental factors; and health-work-leisure factors.
Method
Using a quantitative approach, the study was designed to explore which factors affected the quality of life of Ohio farmers; and examined the differences between the subjective and self-rated quality of life based on their social-demographic characteristics, external-environmental factors and health-work-leisure factors.
A 34-item survey instrument was developed for participants to reflect on a 12-month period, taking into account all seasons of their production schedule. The instrument was pilot tested during a 3-day farm trade show, with an attendance rate of nearly 150,000 farmers. The total number of participants in the pilot test was 30 individuals who were randomly selected as they walked the exhibit grounds. Reliability coefficients were calculated for each section of this instrument whereby the construct “External-Environmental Factors” measured 0.73 and the construct “Health-Work-Leisure Factors” was 0.73.
The survey was administered to a convenient sample of 400 Ohio farmers attending various educational programs offered by OSU Extension educators and farmers’ event between December 2, 2013 and January 28, 2014. These events included: the Ohio Farm Bureau’s 2-day annual meeting (December 4, 2013); the Ohio No-Till farm conference in Plain City, Ohio (December 11, 2013); the Shearer Equipment Exhibition in Wooster, Ohio (January 28, 2014), and five educational sessions provided by Ohio AgrAbility staff during December 2013. All participants were over the age of 18.
During these statewide sessions, the researcher provided a recruitment flyer, read the script to the farmers about the study objectives and the opportunity to participate. Participants were not coerced to complete the paper-and-pencil survey. Participants had the opportunity to refuse participation or withdraw at any time without penalty; they were also told they could skip questions they were uncomfortable in answering at any time without repercussion. Respondents took approximately 7-15 minutes to complete the questionnaire.
The SPSS program (version 20) was used for data analysis. The research design was approved through the Ohio State University’s institutional review board process.
Results
This study was conducted as explanatory research resulting in descriptive data. The findings are presented according to the four research objectives.
Research Objective 1: Describe the farmers according to selected social-demographic characteristics, outlook on life, disability and other health issues, and experience of stress. The sample represented a group of farmers in which, 82.8% were males and 50% were older than 55 years old. Almost 75% had more than 180 acres of land. Their agricultural commodities included field crops, livestock, milk and milk products, poultry and poultry products, and fresh vegetables.
Over 60% of respondents considered agriculture as their main occupation, with another 23.6% reporting their farm employment status as a part-time job. On average, 78.3% of these farmers worked approximately 9-15 hours/day in their busiest season; with their busiest season averaging three to eight months. Almost 40% of the sampled farmers earned $50,000 net cash income in year, and 46.8% of farmers earned between $10,000 - $50,000.
Farmers were asked to rate their outlook on life as generally being positive or negative. Over 95% of the farmers rated themselves with a positive outlook on life. They were also asked the number of days they experienced stress during the week. The most prominent answer was the fewest number days, 1-2 days a week (48.6%). Only 3% of the sample reported feeling stress all 7 days of the week (3.0%). See Table 1.
| Demographic factors | Ohio Farmers | ||||
|---|---|---|---|---|---|
| Frequency | Percent | ||||
| Outlook on life |
|
376 |
|
||
| Negative outlook most of the time | 18 | 4.6 | |||
| Total | 394 |
100.0 |
|||
| Disability and health issues | No | 202 | 50.4 | ||
| Yes | 194 | 49.6 | |||
| Total | 396 |
100 |
|||
| Stress | 1-2 days a week | 192 | 48.6 | ||
| 3-4 days a week | 115 | 29.1 | |||
| 5-6 days a week | 27 | 6.8 | |||
| All days a week | 12 | 3.0 | |||
| I do not know | 49 |
|
|||
| Total | 395 | 100 | |||
Research Objective 2: Describe external-environmental factors as related to farmers’ quality of life. Farmers were asked to rate 13 items as they affected their quality of life in the last year. The scale ranged from “Negative effect” to “Positive effect”, with the opportunity to select ‘No effect’ if applicable.
|
External-Environmental Factors |
% Ohio Farmers Reporting Their Effects (n=400) | ||
| Negative effect | No effect | Positive effect | |
|
Weather conditions |
47.9 |
12.1 |
40.0 |
|
Machinery breakdowns |
48.6 |
23.6 |
27.8 |
| Diseases (animal and plant) |
45.6 |
34.2 |
20.2 |
| Market price for agricultural products |
47.2 |
26.1 |
26.7 |
| Costs for agricultural equipment |
52.9 |
28.3 |
18.8 |
| Input costs |
58.3 |
23.4 |
18.3 |
|
Time management skills |
46.9 |
24.6 |
28.5 |
| Financial pressure |
54.9 |
23.6 |
21.5 |
| Government regulations |
52.2 |
29.8 |
18.0 |
| Eligibility for government programs |
44.5 |
35.9 |
19.6 |
| OHSA regulations |
45.3 |
38.9 |
15.8 |
| EPA regulations |
51.8 |
34.0 |
14.2 |
Farmers rated all external-environmental factors as having a “negative effect” on their quality of life. The factors with the highest effects included input costs (58.3%), financial pressures (54.9%), and cost of agricultural equipment (52.9%). The factor rated the highest for having a “positive effect” was the weather (40.0%). The results indicated OSHA regulations (38.9%) and eligibility for government programs (35.9%) had the highest rating for “no effect” on the farmers’ quality of life. See Table 2.
Research Objective 3: Describe Health-Work-Leisure factors as related to farmers’ quality. Farmers were asked to determine their satisfaction with nine items. The 5-point Likert scale ranged from “Completely Satisfied” to “Not at all satisfied.” Researchers recoded the data into a 3-point scale for purpose of reporting ease, as it was not necessary to understand the degree of their satisfaction. Responses “Completely and Very Satisfied” were combined to report as “Satisfied;” responses of “Not and Not at all Satisfied” were combined to report as “Not Satisfied.” The neutral response “Somewhat Satisfied” was not changed.
Results were tabulated, reporting farmers were “Satisfied” or “Somewhat Satisfied” with their social activities (97.9%), the emotional support they received from family members (95.7%), their farm work during the busiest season (96.0%), their overall health status (94.5%), and the hours they work during the busiest season (91.4%). However they were not as satisfied with the hours of sleep they received in their busy season (19.2%), their management of farm work with family life in their busy season (13.6%), nor the amount of annual vacation time (11.4%). Overwhelmingly, 99% of the farmers surveyed reported satisfaction with their overall quality of life. See Table 3.
| Health –Work-Leisure Factors | % Ohio Farmers Reporting Their Satisfaction (n=400) | ||
| Satisfied | Somewhat satisfied | Not satisfied | |
| Overall health |
56.8 |
37.7 |
5.5 |
| Farm work in busy season |
55.4 |
40.6 |
4.0 |
| Work hours in busy season |
46.1 |
45.3 |
8.6 |
| Hours of sleep in busy season |
38.5 |
42.3 |
19.2 |
| Managing both farm work and family in busy season |
43.2 |
43.2 |
13.6 |
| Received time for vacation or days off during the last year |
56.7 |
31.9 |
11.4 |
| Social activities |
68.1 |
28.1 |
3.8 |
| Emotional support |
69.8 |
25.9 |
4.3 |
| Overall quality of life |
77.5 |
21.5 |
1.0 |
Research Objective 4: Explore differences in farmers’ overall quality of life based on their demographic characteristics and social factors, external-environmental factors, and health-work-leisure factors. The Pearson chi-square test was used to explore the differences in overall quality of life of Ohio farmers based on 10 social-demographic factors, 13 external-environmental factors, and 8 health-work-leisure factors. Through this analysis, only 11 statistically significant factors (from 32 factors) were associated with farmers’ overall quality of life. These factors included gender, disability and health issues, stress, overall health, farm work, work hours, hours of sleep, managing family and farm, time for vacation, social activities and emotional support. These factors are presented in Table 4.
There were notable elements about these results. The females in this study were less likely to be satisfied with their overall quality of life. And of all participants sampled, 49.6% disclosed having health-related issues affecting their daily lives, with these ailments being back pain, high blood pressure, diabetes and heart problems. This study did not find a significant relationship between Ohio farmers quality of life and their age, type of employment, farm size, number of hours worked in the busy season, income, outlook on life, and any of the 12 external-environmental factors (government agencies regulation, financial pressure, market price for agricultural products, etc.).
|
Factors |
valid cases |
X² |
df |
P* |
| Social-Demographic Factors | ||||
|
Gender |
394 |
10.446 |
2 |
.005 |
|
Disabilities or health issues |
395 |
7.105 |
2 |
.029 |
|
Stress |
393 |
18.550 |
4 |
.001 |
| External-Environmental Factors | ||||
|
None with associations |
||||
| Health-Work-Leisure Factors | ||||
|
Health |
395 |
57.837 |
4 |
.000 |
|
Farm work |
394 |
38.090 |
4 |
.000 |
|
Work hours in busy season |
394 |
35.250 |
4 |
.000 |
|
Hours sleep |
394 |
30.778 |
4 |
.000 |
|
Managing family and farm |
394 |
51.069 |
4 |
.000 |
|
Time for vacation |
393 |
73.651 |
4 |
.000 |
|
Social activities |
395 |
123.199 |
4 |
.000 |
|
Emotional support |
395 |
143.934 |
4 |
.000 |
*p < .05
Discussion
Previous quality of life research has been conducted in a variety of academic disciplines. This study identified important quality of life domains such as external-environmental and health-work-leisure factors, as related to the occupation of farming. Results of this study can be used as a baseline for larger population-based research and replicated in other geographic regions.
The Pearson chi-square test revealed 11 significant associations that affected Ohio farmers’ quality of life. Many of these same variables have appeared in other QOL studies and generate additional discussion. These factors include: gender, disabilities or health issues, stress, farm work, work hours, hours of sleep, health, time for vacation, managing family and farm, social activities and emotional support.
The findings of this research support several studies whereby one’s gender was a significant determinant in self-reporting one’s quality of life. Overall, women were less satisfied with their overall quality of life than men (Garrison’s, 1998). They experienced stronger emotions (both positive or negative) than men (Nolen-Hoeksema & Rusting, 2003), and reported higher well-being than their male counterparts (Diener, Suh, Lucas and Smith, 1999).
Keating, Munro, and Doherty (1988) emphasized that conflict in a farmers’ life was associated with the limited amount of time for farm work, or off-farm employment, especially during the busy seasons. Long working hours and work overload may cause family conflict, however flexible work hours provide better integration between family life and work and positively affect individual’s quality of life (Gutek, Searle and Klepa, 1991) The Ohio study found that the majority of farmers were satisfied with farm work in the busiest season, however they were not satisfied how they managed their family and farm during busy season.
Danna & Griffin (1999) found that stress has a significant association with low well-being and individual’s health. Melberg (2003) studied farming, stress, and psychological well-being and found that strong relationship between stress, social support and well-being. The Ohio research is supported by these previous studies in that results indicated that stress has a significant association with overall quality of farmers’ life.
Argyle (1996) found that specific type of leisure may improve individual’s physical and mental health and well-being, also helping develop social relations. The Ohio study disclosed similar findings in that farmers were satisfied with their emotional support and social activities as they were positively associated with their overall quality of life.
The Ohio study found no association between farm size and farmers’ quality of life. This was different for Goldschmidt (1978) where a relationship was found between farm size, farm structure and quality of life in rural areas. Goldschmidt’s research results defined a higher index of quality of life among rural communities when farms were medium sized.
Ohio farmers reported 12 external-environmental factors had negative effects on their quality of life. The five factors with the highest negative effects were input costs, financial pressures, costs for agricultural equipment, government agencies’ and EPA regulations. While these factors may be important to their economic well-being, they were not found to have a significant association to Ohio farmer’s overall quality of life. The factors that did have association were their farm work in the busy season, the number of hours worked in the busy season, hours of sleep received in the busy season, overall health, and time for vacation and/or adequate days off throughout the year. It was not clear to the researchers why several factors were identified as having a positive effect without further qualitative investigation.
Implications
Cooperative Extension Systems, farm associations and rural organizations with farmer memberships, can contribute to farmers’ personal development. These groups have an opportunity to provide emotional and peer support, and develop programs where farmers identify needs.
Based on information gained in this research, farmers could benefit from programs focused on stress management, women’s satisfaction with life, balancing work and family life, time management, and overall health information including the importance of sleep. These topics are not mainstream programs offered to the agricultural producers in Ohio. In fact, many of the traditional topics popular with Ohio farmers are those based on production and financial concerns. While it is important for agencies to conduct programs for farmers to be informed of current legislation, their eligibility for government programs and information regarding regulations, these topics are not those reported having significant impact on their overall quality of life. Educational sessions to address farmers’ quality of life may be potential programs for Family Consumer Science educators or professionals within public health organizations.
Recognizing and quantifying Ohio farmers’ perceptions is an important aspect for improving life in rural areas. Collectively working together to understand the results of this study, and their implications to agricultural occupations, can positively influence farmers’ satisfaction with their overall quality of life.
Acknowledgements
The USDA National Institute of Food and Agriculture funded this project through its support of the Ohio AgrAbility Program (#2013-41590-21409).
Citations
Allardt, E. (1993). ‘Having, loving, being: An alternative to the Swedish model of welfare research’. In M. Nussbaum, A. Sen (Eds.) The quality of life (88-95). Oxford: Clarendon Press.
Andrews, F. M., & Robinson, J. P. (1991). Measures of subjective well-being. In J. P. Robinson, P. R. Shaver, & L. S. Wrightsman (Eds.), Measures of personality and social psychological attitudes (pp. 61-114). San Diego, CA: Academic Press.
Andrews, F.M., & Withey, S.B. (1976). Social indicators of well-being: American’s perceptions of life quality. New York, NY: Plenum Press.
Argyle, M. (1996). Subjective well-being. In pursuit of the quality of life, 18-45.
Aycan, Z., & Eskin, M. (2005). Childcare, spousal, and organizational support in predicting work-family conflict for females and males in dual-earner families with preschool children. Sex Roles, 53(7), 453-471.
Brooks, N. L., Bailey, J. A., & Stucker, T. A. (1986). Income and well-being of farmers and the farm financial crisis. Rural Sociology, 51(4), 391-405.
Byars, L.F. & Dhopper, S.S. (1991). Life satisfaction of rural woman. Human Services in the Rural Environment 14(3), pp.12-16.
Campbell, A., Converse, P.E., & Rodger, W.L. (1976). The quality of American life: perceptions, evaluations, and satisfactions. New York. NY: Russell Sage Foundation.
Clark, A. E. (2010). Work, jobs and well-being across the Millennium. International differences in well-being, 436-468.
Coughenour, C. M., & Swanson, L. E. (1988). Rewards, values, and satisfaction with farm work. Rural sociology (USA).
Cooper, C. L., & Marshall, J. (1978). Understanding executive stress. London: Macmillan.
Danna, K., & Griffin, R. W. (1999). Health and well-being in the workplace: A review and synthesis of the literature. Journal of Management, 25(3), 357-384.
Diener, E., Suh, E. M., Lucas, R. E., & Smith, H. L. (1999). Subjective well-being: Three decades of progress. Psychological Bulletin, 125(2), 276.
Dillman D.A., &Tremblay K.R. (1977) The quality of life in rural America. Annals of the American academy of political and social science. In the New Rural America, 429, 115-129.
Duncan, S. F., Lewis, R. A., & Volk, R. J. (1988). The influence of financial stressors upon farm husbands and wives' well-being and family life satisfaction. In R. Marotz-Baden, C.B. Hennon, & T.H. Burbaker (Eds.), Families in rural America: stress, adaptation and revitalization. St. Paul, Minnesota: National Council on Family Relations, (32-39).
Gabriel, Z. & Bowling, A. (2004). Quality of life from the perspectives of older people. Ageing and Society, 24(5), 675-691.
Garrison, M. B. (1998). Determinants of the quality of life of rural families. Journal of Rural Health, 14(2), 146-153.
Goldschmidt, W. W. (1978). Large scale farming and the rural social structure. Rural Sociology, (3), 362-366.
Gutek, B. A., Searle, S., & Klepa, L. (1991). Rational versus gender role explanations for work-family conflict. Journal of Applied Psychology, 76(4), 560.
Keating, N. N., Doherty, M. M., & Munro, B. B. (1988). Psychosomatic stress among farm men and women. In R. Marotz-Baden, C.B. Hennon, & T.H. Brubaker (Eds.). Families in rural America: stress, adaptation and revitalization. 64-73. St. Paul, Minn.: National Council on Family Relations.
McCoy, M., & Filson, G. (1996). Working off the farm: Impacts on quality of life. Social Indicators Research, 37(2), 149-163.
Melberg, K. (2003). Farming, Stress and Psychological Well–being: The Case of Norwegian Farm Spouses. Sociologia Ruralis, 43(1), 56-76.
Molnar, J. J. (1985). Determinants of subjective well-being among farm operators: characteristics of the individual and the firm. Rural Sociology, 50(2), 141-162.
Nitsch, U. U. (1987). A persistent culture: some reflections on Swedish family farming. B. Galeski & E. Wilkening (Eds.), Family farming in Europe and America. 95-115. Boulder: Westview Press.
Nolen-Hoeksema, S., & Rusting, C. L. (2003). 17 Gender Differences in Well-Being. Well-Being: Foundations of Hedonic Psychology, 330.
Office of Management and Budget (2014). North American Industry Classification System. Federal Register, Vol. 79 No. 99, May 22, 2014.
Ramesh, A.S. & Madhavi, C. (2009). Occupational stress among farming people. The Journal of Agricultural Sciences, 4(3)115-125.
Schuessler, K. F., & Fisher, G. A. (1985). Quality of life research and sociology. Annual Review of Sociology, 129-149.of Cincinnati).
Walker, L. S., & Walker, J. L. (1987). Stressors and symptoms predictive of distress in farmers. Family Relations, 374-378.
Warr, P. (1994). A conceptual framework for the study of work and mental health. Work & Stress, 8(2), 84-97.
WHOQOL. Measuring quality of life. (1997). World Health Organization, Geneva, Switzerland. Retrieved from http://www.who.int/mental_health/media/68.pdf
Windon, S. (2014). Assessing Ohio farmers: Determining factors that affect their quality of life. Unpublished Master Thesis. The Ohio State University.
Zullig, K. J., Ward, R. M., & Horn, T. (2006). The association between perceived spirituality, religiosity, and life satisfaction: The mediating role of self-rated health. Social Indicators Research, 79(2), 255-274.