Journal of the NACAA
ISSN 2158-9429
Volume 7, Issue 2 - December, 2014
Potential Impact of Washington State Alfalfa Variety Testing from 1990 to 2013
- Norberg, S., Extension Educator, Washington State University
ABSTRACT
The impact of 37 irrigated alfalfa variety trials spanning from 1990 to 2013 in Washington State was determined by using average potential benefit in yield (APBy), the difference between the mean yield of the top three commercially available varieties and the trial mean and the maximum potential benefit in yield (MPBy), the difference between top to bottom yielding. The average and maximum potential benefit economically for Washington State per year (APBesy) and (MPBesy) was $12.4 and $42.5 million per year and accumulated over years, $273.7 million and $941.2 million in Washington State, respectively. Currently, 52% of the producers make decisions from these trials for a best estimate of impact of $5.0 million per year.
Introduction
Hay production is the fifth largest economic agriculture commodity in the State of Washington (Washington State Department of Agriculture, 2014). Hay is also vital to the production of the fourth largest commodity, milk, and the sixth largest, cattle and calves. It is very difficult without properly conducted alfalfa variety trials by a Land Grant University (LGU) for producers to make an informed alfalfa variety decision. Without these independent, third party trials, alfalfa producers have little or no published randomized, replicated results when comparing varieties. In 2014, there are at least 88 registered fall dormancy 4 alfalfa varieties marketed, as well as 32 fall dormancy 5 varieties for farmers to choose from (National Alfalfa and Forage Alliance. 2014.). No yield data are available except by commercial breeding or seed sales companies. Seed companies likely have variety results for their own materials but may not include many competitor varieties in a trial. Companies conducting trials may or may not have randomized or replicated trial entries, which are required for analysis of variance to separate true genetic differences, or those results may not be publicly released. Putnam et al. (2010) found in California from 1974 through 2009, as a percent of the mean of each trial and weighted by the state-wide production, maximum alfalfa varietal differences were 2.7 tons per acre, or 30% of the average production in variety trials. Putnam also found the maximum potential yield differences due to variety are worth an estimated $320 million in California each year and yield differences were economically much more important than seed cost. In 1996, an economic evaluation of the yield advantages of improved varieties was published showing that a 5% increase in yield would result in an increase in profit under a wide range of hay and seed costs (Hewlett, et. al., 1996).
Extension program funding decisions are made at the college and university levels in the LGU system. This paper quantifies the impact of what is now known as, “Washington State Hay Growers Association (WSHGA) and Washington State University (WSU) Extension’s Irrigated Alfalfa Variety Trials” upon hay production value. These Washington trials originated at the WSU Irrigated Research and Experiment Station located at Prosser, WA, with some of the earliest reported alfalfa variety results in the 1950’s (Van Keuren, 1954). This paper addresses the impact of long-term alfalfa variety investigations from 1990 to the present, with the most recent annual report published in 2013 (Norberg, 2013).
Alfalfa producers in Washington State typically replace their alfalfa every three years on their farms due to decreased productivity and typically do not use genetically modified seed due to lack of export market acceptance. Variety performance (yield, pest resistance, quality, persistence) is economically much more important than seed cost between varieties (Putnam et al., 2010).
The objective of this paper is to determine the potential benefit of these 37 accomplished, unique trials that span the last 24 years, and determine the producer’s usage of the information of the last two years. The potential benefit is broken down in average potential benefit (APB) and maximum potential benefit (MPB).
Methods
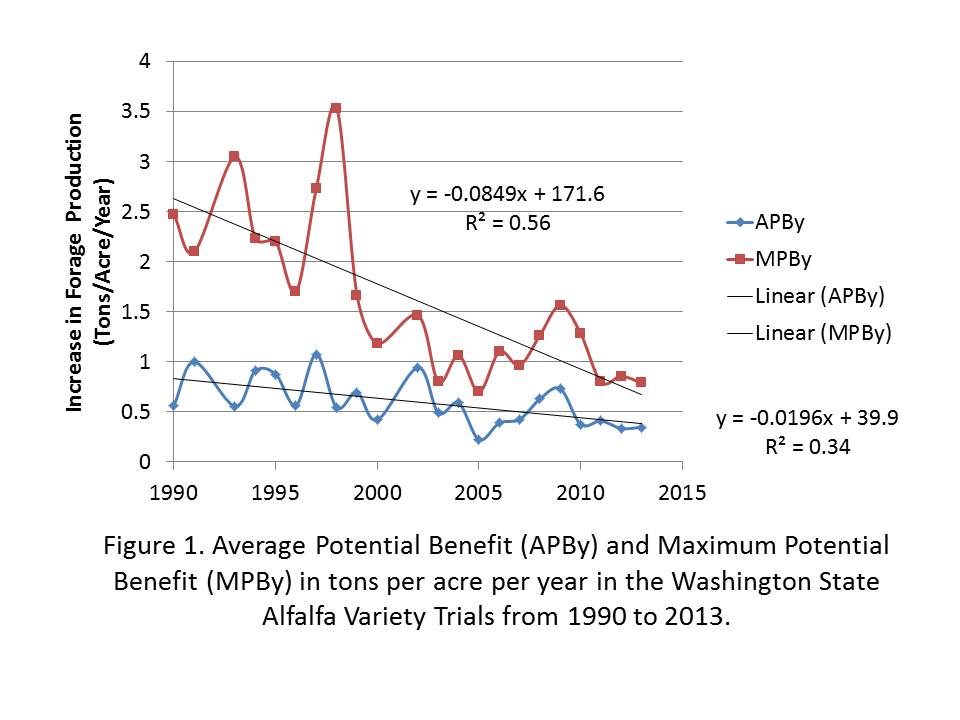
Currently, private companies submit seed to the trial with an entry fee to the WSHGA and WSU Extension conducts the experiments. Each trial was planted in the fall and three production years were measured and reported. Currently at least one new trial is started each year at the Pasco and Othello locations. Alfalfa yield results from reports published from 1990 to 2013, for 37 separate trials were used in this analysis and mean yields are given in Table 1. Each trial was conducted for at least three harvest years. Accumulated yields from the three years were taken, divided by the number of years the trial was conducted to get an average annual yield, and used to determine alfalfa variety yield differences within year. If a trial was completed on more than one location in a given year the average results were used. The difference between the mean of the top three commercially available varieties (representing the university recommendation) in the test compared to mean of all the varieties in the study (representing the producers randomly selecting a variety with little to no yield data) and is called average potential benefit (APBy). Also, the difference between top to bottom varieties represented a best case individual farm decision called maximum potential benefit (MPBy).
Table 1. Average three year irrigated yield results for Othello, Pasco, and Prosser by year and the number of varieties in the test.
|
Othello |
Pasco |
Prosser2 |
||||
|
Year1 |
# entries |
Avg. Yield |
# entries |
Avg. Yield |
# entries |
Avg. Yield |
|
tons/acre |
tons/acre |
tons/acre |
||||
|
1990 |
19 |
7.78 |
||||
|
1990 |
12 |
7.07 |
||||
|
1991 |
15 |
7.10 |
||||
|
1992 |
||||||
|
1993 |
26 |
8.30 |
||||
|
1994 |
15 |
9.83 |
||||
|
1995 |
18 |
7.83 |
||||
|
1996 |
11 |
8.83 |
||||
|
1997 |
32 |
8.67 |
||||
|
1998 |
17 |
7.00 |
||||
|
1999 |
33 |
7.63 |
33 |
8.73 |
46 |
6.87 |
|
2000 |
21 |
7.87 |
20 |
9.50 |
||
|
2001 |
||||||
|
2002 |
18 |
10.20 |
||||
|
2003 |
21 |
8.30 |
24 |
8.97 |
||
|
2004 |
25 |
6.90 |
21 |
7.87 |
||
|
2005 |
14 |
7.47 |
12 |
7.50 |
||
|
2006 |
24 |
7.03 |
16 |
7.00 |
||
|
2007 |
11 |
7.30 |
15 |
7.01 |
||
|
2008 |
24 |
6.77 |
24 |
8.46 |
||
|
2009 |
30 |
6.30 |
30 |
8.77 |
||
|
2010 |
22 |
7.10 |
22 |
8.10 |
||
|
2011 |
20 |
6.20 |
17 |
6.83 |
||
|
2012 |
21 |
5.54 |
22 |
5.20 |
||
|
2013 |
12 |
8.12 |
12 |
8.70 |
||
|
Average |
7.12 |
8.06 |
8.02 |
|||
|
1 In 1992 and 2001 no three year experiments results were not available. |
||||||
|
2 In 1990 and 1993 experiments were conducted for four years where all the rest were conducted for three years |
||||||
Average alfalfa prices received by producers (NASS, 2014 a) for each year were multiplied with APBy and MPBy for each year, subtracting any additional costs for using to get economic impact per acre called APBea and MPBea (Table 2). These economic impacts per acre per year (APBea and MPBea) were multiplied with the alfalfa acres for each year in Benton, Franklin, Grant, Adams, Walla Walla, and Yakima counties (NASS, 2014 b), which represent the majority of irrigated alfalfa production in the state to determine impacts of APBesy and MPBesy which represent the economic benefit in dollars/year for Washington State. Twenty-one years of APBesy and MPBesy and in dollars/year were accumulated to determine the total trial impact APBt and MPBt from 1990 to 2013 in Washington State. There were three years in which no trial finished that year so no impacts were taken on those years (Table 1).
A partial budget approach was used to determine economic impact. Components for the budget are found in Table 2 and include: increase in cost of seed, increased costs for harvest due to higher yields and increased cash returns from additional hay sold. Seed costs differences will vary from variety to variety and year to year. An increase in seed cost for planting a better variety was estimated at $0.60 lb. planted at 20 lb. per acre requires an additional $12/acre/3 year stand or $4.00/acre/year split for three years of production as in other WSU production budgets (Norberg S. and J.S. Neibergs, 2014). WSU production budgets for 1994, 1997, 2002, 2009, and 2012 on a per ton of harvested hay basis was used for additional harvest costs (Hoffmann et. al., 1994) (Hinman et. al., 1997, 2002, 2009) (Norberg S. and J.S. Neibergs, 2014).
Table 2. Partial budget used for calculating economic impact of MPBea and APBea (dollars per acre per year) using costs from available production budgets from Washington State University in 1994, 1997, 2002, 2009, and 2012.
|
Item |
Years |
A Reduced Costs per acre |
B Added Returns per acre |
C Added costs per acre |
D Reduced returns per acre |
A+B+C+D for each year = MPBea4 and APBea which is the change in net return per acre per year |
|
Increased cost of seed1 |
1990 to 2014 |
|
|
$4.00 |
|
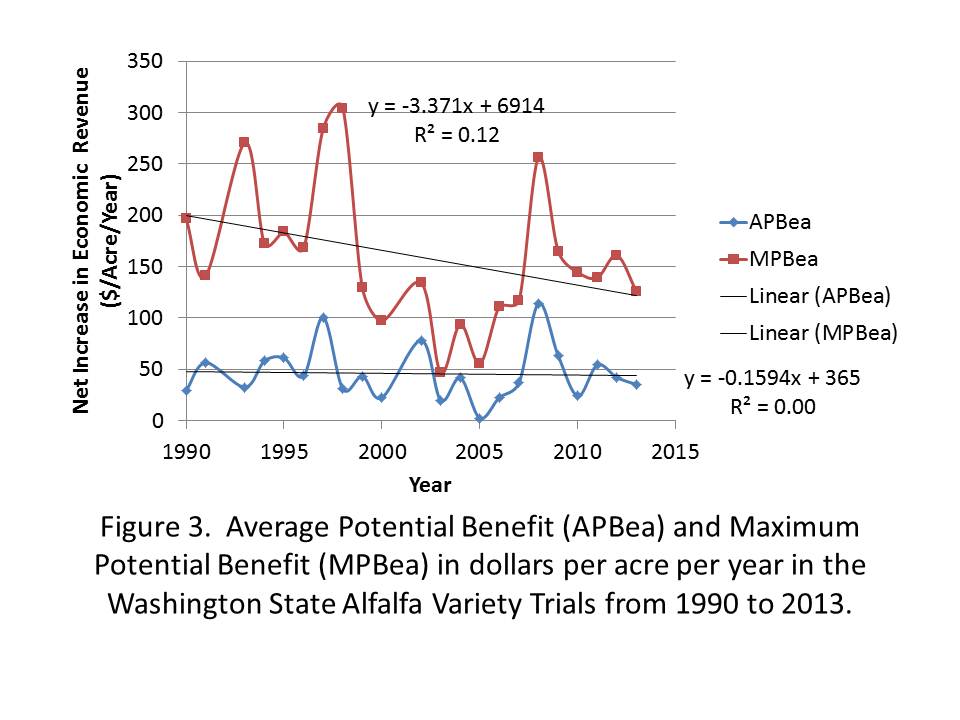
Results for MPBea and APBea by year can be found in Figure 3. |
|
Increased harvest costs due to higher yields2 |
1990 to 1995 1996 to 2000 2001 to 2005 2006 to 2010 2010 to 20133 |
|
|
$16.49 $13.43 $18.50 $22 $31 |
|
|
|
Increased cash returns from hay3 |
1990 to 2013 |
|
MPBy times $/ton for each year APBy times $/ton for each year |
|
|
|
1 Includes seeding 20 lb. of seed per acre at an estimated increased cost of $0.60/lb. or $12/acre for three years or $4 per acre per year. This increase in seed price assumes the highest yielding varieties will be sold at a premium. Total costs per pound of seed varied from $2.60 in 1994 to $3.00 per pound in 2012.
2 Costs included baling, hauling, stacking and in 2010 to 2013 tarping the stack as well which has become a standard practice to protect from weather.
3 APBy and MPBy and marketing price in $/ton for each year can be found in Figures 1 and 2, respectively.
4 APBea and MPBea for each year can be found in Figure 3.
To estimate the percentage of producers using the trial data, Turning Point Technology data gathering devices “ResponseCard RF-A” (clickers) were used at our annual hay meetings in the state asking: “Did you use the WSU/WSHGA Variety Testing results to help you select your alfalfa varieties?” and “Do you plan to use WSU / WSHGA Variety Testing results in the future to help you select your alfalfa varieties?” with 132 and 124 people responding, respectively. The percent responding affirmatively was multiplied by APBesy to get our best estimate of actual impact per year in Washington State. Linear regression lines were created using Proc Reg procedure in Statistical Analysis Systems version 9.3 (SAS Institute Inc. 2011) to determine trends.
Results and Discussion
Averaged over 22 years, APBy was 0.6 tons/acre/year and ranged from 0.2 to 1.1 tons/acre/year, whereas, MPBy averaged 1.6 tons/acre/year and ranged from 0.7 to 3.5 tons/acre/year (Figure 1.). This is similar to results from California where maximum difference between varieties (similar to MPBy) from 1974 to 2009 ranged from 1.1 to 3.5 tons/acre in the coastal area and San Joaquin Valley, respectively, with larger yield variations in areas with more harvests (Putnam, et al., 2009). Generally four to five harvests per year occur under irrigation in Washington State, whereas, San Joaquin Valley has seven to eight harvests. Both APBy and MPBy trended downward over years with MPBy at a faster rate. This decrease over years may be a result of consolidation of alfalfa seed companies and genetic suppliers. In the 1994 WSU Alfalfa Variety Trial Report (Ford, W. 1994), fall dormancy and resistance ratings were given for 94 different companies who submitted seed to National Alfalfa Review Board for fall dormancy three and four varieties. In 2014 only 23 companies submitted seed to National Alfalfa and Forage Ratings for all varieties, fall dormancy two through ten (National Alfalfa and Forage Alliance, 2014).
 From 2011 to 2013, 16 different seed companies entered into the Washington State trials with 37 and 44 unique commercially available varieties at the Pasco and Othello Washington locations, respectively. Without an unbiased evaluation of these varieties it leaves the producer relying on seed salesmen for advice, who have not likely evaluated a significant number of a competitor’s varieties. Evaluating these varieties on farm by producers is very difficult as typically, 12 harvests are required to get a three year evaluation. The time required for just a few varieties to do a field test comparison becomes difficult to impossible for individual producers to take away time from their current operation. Other challenges for producers include randomizing and replicating which complicates harvests, as well as using proper statistical methods for evaluation.
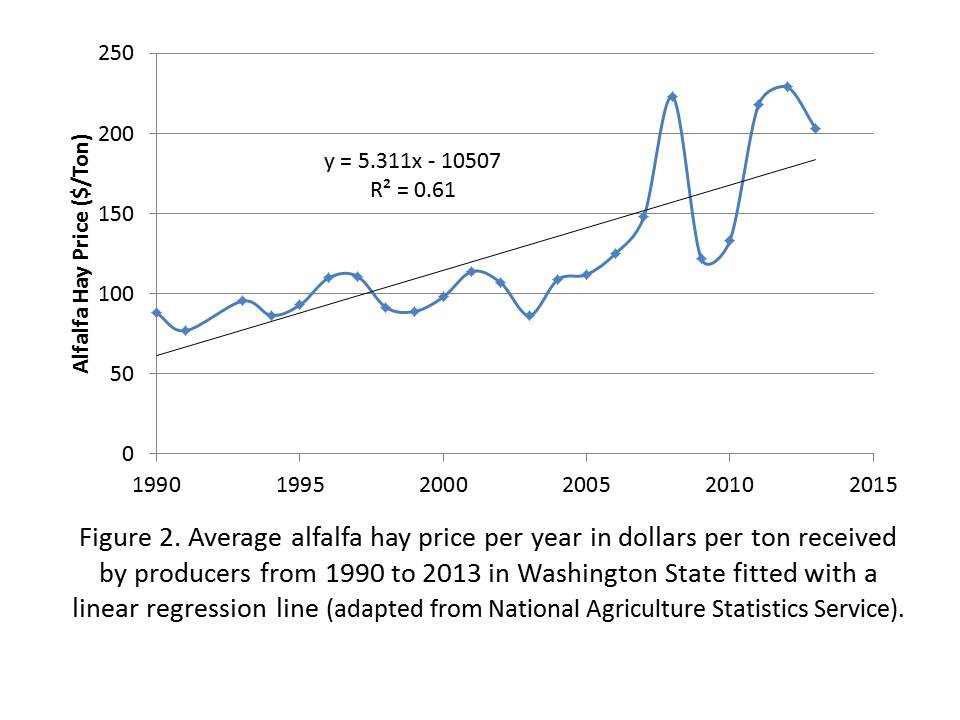
Alfalfa hay prices received by producers in Washington State climbed steadily until it took a large jump in 2008 and remained high in 2011, 2012, and 2013 (Figure 2.) These higher averaged hay prices stabilized the APBea in dollars per acre (Figure 3.). Average over years, the APBea was $46.15/acre/year and ranged from $2.51 to $114.49/acre/year. The MPBea averaged $159.16 /acre/year and ranged from $46.70 to $304.53 /acre/year. The downward trend for MPBea over years was slowed but not reversed by the increase in hay price.
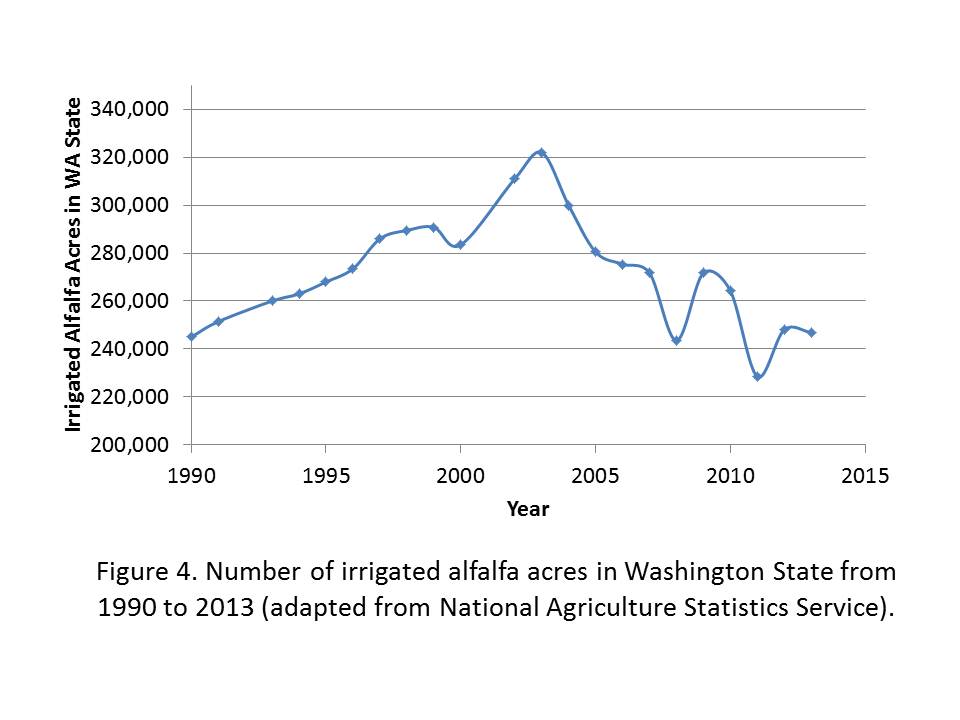
The number of irrigated alfalfa acres in Washington increased from 1990 to 2003 only to decline to its lowest level in 2011 (Figure 4.). The number of acres of irrigated alfalfa produced is related to the relative profitability of alfalfa relative to other crops producers can grow. Even with the record-breaking high priced years of 2011-2013, very little increase in acreage occurred in alfalfa probably due to the corresponding high prices in other commodities.
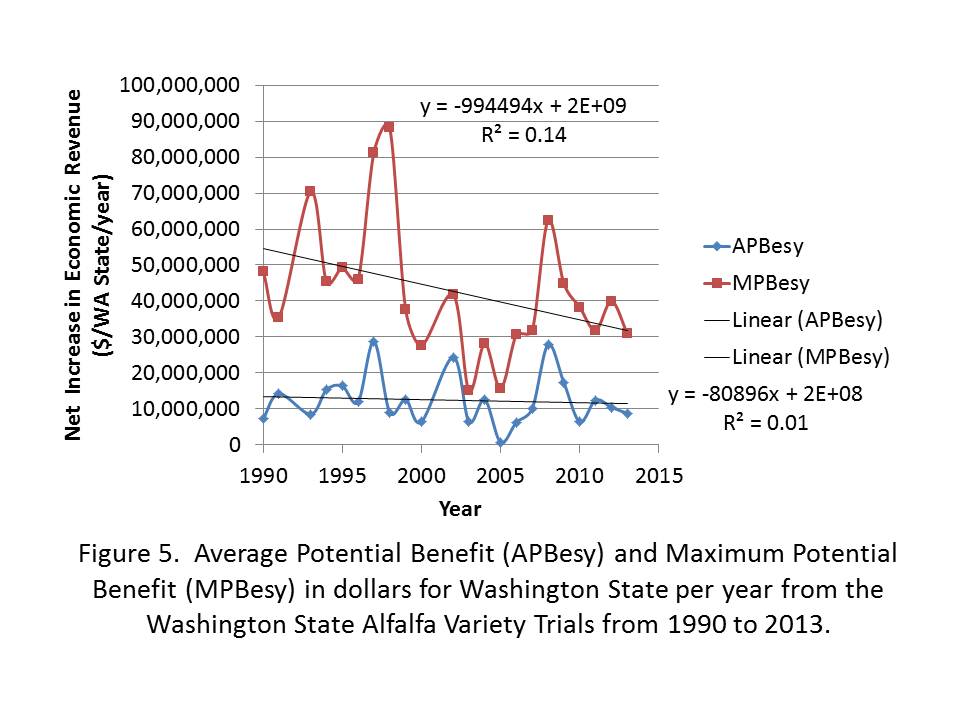
 The APBesy averaged $12.4 million per year from 1990 to 2013 in the state of WA and ranged from $0.70 to $28.8million per year, whereas, MPBesy averaged $42.45 million dollars per year and ranged from $15.0 to $88.1 million per year (Figure 5). Accumulated over the 23 years, the value of Washington State Alfalfa Variety Trials estimated to be $273.7 million and $941.2 million for APBt and MPBt, respectively. As stated earlier, APB assumes every producer used the information in their selection and MPB assumes every producer made the best decision. A survey taken at Washington hay growers meetings in 2012 and 2013 showed approximately 52% of the producers surveyed used the information from the trial to make their decision the previous year. After presentations showing potential impacts for their farms, 86% of the producers planned on using the trials the next year. Using 52% of the land and APBesy, the best estimate of actual impact is $5.0 million for Washington State in 2012 and 2013.
 Conclusion
Averaged over 1990 to 2013, farmers using the top three varieties would gain 0.6 tons per acre of alfalfa per year (APBy) and net $46.15 per acre per year (APBea) compared to an industry yield average of commercial varieties for our area. This would have accumulated to $12.4 million per year (APBesy) if practiced on all irrigated acres and $274 million totaled over years (APBt). In 2012 and 2013, 52% of irrigated alfalfa producers in Washington State used this information when choosing their variety with our best estimate of impact of $5.0 million per year. These data suggest that alfalfa variety trials are very valuable to Washington State.
Cited Literature
Ford, W. P. 1994. Alfalfa Variety Trials, Resistance Ratings & Verticillium Wilt Resistant Alfalfas. Washington State University Extension.
Hewlett, J.P., R. Kettle, and A. Gray. 1996. An Economic Evaluation of The Yield Advantage of Improved Varieties of Alfalfa. University of Wyoming Pub. B-1044.http://www.wyomingextension.org/agpubs/pubs/B1044.pdf Accessed 11/13/2014.
Hinman, H., J. Kugler, K. Painter, and P. Petersen. (2009). 2009 Cost of Producing Alfalfa Hay Under Center Pivot Irrigation in the Columbia Basin of Washington State. Washington State University Extension. http://www.farm-mgmt.wsu.edu/PDF-docs/budgets/IrrigatedAlfalfaProd_Apr2009.pdf Accessed 11/15/14.
Hinman, H., J. Kugler, and W. Woodward. (2002). 2002 Cost of Producing Alfalfa Hay under Center Pivot Irrigation in the Columbia Basin of Washington State. Washington State University Extension – Farm Business Management Report - EB1942E. http://www.farm-mgmt.wsu.edu/PDF-docs/irrigated/eb1942e.pdf Accessed 11/15/14.
Hinman, H., G. Pelter, E. Kulp, R. Gillespie and E. Sorensen. (1997). 1997 Enterprise Budgets, Potatoes, Winter Wheat, Alfalfa Hay, Grain Corn, and Sweet Corn under Center Pivot Irrigation, Columbia Basin, Washington. Washington State University Extension – Farm Business Management Report- EB1667http://www.farm-mgmt.wsu.edu/PDF-docs/irrigated/eb1667.pdf Accessed 11/15/14.
Hoffmann, T.R., W.D. Warnock, and H. Hinman. (1994). 1994 Crop Enterprise Budgets Timothy-Legume and Alfalfa Hay, Sudan Grass, Sweet Corn and Spring Wheat under Rill Irrigation Kittitas County, Washington. Washington State University Extension – Farm Business Management Report- EB1173 https://research.wsulibs.wsu.edu/xmlui/bitstream/handle/2376/4424/eb_1173_1994_1994_crop_enterprise_budgets_timothy_legume_and_alfala_hay.pdf?sequence=1 Accessed 11/15/14.
National Agriculture Statistics Service. (2014 a). Prices Received For Alfalfa Hay, Baled, Washington. Accessed 8/15/2014. http://www.nass.usda.gov/Statistics_by_State/Washington/Historic_Data/fieldcrops/hayalfpr.pdf
National Agriculture Statistics Service. (2014 b). County Alfalfa Acres for : Adams, Benton, Franklin, Grant, Walla Walla, and Yakima, Counties. Accessed 8/15/2014. http://www.nass.usda.gov/Statistics_by_State/Washington/
National Alfalfa and Forage Alliance. (2014). Alfalfa Variety Ratings. Winter Survival, Fall Dormancy & Pest Resistance Ratings for Alfalfa Varieties - 2014 Edition https://www.alfalfa.org/pdf/2014%20NAFA%20Variety%20Leaflet.pdf
Norberg, O.S. (2013). 2013 Washington State Hay Growers/Washington State University Extension Irrigated Alfalfa Variety Trial Report. http://www.wa-hay.org/files/files/2013WSHGAWSUAlfalfaVariety.pdf
Norberg, S. and J.S. Neibergs. (2014). 2012 Enterprise Budget for Establishing and Producing Irrigated Alfalfa in the Washington Columbia Basin. Washington State University Extension Fact Sheet FS133E. http://cru.cahe.wsu.edu/CEPublications/FS133E/FS133E.pdf Accessed 11/15/14.
Putnam, D.H., A. Biscaro, S. Orloff, C. Giannini, C. DeBen, and K. Klonsky. (2010). Estimating the Economic Value of Alfalfa Variety Selection. In Proceedings, 2010 California Alfalfa & Forage Symposium, November 30 - December 1-2, 2010, Visalia, CA http://alfalfa.ucdavis.edu/+symposium/proceedings/2010/10-181.pdf
SAS Institute Inc. 2011. Base SAS® 9.3 Procedures Guide. Cary, NC: SAS Institute Inc.
Turning Technologies. 2009. 255 West Federal Street, Youngstown, Ohio 44503. http://www.turningtechnologies.com/
Van Keuren, R.W. (1954). Forage Investigations, Irrigation Experiment Station Prosser 1954. In Records of Experimental Work in Field Crops 1954 and 1955. Washington State University
Washington State Department of Agriculture. (2014). Agriculture: A Cornerstone of Washington's Economy, 2014. Page updated/verified: Aug 14, 2014. http://agr.wa.gov/AgInWa/