Journal of the NACAA
ISSN 2158-9429
Volume 9, Issue 1 - June, 2016
Cover Crops Demonstration Project in North Central Idaho
- Finkelnburg, D.F., Extension Educator, University of Idaho
Hart, K.N., Extension Educator, University of Idaho
Church, J.A., Extension Educator, University of Idaho
ABSTRACT
Dryland small grains and oilseeds farmers in the Pacific Northwest are interested in sustainable and profitable methods of improving soil quality. In this on-farm demonstration project cover crop mixes and cattle grazing were integrated into direct seeded small grain and oilseed rotations. Cover crop mixes had mixed effects on winter wheat and spring canola yields (-2 - +14% and -7 - +1% versus fallow respectively). Forage quantity and quality were found to be acceptable to good (8.2-13.8% protein, 51.5-55.5 TDN, & 2lb/day/heifer rate of gain). This has led to increased acres of cover crop mixes for grazing.
Introduction
Cover crops as part of cropping systems in north central Idaho and eastern Washington are not new. Sweet clover was used as a green manure cover crop at Washington and Idaho Agricultural Experiment Stations in 1921 and later (Bonnet and Hulbert, 1922). Sweet clover and soil incorporation was studied as a green manure crop to benefit conservation and farming outcomes (Siddoway and McKay, 1962). That study recognized the importance of management strategies for a green manure cover crop on soil moisture and following crop yields. The advent of direct seed technology for dryland winter wheat production in higher rainfall production areas of eastern Washington and north central Idaho renewed farmers' interest in cover crops to add soil nitrogen and help control erosion while maintaining adequate soil moisture for cereal crops. Papers included in the Pacific Northwest Conservation Tillage Handbook (Veseth, 1989 and 1990) laid the foundation for understanding interactions between green manure cover crops and the variables mentioned above.
Now, almost 100 years after the initial work with sweet clover at the University of Idaho Experiment Station, interest in cover crops and their relationships with soil health, soil erosion, crop production, and grazing is widespread among farmers and ranchers. Much of this interest stems from the successful adoption of cover crops in production systems in other parts of the United States. Farmers and ranchers are experimenting with cover crops and their uses on the prairie areas of north central Idaho and the Palouse of eastern Washington. University of Idaho Extension is studying a wide array of cover crop plants for their role in soil health, crop rotations and livestock grazing systems (Hunter,et al., 2014) and through the use of an online Idaho Cover Crop Calculator (http://www.extension.uidaho.edu/nutrient/CC_Calculator/CC_p )
In early 2012, personnel from the USDA Natural Resource Conservation Service and board members from the Lewis County Soil Conservation District asked University of Idaho Extension Educators to design and implement a demonstration and research program for cover crops in the direct seed wheat rotation annual grain production system common in north central Idaho. Project goals were to evaluate the effects of fall and spring planted cover crop mixes on subsequent crop performance and to explore the potential of using cover crop mixes as a forage within these rotations. Several questions were of particular interest to producers. Is there a yield penalty to the grain or oilseed crop following fall- or spring-seeded cover crop mixes? Can cover crop mixes be economically viable sources of late-season forage?
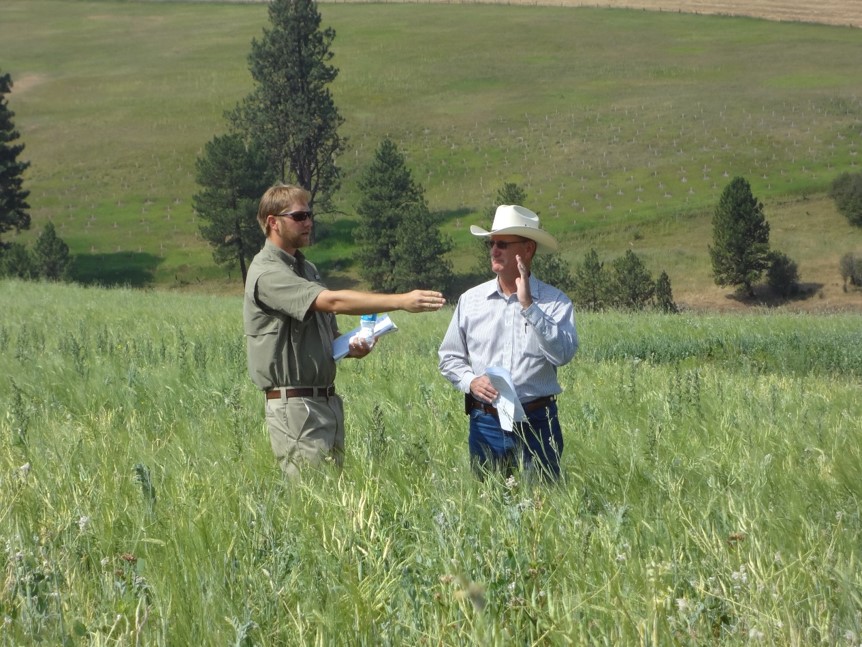
Figure 1. Authors Doug Finkelnburg, left, and Jim Church stand in a cover crop mix plot just before cattle are turned out in August, 2013. Typical fall pasture is seen drying down on background hillslope.
The validity and effectiveness of testing new practices, products or treatments using farm scale equipment has been widely demonstrated (Havlin, et al., 2014). With proper considerations and study designs, on-farm testing has been shown to increase the speed and scale of new practice adoption (Veseth, et al., 1999). Research has shown that three randomized replications are adequate to produce statistically valid on-farm test results given long enough plots to reduce the influence of field variability. Wuest et al., (1994) noted that shorter plot lengths were acceptable with increasing yields and replications in dryland wheat production systems. They observed a greater decrease in least significant differences (LSD) moving from two to three replications in plots 250-750 feet long than in plots 750-1500 feet long.
Methods: Crops Following Cover Crops
The cover crop demonstration project began on the Camas Prairie of north central Idaho in the fall of 2012. Plots were established in silt loam soils which receive 21" of annual precipitation in plant hardiness zone 6b. All on-farm trials were direct-seeded with a 45 foot Flex-Coil air drill using hoe type openers. Seed rows were paired on a 10-inch spacing. Cover crop mixes and winter wheat were planted ½” to 1” deep. Spring canola was planted ½” deep. Weeds and volunteer crop were sprayed with glyphosate herbicide prior to fall and spring planting. Plots were harvested using a commercial John Deere combine. Harvest weights were determined using portable truck scales.
The first demonstration trial included fall seeded cover crop mixes followed by spring canola. Two cover crop mixes were replicated three times using randomized test plots. Test plots were 45’ x 800’, planted on October 12th, 2012, following winter wheat. A chemically fallowed check was compared to a “Nitrogen Mix” and a “Soil Enhancement Mix.” Plots were sprayed out with glyphosate in March and planted to spring canola on April 10, 2013.
| Species/Variety | Nitrogen Mix | Soil Enhancement Mix |
| Winter Pea | 12.5 | 5.2 |
| Winter Lentil | 4.5 | 1.9 |
| Common Vetch | 4.5 | |
| Red Clover | 1.3 | 0.5 |
| Crimson Clover | 0.7 | |
| Winter Oats | 15.0 | 6.2 |
| Hairy Vetch | 1.0 | |
| Winter Triticale | 6.2 | |
| Spring Barley | 6.2 | |
| Purple Top Turnip | 0.4 | |
| Nitro Radish | 0.6 | |
| Winter Canola | 0.6 | |
| Rapeseed | 0.4 | |
| Cover Crop Mix (lbs/A) | 37.8 | 29.9 |
Table 1. Fall planted cover crop seed mixes (lbs/A).
A trial to study spring seeded cover crop mixes followed by soft white winter wheat was initiated in spring of 2013. Three cover crop mixes were replicated three times using randomized test plots. Test plots 45 x 1200 feet long were planted on May 5th, 2013. A chemically fallowed check was compared to a “Nitrogen Mix," a “Grazing Mix,” and a “Soil Enhancement Mix.” The plots were sprayed with glyphosate herbicide on September 15th and planted to winter wheat on September 25th.
| Species/Variety | Nitrogen Mix | Grazing Mix | Soil Enhancement Mix |
| Spring Forage Peas | 16.0 | 8.9 | 5.3 |
| Spring Lentils | 4.5 | ||
| Common Vetch | 4.5 | 2.5 | |
| Rapeseed | 1.0 | 0.6 | 0.3 |
| Flax | 5.5 | ||
| Crimson Clover | 0.9 | 0.5 | |
| Everleaf Oats | 8.3 | 8.3 | |
| Spring Barley | 8.3 | 5.0 | |
| Appin Forage Turnips | 0.6 | ||
| Groundhog Forage Radish | 0.8 | ||
| Pearl Millet | 1.1 | 1.1 | |
| Soybean | 1.8 | ||
| Winter Pea | 4.2 | ||
| Hairy Vetch | 0.8 | ||
| Spring Triticale | 5.0 | ||
| Purple Top Turnip | 0.3 | ||
| Nitro Radish | 0.5 | ||
| Pacific Gold Mustard | 0.5 | ||
| Sunflower | 1.3 | ||
| Buckwheat | 2.3 | ||
| Cover Crop Mix (lbs/A) | 31.5 | 32.0 | 37.2 |
Table 2. Spring planted cover crop seed mixes (lbs/A).
Canola and wheat yields were analyzed with greater least means and analysis of variance procedures respectively (proc glm & proc anova) in SAS 9.4.
Methods: Grazing
The overall project included a grazing component that utilized cattle to graze the cover crops. This objective was to evaluate the effect of livestock grazing on subsequent winter wheat yield. Cattle performance while grazing the cover crops was evaluated to determine the potential of using cover crop mixes as a forage source. Management Intensive Grazing, also called "mob" or "cell" grazing, was used for grazing cover crop mixes. This system divides a field into paddocks and grazes them with high stocking densities for a short duration as recommended by Brummer et al., (2015) and Mount (2011) as a way to increase utilization, improve forage and soil health and improve cattle performance.
In 2013, the project cooperator from Nezperce, Idaho, planted 14.9 acres to three different cover crop mixes with one fallow treatment as outlined above (Figure 1). The 14.9 acres was divided in two with one-half (7.4 acres) being grazed and one-half left ungrazed. The 7.4 grazed acres were divided into six paddocks of 0.9 acres each for grazing. Additionally, 8.4 acres around the plot was seeded to the “Grazing Mix” and divided into 9 additional plots of 0.9 acres each. The paddocks were divided using one strand electric wire. Each paddock fed into an ally that allowed the cattle to access water. The paddocks were stocked with 24 animal units of cattle that included yearling heifers and cows with calves. The stocking rate was 1.5 animal units per acre. The cattle were turned out on the cover crops to graze on August 13, 2013. They grazed each paddock for two days and were then moved to the next paddock. They grazed the field for 32 days.
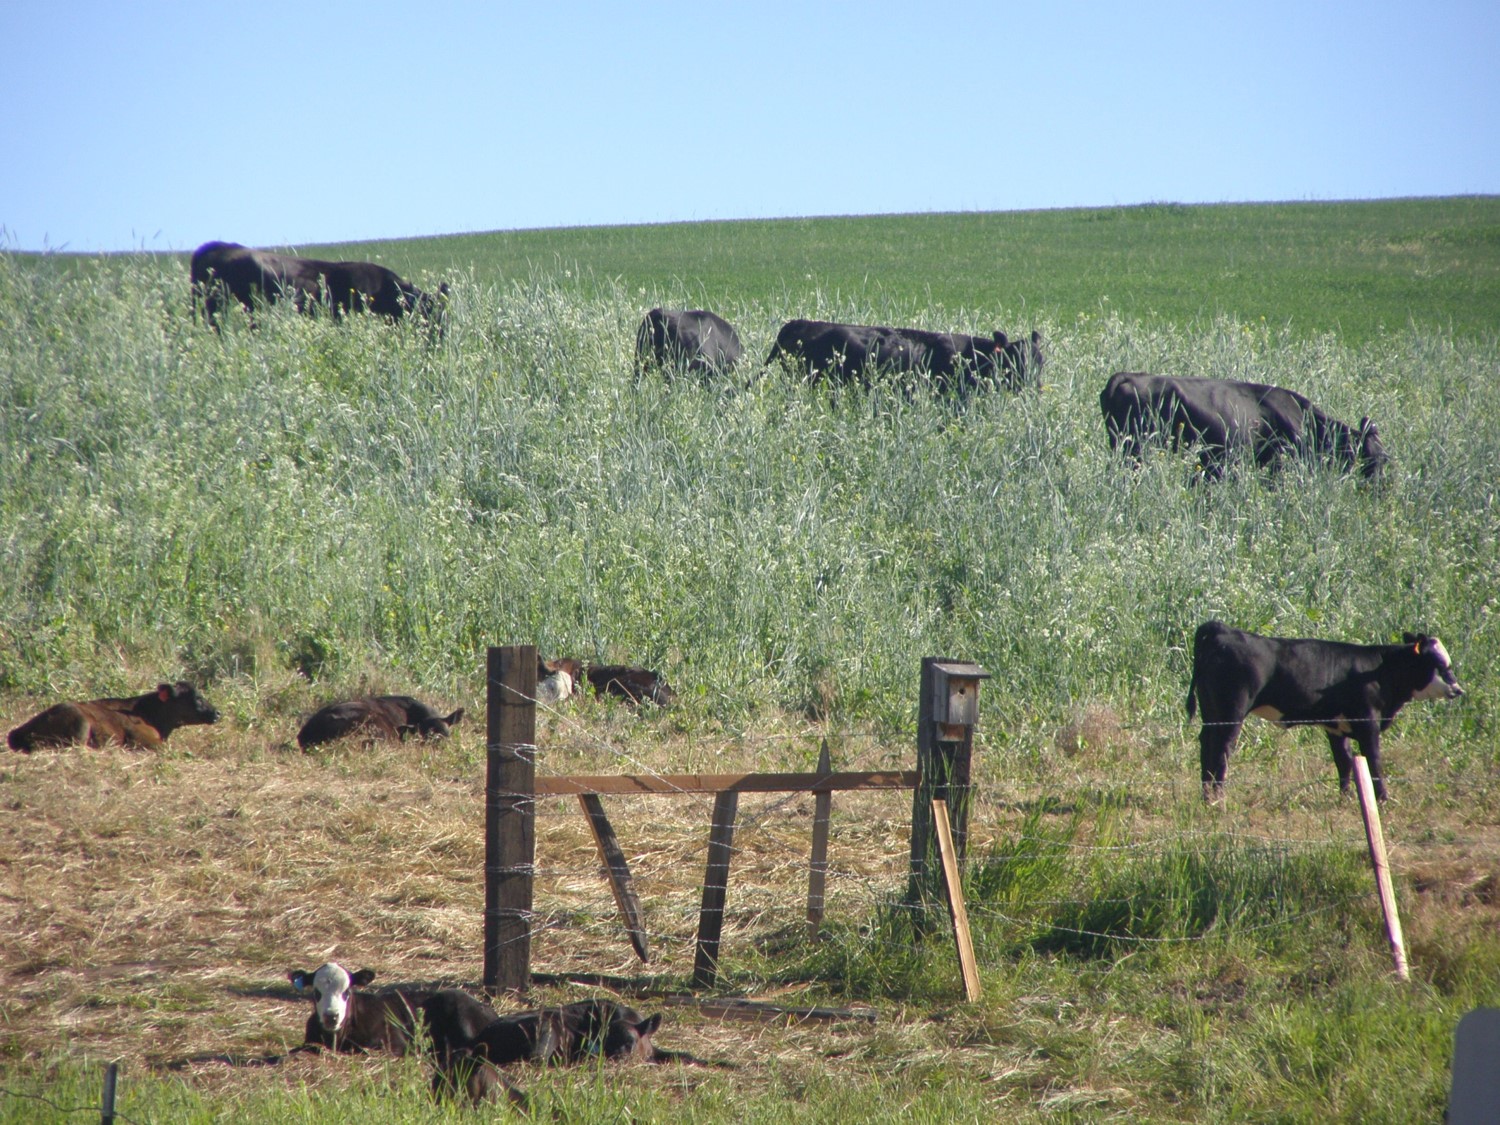
Figure 2. Cattle grazing forage oats, spring triticale, spring peas, spring canola, forage radish and forage turnips in a paddock.
In 2014, the project was expanded to a field of 46 acres on the same farm (Figure 2). The field was seeded to a six-way cover crop mix that included; forage oats, spring triticale, spring peas, spring canola, forage radish and forage turnips . The field was planted the first week of May 2014. The field was divided into paddocks for grazing using a one strand electric fence as a cross fence and two strand electric fence as the border fence (Figure 3). Each paddock covered 2 acres. Each paddock had access to a live stream that was used as a water source. Starting the third week of June, the paddocks were grazed by 46 cow-calf pairs with a stocking rate of 1.75 animal units per acre. The cattle were moved to a new paddock every four days. The forage produced from this field was greater than anticipated at 5000 pounds per acre. It was impossible to graze the field with the forage standing prior to the quality of the feed declining. Consequentially, one third of the field was left standing and grazed, one third of the field was windrowed and grazed, and one third was swathed and baled. The cattle bale grazed about half of the bales with electric fence used to make small paddocks and limit the number of bales available for grazing. The cattle were removed from the field the second week of October. The remaining bales not grazed were hauled off the field and fed during the winter feeding period.
In 2015 the project cooperator seeded 150 acres to the six-way cover crop mix in early May (Figure 4). In mid-June, 75 head of spayed heifers and 52 head of cows and their calves were turned in to graze 50 acres of the field. The field was divided into paddocks of approximately 2 acres. A water tank was used as a water source with water hauled by truck to the tank. The cattle grazed standing forage for about thirty days and then grazed the forage in the windrow. The stocking rate was 2.8 animal units per acre. The cattle grazed the 50 acres for 65 days. At this time the 75 heifers were removed and the 52 cow calf pairs, grazed the remaining 100 acres of the cover crop mix. The forage in the 100 acres was windrowed and half of the field was baled. The cows and calves grazed the forage in the windrows and also bale grazed some of the forage that was baled.
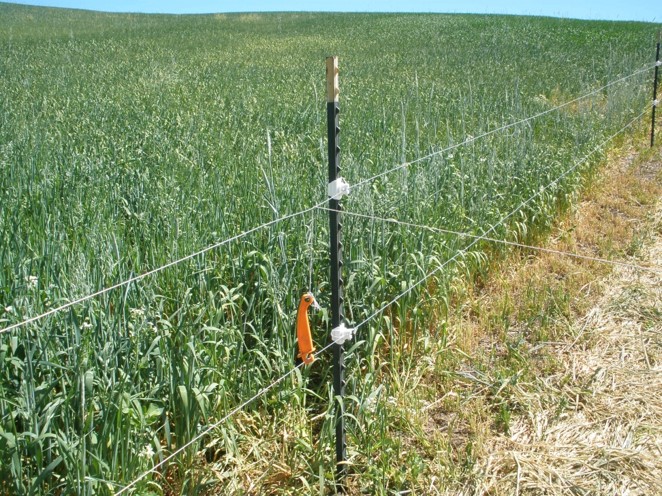
Figure 3. Cover crops and fencing system.
Results: Crops Following Cover Crops
Canola following the nitrogen mix and fallow yielded 7-8% more than following the soil enhancement mix (Table 3). Wheat following the nitrogen mix yielded 14-16% more than that following both the fallow check and the grazing mix respectively (Table 4). Wheat following grazed treatments yielded more than the non-grazed treatments. These results indicate that crop performance following cover crop mixes can be helped or hindered depending on the mix of species grown. Crops following mixes with more nitrogen fixing species performed as well or better than if they had been grown on chemical fallow. The yield advantage to winter wheat where grazing occurred is difficult to explain since the grazing component was not replicated.
| Cover Crop Effects* | Yield (lbs/A) | % difference from fallow |
| Nitrogen Mix | 1795 a | +1 |
| Fallow | 1783 a | 0 |
| Soil Enhancement Mix | 1682 b | -7 |
| CV, 2.5% | ||
| * a is different from b at a 0.05 probability level | ||
Table 3. Spring canola performance following two fall-seeded cover crop mixes.
| Cover Crop Effects* | Yield (lbs/A) | Difference from Check (%) |
| Nitrogen Mix | 72 a | + 14 |
| Soil Enhancement Mix | 68 ab | + 9 |
| Fallow | 62 b | 0 |
| Grazing Mix | 61 b | - 2 |
| Grazing Effects** | ||
| Grazed | 75 a | |
| Non-Grazed | 56 b | |
| CV, 10.3% | ||
| * a is different from b at a 0.05 probability level | ||
| * a is different from b at a 0.001 probability level | ||
Table 4. Winter wheat performance following three spring-seeded cover crop mixes and grazing.
Despite attempting to swath before triticale grain maturity, triticale seed volunteered in the following season’s winter wheat plots and did not winterkill. Due to the difficulty of seedling identification and removal from established wheat stands, cover crop mixes in cereal production systems should avoid moderately cold tolerant grass species or greater care should be taken to ensure grassy cover crop species termination prior to seed set.
Results: Grazing
Titlow (et al., 2014) predicted that yearling cattle grazing cover crops in Nebraska should gain 2.2 – 2.7 pounds per day. The yearling heifers on the cooperator's farm gained 2 pounds per day while on the cover crop field. Forage quality was acceptable when sampled (Table 5), but results indicated that the forage was too mature when the cattle were turned out to graze. Bearded spring barley was seeded in the mix and the cattle did not eat it due to the plant’s maturity. The cattle ate the other species without issue but all of the forage was judged too mature. It was learned that the grazing needs to begin earlier in the season, preferably prior to July 1st. Cattle performance while grazing the cover crops was acceptable. There were also no health issues.
| Treatment | As Rcvd. Moisture % | Crude Protein % | Acid Det. Fiber | aNDF % | Ash % | Nitrate (ppm) | NE/LACT MCAL/LB | TDN Est. % |
| Nitrogen Mix | 6.6 | 13.6 | 30.5 | 35.7 | 9.5 | 550 | 0.67 | 55.5 |
| Grazing Mix | 6.5 | 9.0 | 32.5 | 45.4 | 8.7 | 544 | 0.64 | 51.5 |
| Soil Enhancement Mix | 5.0 | 8.2 | 30.6 | 45.3 | 8.2 | 538 | 0.67 | 51.5 |
Table 5. Forage quality analysis from spring planted cover crop mixes collected July 30th, 2013.
After adjusting the species composition in the mix to avoid early curing grasses the cattle performance in 2014 improved. According to the cooperator, the net return per acre was competitive with that of his best commodity crops. He was able to graze his cattle on the field from the third week of June until the second week of October, when he direct-seeded his winter wheat crop in the field he used to graze cover crops. He also had bales of forage produced on the field left over to feed during the winter feeding period.
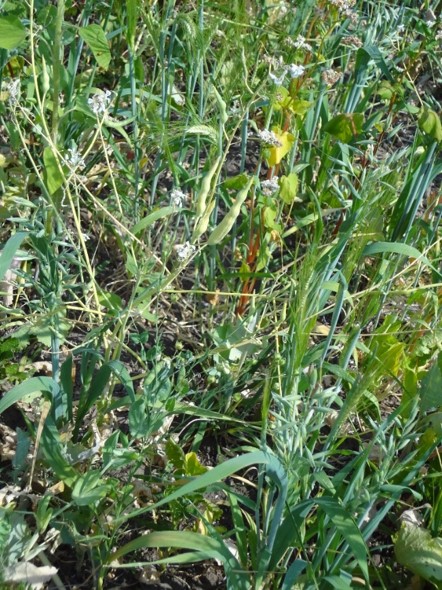
Figure 4. – Oats, turnips, buckwheat, radishes, canola and peas in a cover crop mix for grazing.
The cover crop grazing demonstration expanded to 150 acres on the cooperator's farm. Cover crops were seeded the first week of May with cattle turned in to graze the third week of June. Seventy-five head of spayed heifers grazed 50 acres of the cover crop field with 52 head of cow-calf pairs for 65 days. The spayed heifers were owned by another cattleman. The cooperator sold the forage to the other cattle owner on a cost per pound of gain basis. The heifers gained 1.75 pounds per day while grazing the cover crops returning a profit to the cooperator who also retained the conveniently distributed nutrient byproducts of grazing. On a dry year with not as much forage, the cattle still performed very well. Despite excessive heat and drought in the 2015 cropping season, he was very pleased with the amount of forage produced and the performance of his cattle. The cooperator plans continue grazing cover crops for years to come.
Conclusions
Cover crop grazing in north-central Idaho dryland cereal based production systems has proven to be a viable practice. By establishing replicated farm-scale trials, the producer was able to observe potential outcomes from multiple management choices. Crop yields either benefited, were unchanged, or were lowered depending on the mix of species they followed indicating the importance of species selection in this system. This study did not determine why a winter wheat yield advantage was seen following grazed cover crops. Further research should be conducted to determine if the crop response was anomalous or a result of the presence of grazing animals.
References
Bonnett, R.K. and Hulbert, H.W., (1922). Sweet Clover. University of Idaho Agricultural Experiment Station, Department of Agronomy, Circular No. 22.
Brummer, F., Sedivec, K., Nester, P., Gaugler, E., and Schaunaman, C., (2015). Annual Cover Crop Options for Grazing and Haying in the Northern Plains. North Dakota State University Extension Service, Bulletin R1759.
Siddoway, F. H. and McKay, H. C., (1962). Tillage of Sweetclover Under Dryland Conditions. Idaho Agricultural Extension Service, Bulletin No. 388.
Fisher, B., Shelton, V., and Bailey, T., (2014). Cover Crops & Grazing. Agronomy Notes, Natural Resources Conservation Service Newsletter, Issue 10.
Havlin, J. L., Shroyer, J. P., Devlin, D. L. (1990). Establishing On-Farm Demonstration and Research Plots. Cooperative Extension Service, Kansas State University.
Hunter, L., Falen, C., and Moore, A., (2014). Cover Crops for High-Desert Farming Systems in Idaho. University of Idaho Extension, Bulletin 889. http://www.extension.uidaho.edu/nutrient/culturalpractices/PDF/Cover%20Crops%20for%20High-Desert%20Farming%20Systems%20in%2
Mount, D., (2011, Fall). Management Intensive Grazing, What is it and Could it Work for You? University of Wyoming Extension Beef Newsletter.
Titlow, A. H., Hansen, J. A., Luebbe, M. K., Klopfenstein, T. J., and Jenkins, K. H., (2014). Dryland Cover Crops as a Grazing Option for Beef Cattle. University of Nebraska, Nebraska Beef Cattle Report, pages 56-58.
Veseth, R. J., Wuest, S. B., Karow, R. S., Guy, S. O., Wysocki, D. J., (1999). On-Farm testing – A Scientific Approach to Grower Evaluation of New Technologies. Pacific Northwest Conservation Tillage Handbook Series #9, Chapter 10. Retrieved from http://pnwsteep.wsu.edu/tillagehandbook/index.htm
Veseth, R.J., (1990). No-till Winter Wheat After Green Manure Legumes. PNW Conservation Tillage Handbook, No. 15. Retrieved from http://pnwsteep.wsu.edu/tillagehandbook/index.htm
Veseth, R.J., (1989). Reduced Tillage for Green Manure Legumes. PNW Conservation Tillage Handbook, No. 14. Retrieved from http://pnwsteep.wsu.edu/tillagehandbook/index.htm
Wuest, S. B., Miller, B., Alldredge, J., Guy, S., Karow, R., Veseth, R. and Wysocki, D. (1994). Plot Length Influences on Experimental Error of On-Farm Tests. Journal of Production Agriculture, Vol. 7. No. 2. https://dl.sciencesocieties.org/publications/jpa