Journal of the NACAA
ISSN 2158-9429
Volume 8, Issue 2 - December, 2015
Monetary Estimates of Feral Hog Damage to Agricultural Producers in Louisiana
- Tanger, S.M., Asst Professor And Extension Forestry Economist, LSU Agcenter
Guidry, K.M., Professor, LSU Agcenter
Nui, H., Instructor, LSU Agcenter
ABSTRACT
A survey was developed to elicit damage estimates from agricultural producers related to feral hog activity in each of the state’s 64 parishes of Louisiana. Surveys were mailed to over 4,000 agricultural producers and landowners with 1,223 useable responses. Survey respondents identified $4.1 million in production losses and an additional $1.2 in increased costs of production and infrastructure damage due to feral hogs during the 2013 calendar year. Survey responses were combined with published data on the size of the agricultural industry in Louisiana in 2013 to develop statewide estimates of the impact of feral hogs. Results suggest that feral hogs caused $53 million dollar in production losses and an additional $21 million in increased costs for a total economic impact of $74 million to the state’s agricultural sector in 2013.
Introduction
Feral hog (Sus scrofa) damage in the United States is estimated at $1.5 billion dollars annually, assuming an approximate hog population of 4 million. These dollar estimates are considered conservative, accounting for environmental degradation, disease outbreaks or more difficult to document impacts with respect to clean water losses and animal interactions (Pimental et al. 2002). The difficulty with controlling feral hogs is that they have been found to be extremely difficult to trap and are highly adaptive being able to live in both in remote areas or even in areas with high human populations.
Adding to the difficulty with controlling feral hogs is their high reproductive prolificacy. Reproductive maturity in female feral hogs ranges from 5-14 months and they can produce up to two litters per year with an average of 5-6 piglets per litter. Older sows may have litters of 10 to 13 (Timmons et al 2012). Breeding season is year round as long as conditions are not too severe (i.e. heavy snowfall, intense drought). Most recent population and density studies estimate population growth of feral hogs in Texas to be in the range of 18 percent to 20 percent annually. Given this growth rate, hog populations could conceivably double within five years.[1](Timmons et al 2012). As generalists, feral hogs can exploit, even thrive, in most habitat types. The only real constraints on their numbers and movement are associated with seasonally-available forage resources and access to well‑distributed water, shade and escape cover, as they have few predators if they can make it to full maturity.[2] [3]The most recent estimates of feral hog populations in Louisiana suggest there are approximately 500,000 wild hogs present in the state[4]
One of the concerns of the rapid growth in feral hog population is the potential for negative human-wildlife interactions. While not as frequently observed as impacts to agriculture and forestry, these human-wildlife interactions are becoming more common as hog populations have increased. Urban areas in Texas and Georgia have had traffic problems and car accidents from hogs. Female hogs can be very defensive and have killed pet dogs. Feral hogs can transfer diseases to backyard wildlife, livestock, and companion animals.[5]As Feral hog numbers grow their indirect impacts on humans increase as well. They are known to carry waterborne pathogens for drinking water including E. coli, Campylobacter, Salmonella, Cryptosporidium and Giardia (Environmental Protection Agency, 2009; Kaller and Reed, 2010), so they present a very real threat to contaminating fresh water sources.
Feral hogs have been found to reduce the number of tree species by rooting for nuts and acorns (Campbell and Long, 2009), preferring mostly hard mast species (i.e. beech, oak, hickory). Consequently, conditions necessary for seedling establishment and growth in forests are jeopardized (Chavarria et al., 2007). A further effect of this behavior is the loss of vegetative ground cover and litter layer that invertebrates and small vertebrates depend on for cover (Kaller and Kelso 2003, 2006).
Likewise, feral hogs can be a threat to agricultural producer’s crops and enterprise stock. The following excerpt from e-extension provides a good snapshot.[6]
“Studies indicate the majority of damage in agriculture fields is from trampling, with only 5-10% due to actual consumption. Rooting around the base of trees or shrubs (e.g., pecan trees) can undermine root systems and weaken trees. Feral hogs will travel great distances to reach crops that have ripened or matured. They will feed on most life stages of an agricultural crop—from seeds through mature plants. Feral hogs are known to root straight down a row of newly-planted corn field and consume the seeds, but most reported damage occurs when the crops are nearly mature. They will also feed on grains stored in wire-mesh silos or bins if hog-proof fencing was not erected.”
For a nearby comparison, feral hogs were estimated to cause an average of $52 million of damage annually to the agricultural industry in Texas (Lynn 2008). Examples of feral hog damage include but not limited to: rooting pastures and rangeland, consumption of native vegetation, negative effects on water quality, and predation of wildlife. Georgia estimated that in 2011 feral swine caused $81 million in agricultural and property damage (Mengak 2012). A 2009 survey estimates that feral swine caused $75 million in damage to agricultural crops in Alabama (Shi et al. 2010).
Wild pigs not only cause direct damage to crops, but also force farmers to grow less profitable crops to avoid vulnerability to wild pigs. Among farmers who suffered some damage by wild pigs, 20% had changed or will change their crops to mitigate wild pig damage (Shi et al 2010). Likewise, comments by several farmers who responded to our survey indicate that planting operations can be delayed by feral hog activity. The revenue loss affected by those changes have been reported to be as high as 20.6%. The South Carolina Feral Hog Task Force estimates that feral swine cause $45 million in damage annually. Unfortunately, no formal economic assessment of feral hog activity has been conducted in the state of Louisiana to date.
Quantifying the economic impacts of damages caused to the agricultural industry in Louisiana are the focus of this research and the data and methods used, results, and implications of feral hog activity on farming operations in Louisiana are addressed in the subsequent sections. We developed a survey instrument to elicit damage estimates from agricultural producers related to feral hog activity in each of the state’s 64 parishes of Louisiana. Surveys were mailed to over 4,000 agricultural producers and landowners with 1,223 useable responses returned. Survey responses were combined with published data on the size of the agricultural industry in Louisiana in 2013 to develop statewide estimates of the impact of feral hogs. Given the estimates generated in other states, this information should relate to policy makers the seriousness of this issue and the need for a coordinated effort in managing this invasive species.
Data and Methods
During the period from winter 2014 to spring 2015, a mail questionnaire was sent to over 4000 commodity farmers in Louisiana based on tax records for 2013. The mailing list was purchased from Best Mailing Lists. The purpose of this survey was to determine trends and patterns in feral hog damage to farming operations in the state, examining both commodity losses as well as other damages. The questionnaire was pretested with several extension economists and farm operators and revised before the final mailing. Mailing procedures followed the Tailored Design Method (Dillman 2000) and included a pre-notification postcard, the first questionnaire mailing with a postage paid return envelope, a reminder postcard, and a second mailing to first-mailing non-respondents. Personalized cover letters that accompanied the questionnaires were signed by the principal investigator(s) and were addressed to agricultural producers in the state by name and address.
Each of the five sections of the survey contained questions involving issues relevant to ownership, presence of feral hogs, perceptions, yield losses and other costs, policy implications, and socio-demographics. The surveys contained fixed response, scale, and open-ended questions to measure the major concepts. The scale questions were based upon Likert scale types (Bruner et al., 2001). The open-ended questions were designed to give questionnaires the opportunity to express their opinions not covered in other questions. At the heart of the survey were questions designed to elicit information on the production losses and increased costs experienced by agricultural operations. Damages associated with hog activity was divided into two areas, production losses and non-production losses.
Production Losses
The first part of that section was designed to elicit information about production losses experienced by producers in 2013 for selected commodities[7]. For each commodity listed in the survey, respondents were asked to provide the total number of acres produced in 2013, the number of acres that were damaged by feral hogs, and an estimate of the percent yield loss or reduction experienced as a result of feral hogs. The survey responses on the number of acres impacted and estimated percent yield loss were then combined with published data on state average yields and average prices for each commodity surveyed to develop estimates of the value of production losses for each commodity. Price and yield data were obtained from the LSU AgCenter publication, Louisiana Summary: Agriculture and Natural Resources[8]. The average yield per harvested acre in 2013 as reported by the Louisiana Summary was used as the “normal” or “expected” yield producers would have experienced without the feral hog damage. The average price received by producers in 2013 as reported by the Louisiana Summary was used as the sell price producers were expected to receive on their 2013 production. With the published price and yield data[9], the estimated economic impact to survey respondents from production losses to a particular commodity could simply calculated as:
- Production Losses (Survey) = Acres Impacted (Survey) * (Expected Yield * Yield Loss Percent)*Market Price.
With the economic impact to the survey respondents determined, the next step was to extrapolate them to statewide estimates. This was done by taking the percent of the acres impacted as determined from the survey respondents and applying that to statewide acreage estimates for each commodity[10]. This provided estimates of the potential of total acres in the state that are likely being impacted by feral hogs. The economic impact of those acres was then determined by multiplying the estimated statewide acres impacted by a dollar per acre impact determined from the survey responses. Mathematically, a statewide estimate of the economic impact for each commodity was calculated as:
- Production Losses (State) = % Acres Impacted (Survey) * Total State Acres * Per Acre Damage (Survey)[11][12]
Non-Production Losses
The second area of the cost section of the survey was designed to elicit information about other damages experienced due to the presence of feral hogs. These are identified as Non-Production Costs and include increases to production costs (replanting and additional field cultivation), losses of stored commodities, losses to hunting lease income, losses of livestock, and repairs and replacement of damaged equipment and farm infrastructure. Respondents were simply asked to provide their estimate of the costs associated with each issue provided in a list of potential damage issues that may have experienced as a result of the presence of feral hogs on their operation. The total economic impact of these non-production losses to the operations of the survey respondents was determined by simply summing their costs estimates. While this provided a single economic impact across all respondents, the economic impact of non-production losses were also expressed on a per acre basis by dividing the total economic impact of non-production losses by the total number of acres in the operation reported by the survey respondents. The estimated of the economic impact of non-production losses was then expanded to reflect statewide losses by multiplying the ratio of total acres reported in the survey to the total acres in the state by the per acre economic impact of non-production losses determined from the survey responses. Mathematically, this would simply be:
(3) Non-Production Losses (State) = (Total Survey Acre / Total State Acres) * Per Acre Non-Production Losses (Survey)[13]
Non-production losses are fixed by operation, nonetheless in order to conduct a statewide estimate total acres in state are needed to translate the sample size findings to the state level. The rationale for not doing this by number of operations is the difficulty in measuring the number of operations by each commodity at the state level[14].
Validity of statewide estimation
The ability to expand damage estimates determined from the survey to statewide estimates is dependent on how truly reflective the survey sample is of the state as a whole. One way to determine how reflective the survey respondents are of the entire population is to test for non-response bias, which is a common concern in survey research. Non-response is a problem in any survey because it raises the question of whether those who did respond are different in some important way from those who did not respond (Churchill 1987). In mail surveys, there can be bias associated with non-response, individuals with an interest in the subject matter are more likely to respond than uninterested individuals (Dillman 2000). Bias due to non-response can be evaluated by comparing those who responded to the initial mailing to those who respond as a result of subsequent mailings and other follow-up efforts (Armstrong and Overton 1977). Research has shown that late respondents typically respond similarly to non-respondents. Accordingly, second mailing respondents, as a proxy for non-respondents, were compared to first mailing respondents by all damage types, both production related and non-production related losses. In this case as well, no difference in the distribution of responses between rounds (see Table 1 for tests on production losses and Table 2 for tests on non-production losses)[15]. With only 4 total differences (type three test of fixed effects), the interpretation is that round 1 and round 2 are essentially the same. Four of 29 (13%) were different, which could be simply chance differences. Given these results it is believed that the sample of farmers under investigation are generalizable to the state level (or as being representative of all farmers in Louisiana). This implies that our statewide estimates for damage are trustworthy as approximating the actual damages associated with feral hog activity on Louisiana farms (Faraway 2005).
| Production Related Variable | Type III Tests of Fixed Effects ( pr>F ) |
|
Soy Acres Lost |
0.7842 |
| Corn Acres Lost | 0.9774 |
| Rice Acres Lost | 0.6329 |
| Hay Acres Lost | 0.9377 |
| Cotton Acres Lost | 0.0001*** |
| Wheat Acres Lost | 0.9211 |
| Pecan Acres Lost | 0.7951 |
| Sugarcane Acres Lost | 0.8326 |
| Oats Acres Lost | 0.8471 |
| Pature Acres Lost | 0.3689 |
| Grain Acres Lost | 0.8067 |
*, **, and *** denote significance at the 10%, 5%, and 1% levels, respectively. Note: For Type III effects, if the pr > F = .10 then the variable is the comparison between rounds of the survey are considered statistically different and thus questionable as representative of the population.
| Non-Production Variable | Type III Tests of Fixed Effects ( pr>F ) |
| Replanting | 0.4507 |
| Rediscing | 0.5965 |
| Damage to Pets | 0.8067 |
| Damage to Wildlife Food Plots | 0.3417 |
| Damaged/Consumed Feed Grains | 0.1706 |
| Damage to Livestock | 0.4373 |
| Damage to Pasture | 0.1487 |
| Loss of Stored Commodities | 0.8946 |
| Damage to Farm Equipment | 0.9339 |
| Damage to Fence | 0.3049 |
| Damage to Stock Ponds/Tanks | 0.999 |
| Damage to Landscape | 0.9461 |
| Damage to Natural Waters | 0.1932 |
| Damage to Drains/Levees | 0.0497*** |
| Lost Hunting Leases | 0.5706 |
| Other 1 | 0.9405 |
| Other 2 | 0.0006*** |
*, **, and *** denote significance at the 10%, 5%, and 1% levels, respectively. Note: For Type III effects, if the pr > F = .10 then the variable is the comparison between rounds of the survey are considered statistically different and thus questionable as representative of the population.
Results
The first major section of the questionnaire dealt with questions about the farmer’s perception of feral hog activity on their farmland (see Figures 1-4). Beginning with Figure 1, the reader can see that for the commodities under investigation the farm gate values are highest in those parishes along the Mississippi River flood plain and to a lesser extent the Red River flood plain. Likewise, Respondents for the survey, being identified as farmers, the responses generally come from the same areas as where there is the highest farm gate value by commodity (Figure 2). It is believed this is simply an indication that there are more people, more responses, more likely to be damage reported in those areas. Those variables will need to be weighted with a population density to control for that affect to see if indeed this is the case.
Figure 1. Total Farm Gate Value of Production Commodities in 2013.
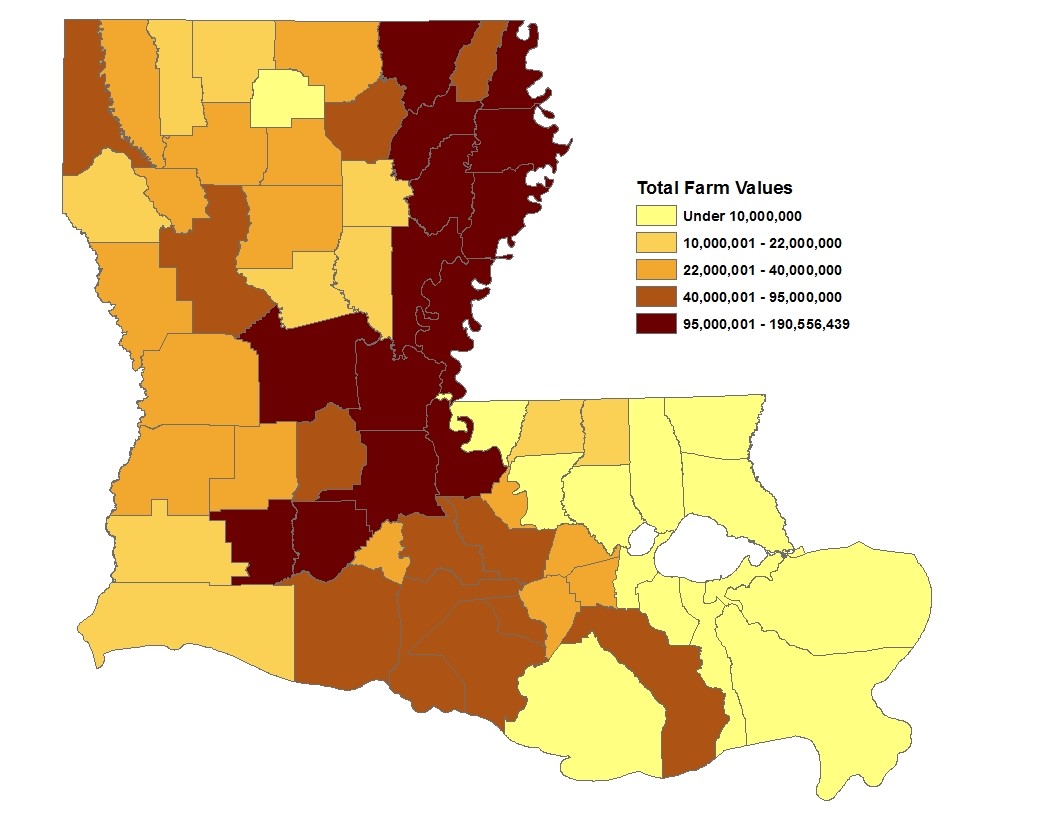
Figure 2. Frequency of zip codes for Louisiana farmers who responded to the survey in 2013.
Further, the presence of hogs (Figure 3) closely mirror the first two figures. Hogs are prevalent along our two major waterways, especially in the floodplains surrounding those waterways. This may simply be an artifact of the survey sample, because farmers were the respondents. Another interpretation is that the hogs are merely sticking close to waterways, which provide areas where hogs can flourish.
Figure 3. Respondents reporting ‘Yes’ to presence of Feral Hogs in 2013.
Lastly, Figure 4 indicates that where hogs are present they are causing damage. Interestingly though, the number of respondents reporting lost value from hogs was around 13% of the overall respondents (159 out of 1223). While these numbers don’t appear to be significant once the calculations described in the methods section (equations 1-3) were conducted its clear that damage estimates are profound.
Figure 4. Respondents reporting monetary losses from Feral Hogs in 2013.
Tables 3 and 4 shows actual dollar values attached to commodity type losses and non-productive loss estimates[16]. Total production losses were tabulated to be approximately $4.1 million dollars from the study respondents. Using equation 2, referenced in the previous section, the statewide estimates for production related losses approximates to $53 million in statewide damages. Commodity loss categories indicate that soybeans were hit hardest by feral hogs (28%) as a portion of overall damage, followed by corn, hay, and rice (19%,16%, and 13% respectively); with pasture and wheat (7% and 6%) rounding out the top five. All other crops reported commodity losses of 3% or less. With respect to the largest percentage of acres damaged of each commodity, pecans were the largest (21%), with oats, pasture, sorghum, and hay all in the teens (ranging from 13-16%).
Table 3. Lost Commodity Value by Commodity Type- Statewide Losses 2013
|
VARIABLE |
% of Acres Damaged |
Per Acre Damage $ |
Study Estimate Losses $ |
Statewide Estimate $ |
Farm Gate Value |
% Losses of Farm Gate Value |
|
SOYBEANS VALUE |
5% |
$248.15 |
$1,480,469.00 |
$14,612,988.72 |
$773,443,391.00 |
1.89 |
|
CORN VALUE |
5% |
$271.45 |
$693,139.00 |
$8,476,515.56 |
$735,472,192.00 |
1.15 |
|
RICE VALUE |
4% |
$375.02 |
$720,406.00 |
$6,817,541.93 |
$494,415,302.00 |
1.38 |
|
HAY VALUE |
14% |
$206.07 |
$466,636.00 |
$9,967,049.53 |
$155,882,160.00 |
6.39 |
|
COTTON VALUE |
3% |
$180.02 |
$72,007.00 |
$621,146.39 |
$147,816,799.00 |
0.42 |
|
WHEAT VALUE |
8% |
$170.24 |
$190,666.00 |
$3,170,691.89 |
$107,206,287.00 |
2.96 |
|
PECAN VALUE |
21% |
$90.03 |
$35,291.00 |
$416,397.23 |
$7,771,980.00 |
5.36 |
|
SUGARCANE VALUE |
1% |
$415.93 |
$82,769.00 |
$1,496,419.14 |
$454,959,052.00 |
0.33 |
|
SORGHUM VALUE |
16% |
$102.90 |
$255,124.00 |
$1,775,686.28 |
$55,133,118.00 |
3.22 |
|
OATS VALUE |
14% |
$270.43 |
$14,062.00 |
$134,688.46 |
$1,168,416.00 |
11.53 |
|
PASTURE VALUE |
13% |
$17.46 |
$21,523.00 |
$3,808,055.82 |
n/a |
n/a |
|
TIMBER VALUE |
4% |
$35.00 |
$68,110.00 |
$1,546,483.00 |
$420,097,000.00 |
0.37 |
|
TOTALS |
n/a |
n/a |
$4,100,206.00 |
$52,843,663.95 |
$3,353,365,697.00 |
1.58 |
Table 4. Damage Estimates associated with Feral Hog Activity (non-production losses) in 2013
|
DAMAGE TYPE |
Percent of Farming Operations Reporting Damage |
Minimum individual damage reported |
Maximum individual damage reported |
Average Damage Reported by Farm |
Total Economic Damage Reported Across All Operations |
Statewide Economic Damage Estimate |
|
REPLANTING |
8% |
$15.00 |
$35,000.00 |
$3,418.43 |
$348,680.00 |
$6,263,415.90 |
|
REDISCING |
8% |
$5.00 |
$13,000.00 |
$1,402.46 |
$140,246.00 |
$2,519,269.89 |
|
DAMAGE to PETS |
1% |
$173.00 |
$500.00 |
$61.27 |
$674.00 |
$12,107.21 |
|
DAMAGE to WILDLIFE PLOTS |
9% |
$25.00 |
$5,000.00 |
$633.42 |
$72,843.00 |
$1,308,494.91 |
|
DAMAGE/ CONSUMED FEED GRAIN |
3% |
$60.00 |
$20,000.00 |
$2,219.76 |
$91,010.00 |
$1,634,832.74 |
|
DAMAGE TO LIVESTOCK |
1% |
$100.00 |
$10,000.00 |
$1,016.67 |
$12,200.00 |
$219,151.30 |
|
DAMAGE to PASTURE |
7% |
$50.00 |
$18,000.00 |
$1,428.67 |
$128,580.00 |
$2,309,710.96 |
|
LOSS of STORED COMMODITIES |
1% |
$200.00 |
$6,250.00 |
$613.64 |
$6,750.00 |
$121,251.74 |
|
DAMAGE to FARM EQUIP. |
2% |
$100.00 |
$10,000.00 |
$1,195.00 |
$35,850.00 |
$643,981.47 |
|
DAMAGE to FENCE |
3% |
$50.00 |
$2,000.00 |
$342.44 |
$13,355.00 |
$239,898.82 |
|
DAMAGE to STOCK PONDS/TANKS |
2% |
$100.00 |
$5,000.00 |
$1,002.59 |
$29,075.00 |
$522,280.65 |
|
DAMAGE to LANDSCAPE |
3% |
$100.00 |
$3,000.00 |
$545.59 |
$18,550.00 |
$333,217.75 |
|
DAMAGE to NATURAL WATERS |
2% |
$50.00 |
$10,000.00 |
$808.33 |
$19,400.00 |
$348,486.49 |
|
DAMAGE DRAINS/LEVEES |
7% |
$100.00 |
$8,000.00 |
$1,365.66 |
$113,350.00 |
$2,036,131.10 |
|
LOST HUNTING LEASE |
2% |
$150.00 |
$10,000.00 |
$1,176.32 |
$22,350.00 |
$401,477.99 |
|
OTHER |
4% |
$60.00 |
$30,00.00 |
$2,228.50 |
$133,710.00 |
$2,401,862.28 |
|
TOTAL COSTS |
n/a |
n/a |
n/a |
n/a |
$1,186,623.00 |
$21,315,571.20 |
Using equation 3 and the total non-production related losses of approximately $1.1 million dollars, statewide estimates were around $21 million dollars. Costs incurred (or dollar losses not related to lost production) indicate that replanting costs were by far the largest (29% of all non-commodity damage reported). Relatedly, the second largest was re-disking costs (11%). Damage to pastures and levees also accounted for approximately 10%, respectively. Total damage losses were tabulated to be approximately $1.1 million dollars ($21.3 million in statewide losses).
Summary Conclusion and Discussion
The purpose of the study was to quantify the economic impact of feral hog activity in the state of Louisiana. Using data collected for the 2013 calendar year, findings suggest that losses from commodities and other damage were roughly 5.2 million dollars annualized (Tables 3 and 4). These numbers only represent those reported by respondents to the survey. The expected impact statewide is much larger if those numbers are extrapolated to all commodity producers in the state. A working number at this time is approximately 74 million dollars. This number would not include losses associated with state and federal lands or other public areas within the state, nor does it include private lands (non-farms), this is strictly related to farming operations, therefore this total is thought to be a conservative estimate.[17]
Referring back to the population growth estimates for feral hogs, a doubling in 5 years, indicates that the economic impact on agricultural producers, as a whole, could be quite devastating. It is clear from the survey results that while feral hogs appear to still be affecting small percentages of agricultural producers, at this time, those that are affected have significant losses from feral hog activity. Conservatively, it forecasts a problem of several hundreds of millions of dollars for Louisiana if feral hog activity proceeds unabated.
These losses represents a large enough economic loss that it should be considered a priority for state and federal policymakers to formulate prescriptions in order to mitigate these populations. As a result, public and private policy options should be cultivated to help stakeholders anticipate, recognize, evaluate, and control the impact of this invasive species going forward.
One perceived weakness of this research is that we do not have a clear understanding of the distribution of feral hog populations in the state. Given this, readers may infer that extrapolating the study estimates to statewide numbers is a flawed approach. This was the purpose of testing response bias in our survey statistics (see tables 1 and 2). As we are estimating the impact to agricultural producers in the state, our sample statistics do indicate that our sample is representative of the entire population of agricultural producers in Louisiana for 2013, therefore we feel any averages are appropriate for assessing damage related to feral hogs. However, we would caution anyone against using our estimates in other ways (i.e. per-hog damage estimates) as those population dynamics are unknown to us at this time.
References
Armstrong, J. Scott and T.S. Overton. 1977. Estimating nonresponse bias in mail surveys. Marketing Papers.
Bruner, G. C., James, K.E., & Hensel, P.J. 2001. Marketing Scales Handbook, A compilation of Multi Item Measures Volume III. Chicago. American Marketing Association.
Campbell, T. A. and D. B. Long. 2009. Feral swine damage and damage management in forested ecosystems. Forest Ecology and Management, 257: 2319-2326.
Chavarra, P. M., R. R. Lopez, G. Bowser, and N. J. Silvy. 2007. A landscape-level survey of feral hog impacts to natural resources of the Big Thicket National Preserve. Human-Wildlife Conflicts ,1: 199-204.
Churchill, G. A., Jr. 1987. Marketing Research, Methodological Foundations. Chicago, Illinois: The Dryden Press, 756-777.
Dillman, D.A. 2000. The Tailored Design Method. New York, NJ: John Wiley & Sons, Inc.
Engeman, R.M., B.U. Constantin, S.A. Shwiff, H.T. Smith, and J. Woolard. 2007. Adaptive and economic management methods for feral hog control in Florida. Human-Wildlife Conflicts 1(2):178-185.
Faraway, J.J. 2005. Extending the Linear Model with R: Generalized Linear, Mixed Effects and Nonparametric Regression Models. Chapman and Hall Publishers, pp. 312.
Kaller, M. D., and W. E. Kelso. 2006. Swine activity alters invertebrate and microbial communities in a coastal watershed. The American Midland Naturalist 156: 165-179.
Kaller, M. D. and W. E. Kelso. 2003. Effects of feral swine on water quality in a coastal bottomland stream. Proceedings of the Annual Conference of the Southeastern Association of Fish and Wildlife Agencies 57: 291-298.
Kaller, M.D., J.D. Hudson III, E.A. Achberger, and W.E. Kelso. 2007. Feral pig research in western Louisiana: Expanding populations and unforeseen consequences. Human-Wildlife Conflicts 1: 168-177.
Kaller, M.D. and D.R. Reed. 2010. Invasive feral swine in Louisiana. Louisiana Agriculture 53: 16-18.
Kotanen, P. M. 1995. Responses of vegetation to a changing regime of disturbance: effects of feral pigs in a California coastal prairie. Ecography 18: 190-199.
Lynn, B. 2008. Texas Funds Hog Control. Outdoor Life 215(7): 14.
Mengak, M. 2012. Georgia wild pig survey final report. Warnell School of Forestry and Natural Resources. University of Georgia, Athens, Georgia.
Pimental, D. 2002. Biological Invasions: Economic and Environmental Costs of Alien Plant, Animal, and Microbe Species. CRC Press.
Seward, N.W., K.C. Ver Cauteran, G.W. Witner, and R.M. Engeman. 2004. Feral swine impacts on agriculture and the environment. Sheep and Goat Research Journal. Vol. 19 pp. 34-40.
Shi, W., B. Zheng, Y. Zhang, and S. Ditchkoff. 2010. Economic estimate of wild pig damage to farm land owners in Alabama. Proceedings of the 2010 international wild pig symposium. 11-13 April 2010, Pensacola, Florida.
Timmons, J.B, B. Alldredge, W.E. Rodgers, J.C. Cathey. 2012. Feral Hogs Negatively Affect Native Plant Communities. SP-467.
Timmons, J.B, B. Higginbotham, R. Lopez, J.C.Cathey, J. Mellish, J. Griffin, A. Sumrall, and K. Skow. 2012. Feral Hog Population Growth, Density and Harvest in Texas. SP-472.
United States Environmental Protection Agency. 2009. Review of zoonotic pathogens in ambient waters. EPA 822-R-09-002.
USDA NASS. 2012. Census of Agriculture, Ag Census Web Maps. Available at:
www.agcensus.usda.gov/Publications/2012/Online_Resources/Ag_Census_Web_Maps/Overview/.
US Bureau of the Census. 2012. Statistical Abstract of the United States. US Bureau of the Census, (13th Ed.) Washington, DC, 2012.
[1]www.caller.com/sports/outdoors/less-expensive-way-to-control-texas-feral-hog">www.caller.com/sports/outdoors/less-expensive-way-to-control-texas-feral-hog
[2]www.extension.org/pages/64381/feral-hog-behavior#.VfBNZBG6eM8">www.extension.org/pages/64381/feral-hog-behavior#.VfBNZBG6eM8
[3]www.extension.org/pages/63656/natural-predators-of-feral-hogs#.VfBNkhG6eM8">www.extension.org/pages/63656/natural-predators-of-feral-hogs#.VfBNkhG6eM8
[4]www.thetowntalk.com/story/news/local/2014/08/13/feral-hog-population-growing-rapid-rate/13978629/" style="line-height: 20.8px; font-family: sans-serif, Arial, Verdana;">www.thetowntalk.com/story/news/local/2014/08/13/feral-hog-population-growing-rapid-rate/1397862
[5] www.extension.org/pages/64381/feral-hog-behavior#.VjPGlbfnu01">www.extension.org/pages/64381/feral-hog-behavior#.VjPGlbfnu01
[6]www.extension.org/pages/63623/feral-hogs-and-agricultural-crops#.VfCQ4RG6eM8">www.extension.org/pages/63623/feral-hogs-and-agricultural-crops#.VfCQ4RG6eM
[7] These included all commodities that had either 1 M in farm gate value and/or 1,000 acres planted for the 2013 calendar year.
[8] This publication is developed annually by the LSU AgCenter and provides parish and state level estimates of the number of acres harvested, average yield per acre, total production, and total farm gate value for every major and minor commercially grown commodity in the state. http://www.lsuagcenter.com/agsummary/Data.html
[9] One issue is that the 2013 yield estimate is that it already has the damage factored into estimate. Further, using the state averages for price and yield ignores regional differences. Lastly, using a single year may bias the results due to non-typical results. So using a five year average may be more appropriate.
[10] Acreage for Pasture were USDA NASS, 2012 Census of Agriculture, Further we cannot calculate a farm gate value for pasture as those data are not available in the LSU AgCenter Ag Summary.
[11] This impact reflects only losses associated with yield reductions and does not reflect any potential impacts from any quality losses that might had been experienced.
[12] The results of equations 2 are summarized in Table 1.
[13] The results of equation 3 are summarized in Table 2.
[14] The agricultural census counts such as farms if they did sell at least $1,000 worth of farm products (U.S. Bureau of the Census, 2012).
[15]The variables from the survey under analysis in this article are distributed in a negative binomial distribution. In layman’s terms this simply means that over all the observations, the majority are close to zero while a few within the sample are larger numbers. Additionally no statistically significant difference was found between round 1 and round 2 responses for the variables tested except
[16] Please note that these losses were only those reported in the sample, not estimates for statewide losses.
[17] Public land areas, which contain fragile and threatened plants and animals, along with a multitude of hunting opportunities are not captured in the survey results but make up over 2,000,000 of the acres in the state (US Census 1991). Nor does this account of lawns and yards in rural and suburban locations, areas most likely to experience hog activity if populations continue to grow.