Journal of the NACAA
ISSN 2158-9429
Volume 8, Issue 2 - December, 2015
Surveying Soil Health with the Solvita CO2 Respiration Test
- Sciarappa, W., County Agent II, Rutgers NJAES Cooperative Extension of Monmouth County
Quinn, V., Program Associate, Rutgers NJAES Cooperative Extension of Monmouth County
Murphy, S., Director, Rutgers Soil Lab, Rutgers, The State University of New Jersey
Barresi, R., Program Assistant, Rutgers NJAES Cooperative Extension of Monmouth County
ABSTRACT
A two-year pilot study surveyed soil respiration in a diversity of agricultural systems in Central New Jersey having sandy loam soils. Carbon Dioxide production from soil life was measured by the Solvita® CO2 aerobic respiration test with newly trained county extension staff. Measurements of carbon dioxide were consistent for each respective site seasonally and year-to-year to serve as an emerging indicator of soil health. Soil test results were characterized as marginal to moderate in less fertile areas and medium to ideal in more fertile areas. Fertile soils growing perennial crops as organic blueberries, equine pasture, bio-energy grass or residential lawns averaged 40.1, 23.9, 22.1 and 21.6 CO2-C ppm. This rapid, high-tech soil respiration test provides a simple quantitative and inexpensive means to assess soil health and measure changes due to farming practices over time.
Introduction
Our study in the central New Jersey area surveyed local soils in 2013 and 2014 that are nearly level and well drained. Their surface layer is classified as loamy sands, sandy loams or loams, while the sub-soil is sandy loams and sandy clay loams (Jablonski & Baumley, 1989). Fertilizer recommendations are typically based upon a chemical laboratory analysis and estimated crop needs over the growing season. What is not typically measured is the ability of farmland soils to biologically produce their own nutrients such as carbon and nitrogen through mineralization by soil microbes. Maintenance of the chemical and biological “health” of the soil is a goal of high yielding, sustainable land management.
Soil mineralogy and physical soil texture (percentages of sand, silt, and clay) are intrinsic properties that affect a soil’s ability to function and are not easily altered. Dynamic characteristics of soil quality are soil pH and nutrient status, which are commonly managed by soil amendments (Murphy, S. 2012). A “healthy” soil can produce considerable “biological” nitrogen and other plant nutrients through the decomposition and mineralization process via an abundant microbial population. Organic matter decomposition is the primary nitrogen source in natural (unfertilized) ecosystems and is essential for nutrition of non-legume plants.
Standard fertility assessments involve field sampling with soil probes and chemical analysis of macro and micro nutrients. Fertilizer recommendations are then based upon current soil nutrient levels except for nitrogen which is estimated through crop needs. The ability of a soil to biologically produce its own crop nutrients such as nitrogen over the growing season is rarely measured due to a lack of economical, practical and/or accurate testing equipment. Measurement of soil respiration CO2 derived from micro and macro organisms is a potentially important tool to predict availability of nitrogen, the essential element not measured in routine soil tests. To be able to accurately credit nitrogen and other nutrients from dynamic natural organic matter mineralization against the suggested static total fertilizer recommendation would be a valuable contribution to economical and sustainable farming.
Objectives
The objectives of this investigation were to:
- Arrange laboratory training for extension staff, acquire equipment for extension office operation and determine the feasibility of conducting such soil analyses in-house rather than outsourcing to a commercial laboratory.
- Begin a baseline survey for Central Jersey farm soils to compare carbon flux seasonally and estimate potential N mineralization for adjustment of future fertilizer recommendations.
- Financially assess equipment and supply expenses.
Methods
Training & Equipment
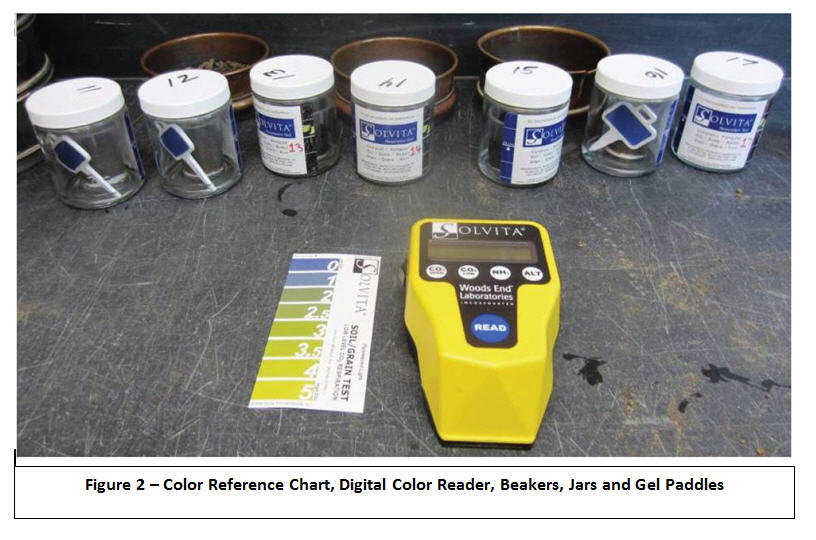
The Extension Agent, Agricultural Program Associate, three Program Assistants and one student intern were trained by the Rutgers University Soil Lab Director Dr. Stephanie Murphy. Four hundred soil test kits and supplies were purchased included a digital color reader, beakers, filters and gel paddles from the Solvita® company – a Division of Woods End Laboratories, Inc.
Sampling Process
In 2013 and 2014, 18 representative soil sites were selected in Monmouth County, NJ; primarily farms having sandy loam soils with pH values ranging from approximately 5.1 to 6.3 and typical organic matter from 1.0 to 2.0%. Seventy-four crop fields were GPS/GIS mapped and sampled at the same location in spring, summer and fall. Six study groups of local horticulture were constructed with three replications each. These categories were artificial golf greens, annual crops, perennial fairways, residential lawns, perennial grass crops and organic blueberry. Representative types of plant production in the county included sweet corn, pepper, tomato, field corn, blueberry, equine pasture, bio-energy grass, residential lawns and golf courses.
Soil probes were inserted 6 inches deep with eight sub-samples per field location totaling 287 individual soil samples combining years 2013 and 2014. The same depth in soil sampling for chemical analysis was used to better correlate biological test results from the same soil profile. Samples were returned to the extension office lab having a range of 30 to 60 % field moisture, spread out in an aluminum pan and allowed to air dry for 5 to 7 days at 70° F. down to approximately 5% moisture as measured by a Rapitest moisture meter (Lusterleaf® model 1820).
The microbial respiration derived from organic matter decomposition from the soil food web was measured during the main growing season by the Solvita® CO2 respiration test over a nine month period (March through November) reflecting 95+% of yearly crop growth. From December through February soil temperatures drop considerably leading to senescence, cessation of plant growth, winter dormancy and frozen soils.
Solvita® Technology
Solvita® is a patented environmental measurement system with applications for soil, compost, manure and grain. One type measures carbon dioxide (CO2) in a low and high range, and the other type is for ammonia (NH3) – (Haney and Brinton 2008). Thin-gel technology assesses a component of soil health by measuring CO2 emissions from soil which are primarily due to microbial respiration. The level of microbial activity is indicative of the amount of active organic matter that is being broken down and nutrients being released. The CO2-Burst Lab Method (Haney-Brinton Protocol) uses a drying-rewetting method to associate soil health with a soil’s mineralization capacity to release nutrients (Solvita® Guidelines, 2013). (Figure 1). Soils with more biological activity may be considered healthier in terms of providing additional nutrients for plant growth.
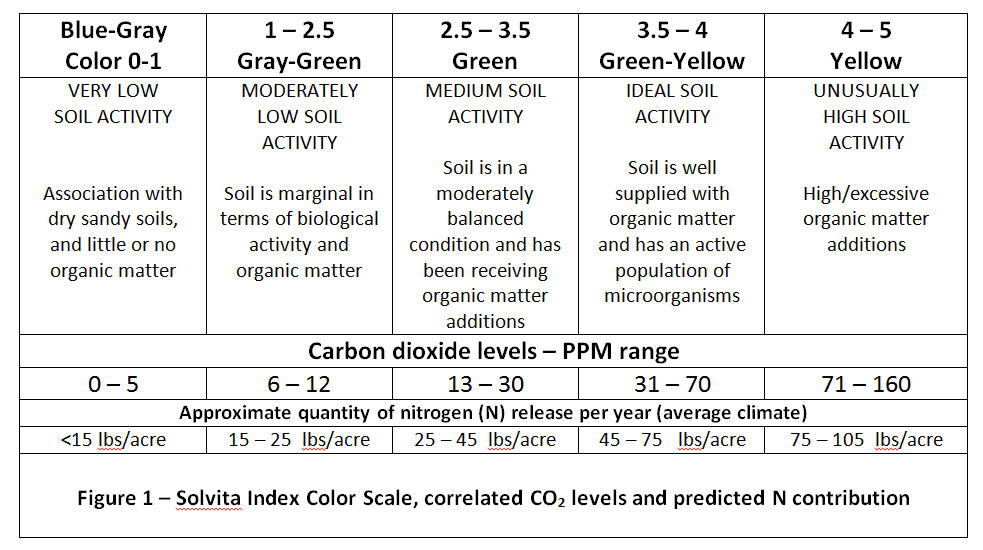
Under controlled conditions, a standard 40 gram soil sample (sieved, ground & dried) is analyzed to measure respiration (production of CO2 by biological metabolism) that reveals the relative activity of soil microorganisms. The soil sample is placed in a container with holes in the bottom to allow water to wick up. Placed in an air-tight jar, a paddle with a CO2 – absorbing gel is inserted with the soil to absorb the product of soil respiration within the jar as the microbes are revived with the re-wetting step and become biologically active (Franzluebbers, et. al. 2000). The pre-calibrated CO2 – absorbing gel changes color as the concentration of CO2 increases, and so correlated color calibrated to amount of CO2 can be measured. After a 24 hour period of incubation at 70° F., the paddle (gel) is read with a digital color reader or compared to color charts to determine the CO2 production by soil microbes – Figure 2; (Brinton, et. al. 2007). This burst is proportional to microbial biomass and their potential mineralization to active carbon, nitrogen, and phosphorus. The correlated color scale of zero to five indicates the level of total CO2 burst from 5 – 160 ppm. Basically, a color reading of 2 is ≤ 12 CO2 – C a low soil health/N rating while a rating of 3 is ≥ 30 CO2 – C ppm – a moderate rating. Potential N mineralization for these microbial respiration levels is predicted as 15 – 25 and 25 – 45 lbs./acre/year, respectively. (Ward Laboratories, Inc. 2014.)
Results
Results are reported following the three section Objectives:
Training and Laboratory Processes - Transition of this laboratory setup to our county agricultural building was found feasible and practical. Solvita® equipment was set-up within a small space in an extra room in the extension office. Training staff was straightforward and easily implemented. A Powerpoint presentation was made of the process steps to insure standard methods. The 0 to 5 color value index for soil CO2 rate was simple to use and understand. The digital color reader was more accurate and not subject to normal human error. Extension offices may opt to save this expense and just use the visual estimate from the color code scale.
Extension staff was able to incorporate this biological sampling method within a standard chemical soil test program to survey a diversity of county cropping systems and soils. Notes were taken of production systems, horticultural practices and soil amendments as reported by the growers.
Baseline Measures – In this temperate growing zone 7A, soil temperatures for the spring at 4 inches depth ranged from 55° to 64°F., 65° to lower 80’s in the summer and fall with 20 – 40° F. in the winter. There was no significant difference in comparing the yearly cumulative CO₂ results of 2013 to 2014. The first year average for all color values was 2.41 with a standard deviation of 0.69 while the second year average was 2.50 with a standard deviation of 0.51. Similarly, the CO2 respiration values using the digital colorimeter showed no statistical difference between the respective values of 22.02 and 20.45 CO2-C with a standard deviation of 13.85.
In comparing seasonal variation in NJ sandy soils from spring through summer and fall, microbial CO₂ output only rose slightly compared to previous data from Pennsylvania which had much wider changes. Pennsylvania climate in a cooler growing zone 6A has 10° F. colder average air temperatures in winter. Soil systems may be slower to mineralize both in early spring and late fall with a significantly higher summer peak. Such differences may be attributed not only to air and soil temperatures but higher organic matter, soil type and structure.
As seen in Figures 4 and 5, the six categories of crops showed significant differences in increased respiration in both color value and carbon dioxide output. Slight differences were noted between the visual reader scale of 0-5 for gel color versus using the expensive yet more accurate colorimeter measuring parts per million. Both CO2 respiration and the correlated color value are provided because an extension technician may only have a visual color chart available for reference and not have purchased the $900 digital colorimeter, which provides greater precision in both color measurements and CO2 levels.
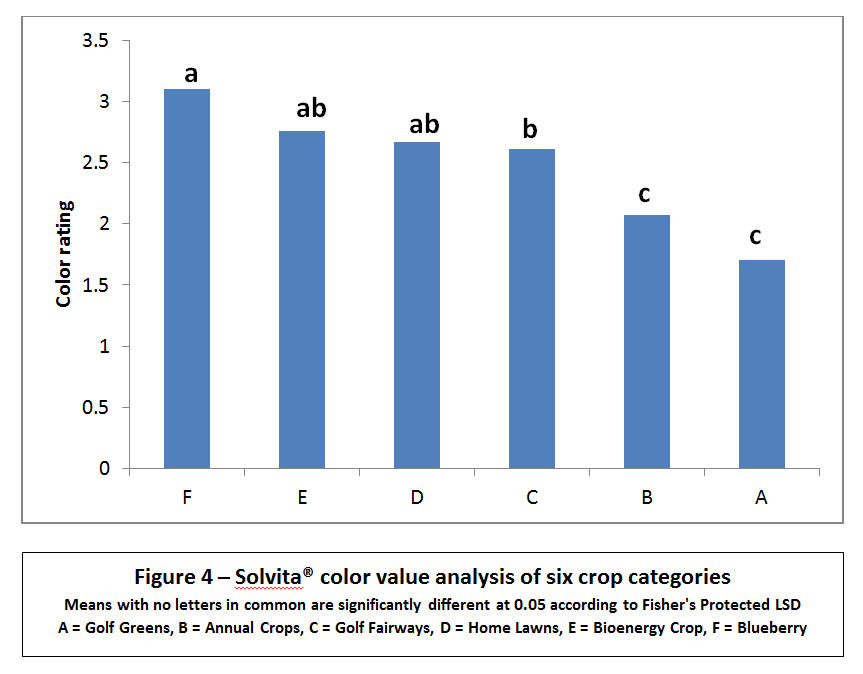
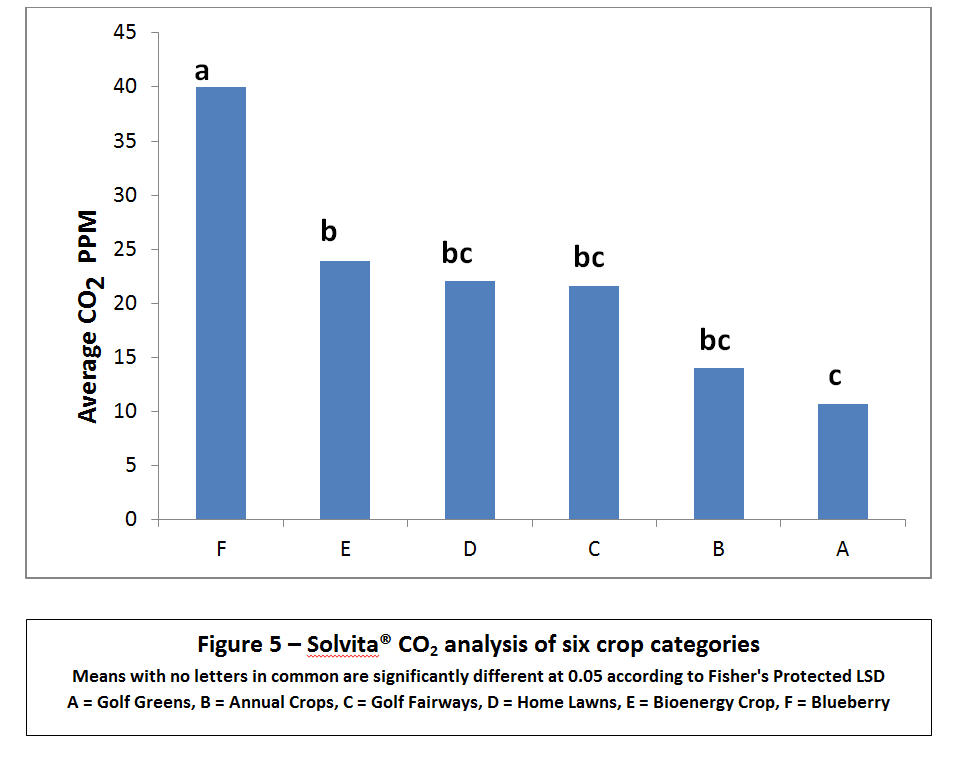
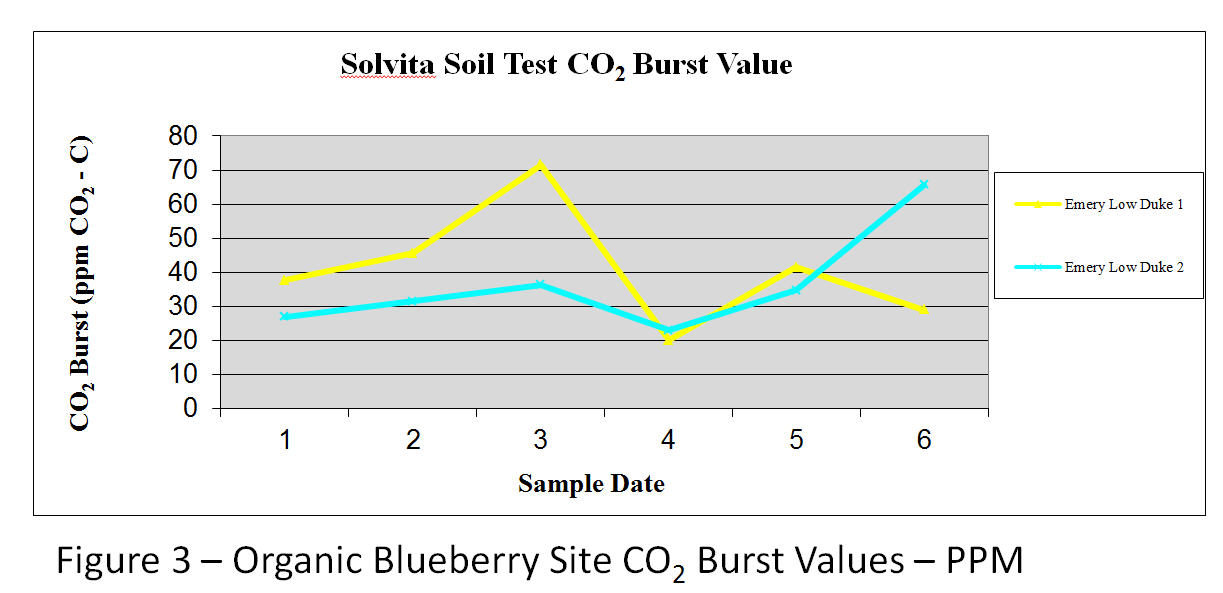
The artificial golf greens with ¼ inch cut bent grass and an artificial sand medium had significantly lower soil health ratings both in color value – (1.7) and CO₂ production (10.64 ppm CO2-C). Similarly, annual food and feed crops were also lacking in microbial biomass/soil respiration (2.1 visual color scale and 14.1 ppm CO2-C). Perennial fairways, residential lawns (bluegrass/fescue) and a bio-energy crop (Miscanthus gigantecus) ranked in the middle of the categories while well-established organic blueberries ranked highest in soil health (3.1 color scale and 40.1 ppm CO2) – Figure 3.
There was a trend in most annual crop sites where early spring color values averaged approximately 2.0 with a small increase to 2.4 in the summer and to 2.7 in the fall. These initial values translate to low-moderate activity rising to moderate-medium activity by the season’s end. On the other hand, perennial crops with no tillage and more compost applications were significantly higher earlier and later in the season; ranging from an average of 2.61 to 3.10 (moderate to optimum activity). In comparing all 287 sample values in 18 separate farming systems, six replications had peak color ratings which indicated ideal microbial activity and soil health. These highest peak results were achieved in two organic blueberry farms, an equine pasture, a bio-energy demonstration and one residential lawn – 4.53 and 4.06, 4.37, 4.27, and 3.55 on the color scale, respectively. Correspondingly, six of these replications had the highest CO2 – C production, ranging from 45.54 to 108.02 ppm. The main distinction of these six site categories was perennial cropping where no tillage was used leaving soil undisturbed along with standard practices of “feeding the soil” with composted amendments or mowing mulch on a regular basis.
These measures of CO2 serve as a potential indicator of an unmeasured nutrient contribution in these sandy loam soils. With the estimated correlation of CO2 carbon flux to potential nitrogen contribution, additional N production predicted for the annual crops category ranged from about 10 to 15 lbs. per acre for annual crops and 20 to 35 lbs. per acre for perennial crops (Figure 1).
Finances - Expenditures for supplies and equipment from the first purchase totaled $2,724.20 in 2013 for 12 beakers and jars, filters, 200 gel paddles and a digital color reader. Equipment and material costs were $13.62 per sample (not including time and labor costs). Without purchasing the digital color reader, individual sample costs would have been $9.12. When our continuing projects fully expend the second 200 sample purchase in 2016 using the same digital color reader; the cost per sample drops to $10.94 per sample. Using the manual color reader chart without the digital reader; a four year cost for 400 samples would be a total of $3,301.00 at $8.51 per sample. At this number of samples, the cost saving of $2.43 per sample without the digital reader may not be worth the savings in time, labor and accuracy.
Discussion
Standard agricultural management practices at the Freehold farm fields were followed in 2013 – 2014; the tomatoes followed over-wintered soybean stubble, the field corn followed wheat stubble and the sweet corn followed rye stubble. All cover crops were plowed in early spring before planting annual crops – a good rotational program with frequent soil tillage. Nonetheless, farm soil respiration was measured as relatively low.
In the perennial grass sites, significant differences at the golf courses were determined between the sandy artificial soils of the low-cut greens with very high amounts of agri-chemicals compared to the native soils of the fairways with higher mowing regimes and lower amounts of fertilizer and pesticides. While the high maintenance, constructed golf course greens represent a potentially negative environment for beneficial soil microbes; the lower maintenance golfing fairways, residential lawns, naturalized equine pastures represent a potentially positive environ. Similarly the distinct gradients of microbial CO₂ respiration values and associated biomass from the other perennial grass categories reveal and correlate with differing agricultural practices.
Comments & Conclusion
Our pilot soil survey with the Solvita® soil respiration test in sandy loam soils has accurately measured active carbon and microbial biomass that have been correlated with potential nutrient release over the growing season. This low-cost, high-tech soil test provided a simple and quantitative means of evaluating an important component of soil health that can be used in conjunction with standard soil lab testing. Seasonal sampling may be utilized to measure any changes in management practices over time; such as cover cropping, tillage systems, municipal leaves, compost applications, chemical fertilizers and organic soil amendments.
These consistent results in central New Jersey over two years show promising implications for agronomy and horticulture. Farmers, advisors, extension agents and agricultural specialists may be able to add a new assessment method into their technical toolbox in at their home base. Further research and demonstration work will use this regional baseline information to compare nutrient recycling from microbial metabolism of organic matter application and predict subsequent nitrogen release that contributes to crop nutrition and yield on a site by site basis. This “new” source of nutrient availability has the potential for growers with biologically healthier soils to reduce the amount of fertilizer application and advisors to reduce N rates; yet expect the same yield, reduce expenses and avoid excessive nutrient runoff.
Literature Cited
Brinton, W.,R. Haney, E. Evans 2007. Simplified Approach to Measuring Soil CO₂ Respiration: Comparison of chemical filtration, CO₂ IRGA analysis and the Solvita® Gels. Proceedings ASA – SSA – CSA Annual Meetings, New Orleans.
Franzluebbers, A.J., Haney, R., Honeycutt, C., Schonberg, H., and Hons, F. 2000. Flush of Carbon Dioxide Following Rewetting of Dried Soil Relates to Active Organic Pools. Soil Sci. Soc. Am. J 64:613-623.
Haney, R., W. Brinton 2008. Soil CO₂ respiration: Comparison of chemical titration, CO₂ IRGA analysis and the Solvita® Gel System. Renewable Agriculture & Food Systems. 23: 171-176.
Jablonski, C. F., Baumley, R. J. 1989. Soil Survey of Monmouth County New Jersey. Manual 170 pages. National Cooperative Soil Survey – US Department of Agriculture and Agricultural Experiment Stations.
Murphy, S. 2012. Restoring Soil Health in the Fields of Agriculture: Evaluating Soil Health with the Solvita® Soil Test. Proceedings NJ-ACTS Convention. Atlantic City, NJ.
Solvita® Official Solvita® Guideline – 2013. Soil CO2 Respiration Test www.solvita.com
Ward Laboratories, Inc. – Solvita® Soil Test Information (24 hr. CO2 burst) www.wardlab.com/solvita