Journal of the NACAA
ISSN 2158-9429
Volume 9, Issue 1 - June, 2016
Proven Strategies to Maximize Profits to Cow-Calf Producers
- Doye, Damona, Regents Professor and Rainbolt Chair of Agricultural Finance, Oklahoma State University Department of Agricultural Economics
DeVuyst, Eric, Professor, Oklahoma State University Department of Agricultural Economics
Lalman, David, Professor and Beef Cattle Specialist, Oklahoma State University Department of Animal Science
Raper, Kellie, Associate Professor, Oklahoma State University Department of Agricultural Economics
ABSTRACT
With beef calf prices returning from atmospheric levels, cow-calf producers will need to reduce production costs and increase per head sale revenue to maintain profitability. We provide a toolkit of low-investment practices that have been shown to improve profitability. We document the impact of each practice on costs and revenues on a per head basis and, where applicable, per bull basis. A link to a PowerPoint presentation is provided to easily allow extension educators to utilize this information.
Introduction
As beef calf prices have dropped off record highs in 2014 and early 2015, cow-calf producers’ profits are likely to also decline, leading to an immediate need to cut costs and increase revenues. The need for careful management through cost control and adoption of recommended practices becomes more critical. Producers with small herds in particular typically have lower adoption rates for common practices and yet benefit the most economically. Here, we offer a toolkit of methods proven to improve profitability regardless of herd size. These management tools do not require investment in capital-intensive handling facilities although some minimal infrastructure, e.g., head chute, may be necessary for some practices. We document the returns available for each practice and provide a link for extension educators to access a MS PowerPoint for use in programming.
Data from the Kansas Farm Management Association (KFMA) show that Kansas cow-calf producers on average earned positive returns over variable costs in all but 11 of the last 39 years (Pendell, Kim, & Herbel, 2015). However, these same producers earned positive returns above all costs in only six of those 39 years (figure 1). While numerous practices can improve potential returns, research from Oklahoma shows many producers fail to implement even some basic practices known to increase returns.
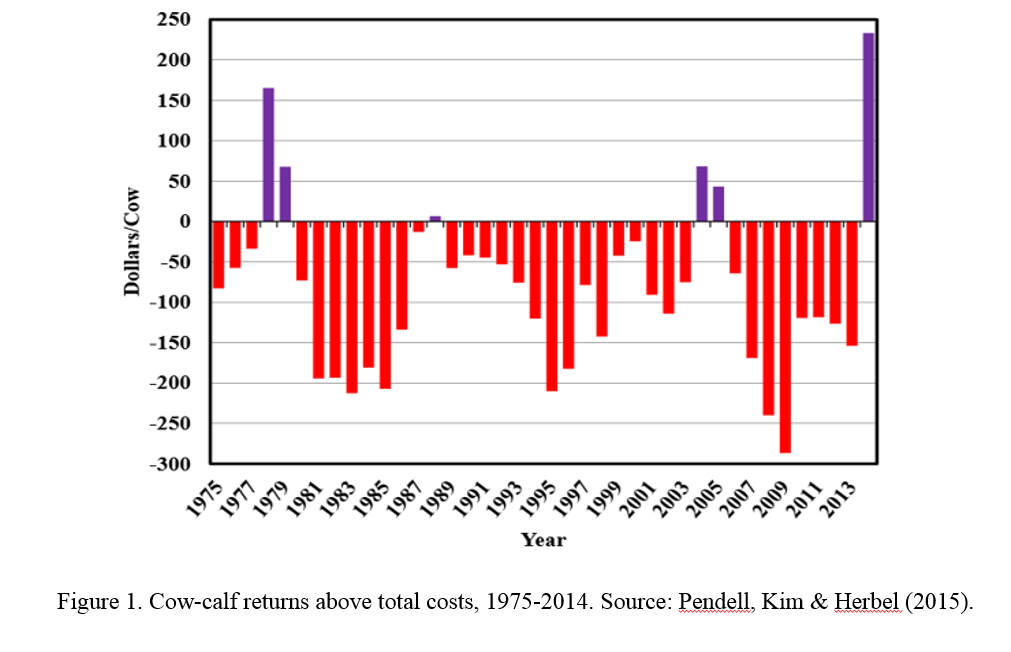
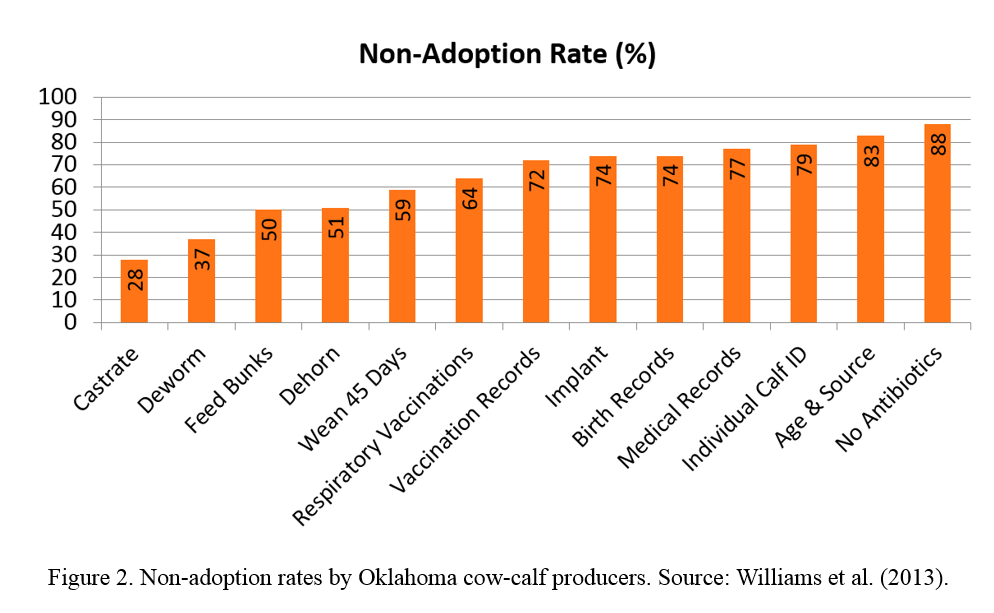
Figure 2 shows non-adoption rates of several practices. For example, 28% of Oklahoma producers are not castrating bull calves (Williams, Raper, DeVuyst, Doye, Peel, Lalman, & Richards, 2013). USDA National Animal Health Survey data (2008, p. 38) shows that nearly 23 percent of calves born alive during 2007 in the south-central section of the U.S. had or were expected to have horns. At auction, intact bulls and horned calves sell for discounts compared to steers and dehorned/polled calves. Our goal is to equip extension educators with the documentation needed to inform cow-calf producers of profit-making opportunities readily available.
The practices are sorted into breeding and cull cow practices, bull selection, feed management, value-added management, and other management practices. Ranges of price increases or cost reductions are presented, and when applicable, an estimate of increased returns is presented for each practice. For some value-added marketing practices, the probabilities of positive economic returns are reported. Research associated with each practice is referenced. Table 1 summarizes these profit-making opportunities for cow-calf producers.
| Value-added Practice | Price impact ($/cwt) | $/head (525 lb. calf) | Per 30 cows |
| Polled/dehorned | $3.15-$5.25 | $16.54-$27.56 | $496-$827 |
| Castration | $5.00-$10.00 | $26.25-$52.50 | $788-$1,575 |
| Lot size of 10 head | $5.18-$7.00 | $27.20-$36.75 | $816-$1,103 |
| Vaccination | $1.44-$6.69 | $7.56-$35.65 | $227-$1,070 |
| Weaned 45 days | $1.67-$5.23 | $8.77-$27.46 | $263-$824 |
| Vac-45 | $12.46-$15.54 | $65.42-$81.59 | $1,963-$2,448 |
| Implants | $27 | $810 | |
| Market cull cows later | $50 | ||
| Market cull cows bred | $140 | ||
| Bull selection | $42 | $220.50 | $6,435 |
| Moderate cow size | $27 | $810 | |
| Reduced hay loss | |||
| Hay ring type | 10-15% | ||
| Hay storage | $4-$6 per ton | ||
Breeding and Cull Cow Practices
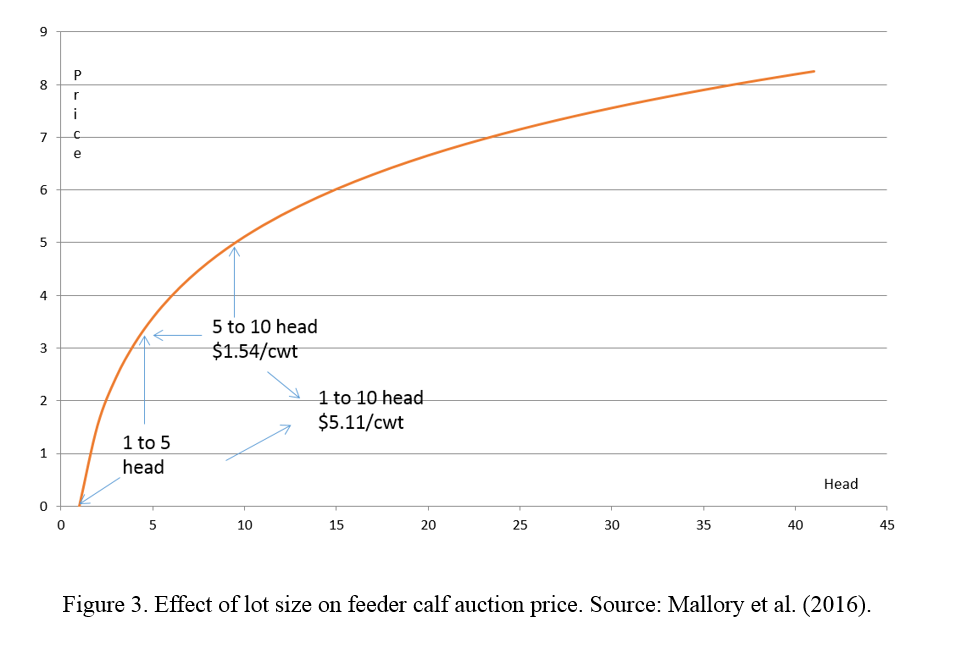
The benefits of a defined breeding season are well documented (see, for example, Ramsey, Doye, Ward, McGrann, Falconer, and Bevers, 2005). A relatively narrow calving window results in larger lots of homogeneous cattle for offer in auction barns or direct sale. Figure 3 reports the effect of lot size on sale price in selected Oklahoma auctions. The difference between a one-head lot and five-head lot was reported at $3.57 per cwt or $17.85 per head (Mallory, DeVuyst, Raper, Peel, & Mourer, 2016). The difference between a one-head lot and ten-head lot was $5.11 per cwt or $25.55 per head. Even small producers can readily implement a strategic calving window. By only allowing bulls access to breeding cows and heifers for a relatively short interval (45-60 days, for example), a relatively narrow calving season is achieved. Cows should be pregnancy tested at weaning. Cows that do not test positive for pregnancy at weaning should be culled at that time. An alternative strategy allows bulls to remain with the cow herd after the initial pregnancy test. Cows that did not test positive for pregnancy initially are palpated again before selling. Those that are bred can be sold as bred cows and the remainder sold as open cows. Regardless of approach, the objective is to have a cow herd that calves within a short time interval.
Mature cow size/weight is also known to influence profitability (Doye & Lalman, 2011). In comparison to moderate weight cows, bigger cows generate more revenue due to slightly heavier weaning weights and higher cull value. However, bigger cows also require more pasture acres per head, have higher maintenance cost, and their calves sell for less per pound than lighter weight calves. On both native and introduced pastures, Doye & Lalman (2011) found that moderate-framed cows return $2,690 and $3,700 more per 100 cow herd, respectively, per year to large-framed cows. Acton (2015) reported that smaller-framed cows return more per acre than larger cows in a study comparing spring and fall calving, native and introduced pastures, and Angus and Brangus cows. Over a four-year period (2011-2014) in Wyoming, Scasta, Henderson & Smith (2015) reported that smaller beef cows (1,000 lb.) weaned a higher percentage of body weight in comparison with heavier cows (1,200, 1,300, and 1,400 lb.). Smaller cows also required less forage per pound of calf weaned. Building a herd of moderate sized cows requires careful selection in cow purchases as well as careful selection of bulls if heifers are retained for replacements.
Cull cows have significant value for producers, representing 15-30% of annual revenue (Fuez & Hewlett, 2012). Opportunities exist to increase revenue from cull cows through changes in marketing strategies. Figure 4 shows that cull cow prices tend to bottom out in the fall when the majority of calves are weaned and culling decisions are made, then increase into early spring.
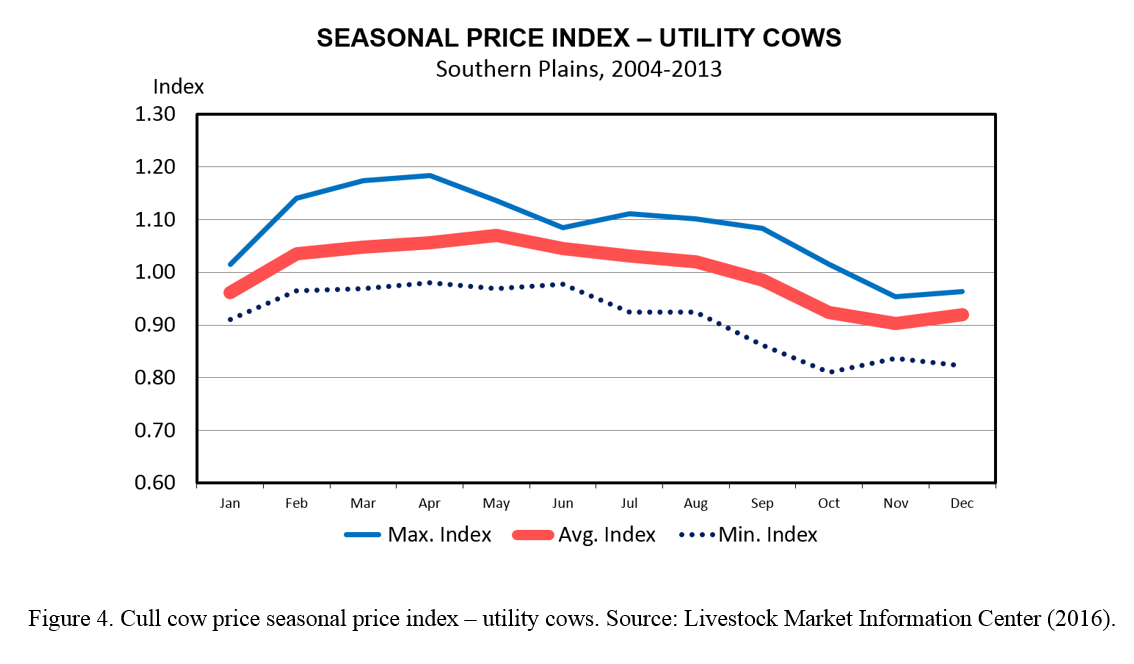
By shifting the cull cow sale date from November to March-April, producers may realize about a 10% increase in sale price. Cull cows placed on winter pasture and marketed in late winter or early spring months can return up to $60 per head more than an October sale (Amadou, Raper, Biermacher, Cook, & Ward, 2014). Highest returns were reported for cows that were thin to medium body condition score (BCS) in early fall (thin = BCS <5; medium = BCS 5-6) placed on native grass for 90-150 days. Retaining culls cows with BCS > 6 was typically not profitable. Additional value can be added by selling culls as bred cows (Amadou et al., 2014). Cows that test positive for pregnancy outside the desired calving window can be sold as bred cows adding $140 to sale revenue.
Bull Selection
As bulls represent 50% of a breeding herd’s genetics, the quickest improvements to phenotype in calves can be made through bull purchases. Sale lots of dehorned/polled calves earn $3.15-$5.25 per cwt more than lots with horned calves (William, Raper, DeVuyst, Peel, & McKinney, 2012; Mallory et al., 2016). The polled trait is dominant so using polled bulls adds to calf sale prices. At 30 calves per bull per year and 525 pound weaned calves, the value added by using a polled bull is $496 to $827 per year per bull.
Hide color has also been shown to influence sale price. Williams et al. (2012) reported that compared to black-hided calves, other hide colors earned discounts ranging from $1.21 per cwt for lots recorded as “black mixed” to $13.76 “Other.” More common hide colors including red, white/grey, and Hereford were discounted $2.91, $1.81, and $7.47, respectively, compared to black-hided lots of calves. So, using a black-hided bull adds value to calves.
Muscling has also been found to increase auction value of calves. Calves graded as No. 1 and 2 muscling earn from $10 per cwt (Williams et al., 2012) to $14 per cwt (Mallory et al., 2016). Assuming a 525-pound calf and 30 calves per bull per year, $1,575-$2,205 per bull per year is earned for adequately muscled calves.
When combined, bulls that sire polled, black-hided, and No. 1-2 muscled calves earn at least $2,262 per bull per year over bulls that sire horned, non-black-hided, and No. 2 and 3 muscled calves. At the opposite end of the price scale, calves that are dairy or Longhorn, horned, and No. 2 and 3 muscled earn discounts of almost $42 per cwt. At 525 pounds and 30 calves per bull, producers with bulls having traits less valued by the market leave over $6,435 per year per bull on the table. The investment in quality bulls is clearly worthwhile even for smaller producers.
Hide color is obviously related to breed, although many breeds have either selected for or bred in black hide color genetics. One breed, or rather species, that has significant discounts is Brahman. Lots of calves with visible Brahman influence were found to have price discounts of $3.48 per cwt (Williams et al., 2012). The cost to a producer with 30 head of 525 pound calves is $548 per bull per year. To avoid these lower prices, producers should select bulls with little visible Brahman phenotypical traits. Note that in southern climates in which Brahman-influenced cattle perform well, price discounts must be wighted against productivity losses.
Feed Cost Management
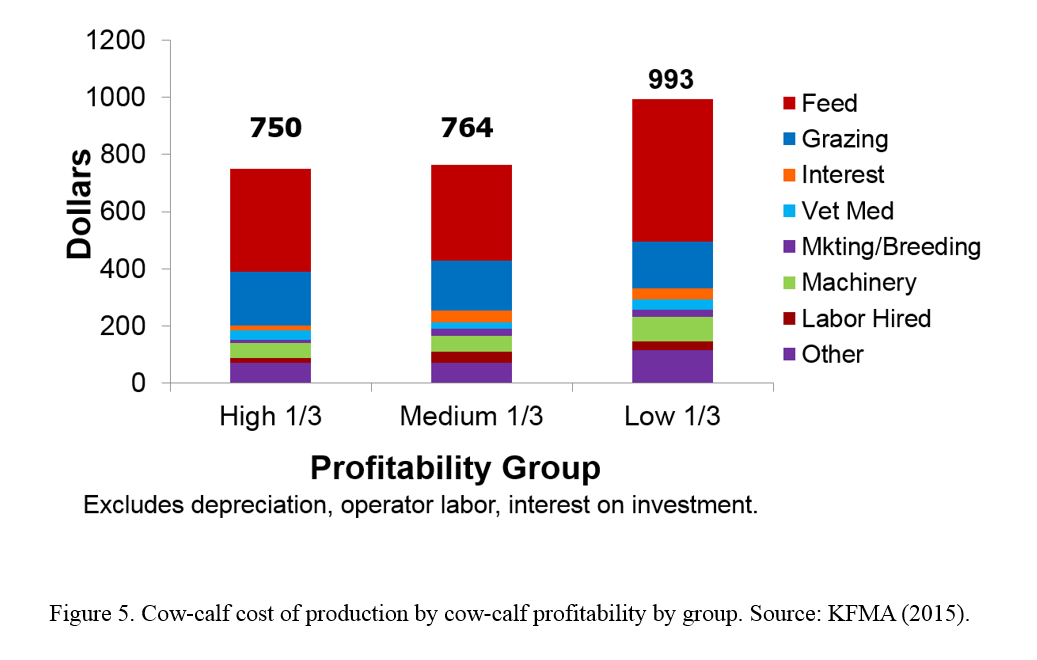
Costs of production vary widely among producers with a nearly $250 difference in operating costs between low and high profit producers (KFMA, 2015), with the largest determinant in the difference being feed expense (figure 5). The least profitable group of producers spent more on purchased feed (and less on grazing) than producers with the highest profits. Effective forage management requires matching herd size, cow mature weights, and milk production potential to available resources. Overgrazed pastures result in lower weaning weights and more purchased feed inputs. A forage management plan that includes fall-winter grazing and only 60-90 days of fed hay will likely result in higher profits. A comparison of other costs to benchmarks like KFMA by individual producers may point out other opportunities for improvement through cost control.
During fall and winter months when cows are fed hay, the type of bale feeder used has been shown to greatly affect feed waste and thus cost. At Oklahoma State University, four types of bale feeders were studied to measure hay wasted by beef cows (Sparks, Sexton, McMurphy, Mourer, Richards, & Lalman, 2013). Polyethylene pipe ring and open-bottom steel ring feeders had the highest percentage of hay lost at 20+%. Sheet bottomed steel ring feeders showed considerable improvement at 12.7% but modified cone feeders were superior with a mere 5.6% of hay wasted. While each of these bale ring feeders will reduce hay waste compared to no feeder, considerable savings are available by more judicious choice of feeders. This equates to feed savings even after accounting for the added investment in bale rings with additional features. In fact, the payback period may be less than one feeding season for modest sized herds.
Another source of hay loss is poor storage. Improperly stored round bales can lose up to 50% of dry matter (Doye, Sahs, & Huhnke, 2015, p. 114). In just nine months, uncovered round bales stored in the open at ground level lose 5-20% of dry matter where elevated bales lose 3-15% of dry matter. Covering bales reduces these losses to 5-10% and 2-4% for bales on the ground and elevated, respectively. While storing bales under a roof or in a barn reduce losses further, these options are not cost effective unless facilities are already in place. However, polyethylene tarps are an inexpensive means of covering bale stacks and add about $2.10 per bale or $4.20 per ton to hay cost (Doye et al., 2015, p. 115). Reducing hay loss by 10% with a polyethylene tarp would save $6 per ton in hay loss at $60/ton hay prices, justifying the cost of tarps on dry matter loss alone.
Other hay storage practices are even lower cost. Site selection and preparation can save up to 8 inches dry matter on the bottom of bales due to moisture absorption. Bales should be stored in a more elevated location and off the ground if possible. Used tires, pallets, fence posts, crushed rock etc. can be used to reduce contact with the ground (Doye et al., 2015). Orientation of bale rows from north to south, with bales in rows, tightly packed end-to-end, and at least three feet between rows also reduce losses by allowing adequate sunlight and airflow to quickly dry the area and bales following precipitation (Doye et al., 2015).
Value-Added Management and Marketing
Value-add management practices have been shown to increase both the price received for calves and producers’ net returns. Yet, only 12% of Oklahoma producers participate in some type of formal value-added production and marketing practices (Williams et al., 2013). Some practices require very little investment in infrastructure. For example, intact bull calves are discounted $5-$10 per cwt ($26-$52 per head at 525 lb.) at auction (USDA, 2008, p. 37). The only tools required for castration are a scalpel or bander. The cost of the procedure is typically under $0.50 per head. Williams et al. (2013) found that 72% of Oklahoma producers castrated bull calves; USDA (2008, p. 37) reported only 59.2% of all operations castrated any bull calves before sale. Calves should be castrated before four months of age and before weaning to avoid lost weight gains associated with late castration as well as lower stress, sickness and rates of death loss (see the 2016 American Veterinary Medical Association recommendations regarding welfare and safety). Low dose growth implants can then be used to promote weight gain while the calf is still nursing. Weaning weight can be increased by 19-21 pounds using implants (McMurphy, Sharman, Cox, Horn, & Lalman, 2010; Bayliff, Redden, McGee, Stansberry, Lalman, Corrigan, & Burdett, 2015). Implants cost $1-$2 per head and return $27 per head. However, USDA (2008, pp. 44-45) reports that only 9.8% of U.S. cow-calf producers use implants prior on any calves prior to weaning and 11.9% implant any calves prior to or at weaning.
In 2012, Williams et al. reported price discounts for horned calves at $3.15 per cwt. More recently, dehorning or using polled bulls adds $5.25 (Mallory et al., 2016) per cwt to auction price and $24 in cow-calf producers’ profits (Williams, DeVuyst, Peel, & Raper, 2014). Further, Williams et al. (2014) reported that probability of a producer earning a positive net return from dehorning calves was 56.3%. USDA data shows 12.4 percent of calves in the U.S. were expected to have horns in 2007 (2008, p. 32) (the 2016 American Veterinary Medical Association suggests local anesthetic and anti-inflammatory medication to reduce animal pain during/post this procedure).
Vaccination for Bovine Respiratory Disease, Bovine Rhinotracheitis Virus, Bovine Viral Diarrhea Virus, Parainfluenza Type 3 Virus, Bovine Respiratory Syncytial Virus, clostridial diseases, leptospirosis, and other diseases has been shown to increase sale price of calves. (Animal pharmaceutical companies often combine several of these into one vaccine so that fewer injections are necessary.) Williams et al. (2012) reported a $1.44 per cwt increase in sale price for calves that had been vaccinated. Williams et al. (2014) reported a premium of $6.79 per cwt for vaccinated calves and an average profit of $20 per head from vaccinating calves. The probably of a positive net return from vaccinating calves was reported to be over 61%. Williams et al. (2013) reported that only 36% of Oklahoma producers surveyed were using respiratory vaccines for calves.
Calves that have been weaned at least 45 days have also been shown to earn sale price premiums. Williams et al. (2012) reported $2.05 per cwt increased auction price for weaned calves. Williams et al. (2014) reported $5.23 per cwt premium, an expected net return from 45-days weaned of over $35 per head, and a 61% probability of positive net return. With only 41% of Oklahoma producers weaning calves prior to sale (Williams et al., 2013), weaning is an underutilized practice.
Putting together value-added management and marketing practices in a third-party verified program, called Vac-45, adds even more value. In addition to the price increases reported for vaccinating, weaning, dehorning, and castrating, Vac-45 premiums add another $12.46 (Williams et al., 2013) to $15.54 (Williams et al., 2012) to calf auction prices. According to Mourer (2013), less than 6% of Oklahoma calves were marketed as third-party Vac-45 in 2012.
Summary
Cow-calf producers are facing a tougher economic climate than the past few years. To maintain profitability, producers should consider implementing more recommended management practices as their individual resources allow. These practices have been proven to increase sale prices, reduce costs, and improve profits to cow-calf production without requiring significant capital investment. The practices are scale neutral and can be used by small-scale cow-calf producers. To assist agricultural educators at all levels, we include a PowerPoint that discusses these practices and each practice’s contribution toward potential improvement in prices, costs, and returns. The PowerPoint can be downloaded at http://www.agecon.okstate.edu/faculty/publications.asp by searching for an author's name and 2016.
References
Acton, C. (2015). Economically-Optimal Mature Beef Cow Weight in the U.S. Southern Plains, MS Thesis, Department of Agricultural Economics, Oklahoma State University.
Amadou, Z., Raper, K.C., Biermacher, J.T., Cook, B. & Ward, C. (2014). Net Returns from Feeding Cull Beef Cows: The Influence of Beginning Body Condition Score. Journal of Agricultural and Applied Economics 46(1):139-155.
American Veterinary Medical Association. (2016). AVMA Policies: Castration and Dehorning of Cattle. Retrieved from https://www.avma.org/KB/Policies/Pages/Castration-and-Dehorning-of-Cattle.aspx.
Bayliff, C.L, M.D. Redden, J.R. Cole, A.L. McGee, C. Stansberry, D.L. Lalman, M.E. Corrigan, & W. Burdett. (2015). Effects of Ralgro Implants Administered at Branding on Growth Performance of Steer Calves through Weaning (Abstract). Southern Section American Society of Animal Science, Atlanta, Georgia.
Doye, D. & Lalman, D. (2011, February 5-8). Moderate versus Big Cows: Do Big Cows Carry Their Weight on the Ranch? Selected Paper. Southern Agricultural Economics Association Annual Meeting. Corpus Christi, Texas.
Doye, D., Sahs, R. & Huhnke, R. Hay Production, Storage and Feeding. Chapter 12. Beef Cattle Manual, Oklahoma Cooperative Extension Service, Sept. 2015.
Feuz, D.M. & Hewlett, J.P. (2012). Marketing and Feeding Cull Cows. RightRisk Information Sheet #IS-12-01. Retrieved from: www.farmmanagement.org/Wiki/Gallery/cullcow/MarketingAndFeedingCullCows.pdf.
Kansas Farm Management Association (2015). Enterprise Analysis: Beef Cow/Calf-Sell Calves. Retrieved from www.agmanager.info/kfma/.
Livestock Market Information Center. (2016, January 20). Seasonal Price Index – Utility Cows. Retrieved from Member Reports at http://www.lmic.info/
Mallory, S., DeVuyst, E.A., Raper, K, Peel, D. & Mourer, G. (2016). Effect of Location Variables on Feeder Calf Basis at Oklahoma Auctions. Journal of Agricultural and Resource Economics, in review.
McMurphy, C.P., Sharman, E.D., Cox, D.A., Horn, G.W., & Lalman, D.L. (2010). Effects of Implant Type and Protein Source on Growth of Steers on Growth of Steers Grazing Summer Pasture. Proceedings of Western Section of ASAS, Journal of Animal Science 61:100.
Mourer, G. (2013). Oklahoma Quality Beef Network. Presentation to Oklahoma Cooperative Extension Service Northeast District Inservice.
Pendell, Dustin L., Kim, Youngjune & Herbel, Kevin. (2015). Differences Between High-, Medium-, and Low-Profit Cow-Calf Producers: An Analysis of 2010-2014 Kansas Farm Management Association Cow-Calf Enterprise. Retrieved from http://www.agmanager.info/livestock/budgets/production/beef/Cow-Calf_2015.pdf
Ramsey, R., Doye, D., Ward, C., McGrann, J., Falconer, L. & Bevers, S. (6 April 2005). Cow-Calf Costs of Production. Journal of Agricultural and Applied Economics. 37.
Scasta, J.D., L. Henderson, & T. Smith. (2015). Drought Effects on Weaning Weight and Efficiency Relative to Cow Size in Semiarid Rangeland. Journal of Animal Science 93: 5829-5839.
Sparks, M, Sexton, J, McMurphy, C, Mourer, G., Richards, C, & Lalman, D. (2013). Effects of Bale Feeder Type and Supplementation of Monensin on Hay Waste, Intake, and Performance of Beef Cattle. American Society of Animal Science Southern Section Meeting. Retrieved from https://asas.org/docs/southern-section/2013southern_abstracts_web.pdf.
U.S. Department of Agriculture. (2008). Beef 2007-08, Part I: Reference of Beef Cow-calf Management Practices in the United States, 2007-08. USDA-APHIS-VS, CEAH. Fort Collins, CO #N512-1008. Retrieved from Http://www.aphis.usda.gov/animal_health/nahms/beefcowcalf/downloads/beef0708/Beef0708_dr_PartI_rev.pdf
Williams, B., E.A. DeVuyst, D.S. Peel, and K.C. Raper. (2014). The Likelihood of Positive Returns from Value-Added Calf Management Practices. Journal of Agricultural and Applied Economics 46: 125-138.
Williams, B.R., K.C. Raper, E.A. DeVuyst, D. Doye, D. Peel, D. Lalman, and C. Richards. (2013). Demographic Factors Affecting the Adoption of Value-Added Practices by Oklahoma Cow-Calf Producers. Journal of Extension, 5: 6FEA7.Available at: http://www.joe.org/joe/2013december/a7.php.
Williams, G.S., K.C. Raper, E.A. DeVuyst, D. Peel, D. McKinney. (2012). Determinants of Price Differentials in Oklahoma Value-Added Feeder Cattle Auctions. Journal of Agricultural and Resource Economics 37:114-127.