Journal of the NACAA
ISSN 2158-9429
Volume 9, Issue 2 - December, 2016
Measuring pH and Water Activity in Cured Reduced Oxygen Packaged Snack Sticks
- Theisen, M., Undergraduate Research Assistant, Michigan State University Extension
Schweihofer, J.P., Meat Quality Extension Educator, Michigan State University Extension
ABSTRACT
A comparison of in-house and third party pH and water activity (aw) testing of cured, reduced oxygen packaged meat products was conducted. It took approximately 34 minutes 35 seconds to measure pH and aw for one sample and 14 minutes 10 seconds for subsequent samples. Results were not different (P ≥ 0.05) for pH and aw among laboratories or meters. The breakeven of in-house and third party testing for pH and aw is about 28 samples. Results will help small meat processors decide to purchase equipment and supplies for testing pH and aw or send samples out to a third party laboratory.
Introduction
The pH and water activity (aw) of processed meat products impacts product safety and shelf stability. The Michigan Department of Agriculture and Rural Development require retail exempt processors of cured and cooked reduced oxygen packaged (ROP) meat products to test pH and aw of products labeled shelf stable or to obtain extended shelf life beyond the approved 14 day shelf life as part of the Specialized Retail Meat Processing Variance (Variance). Vacuum packaging is the most common form of ROP. Products that are fully shelf stable require aw and pH testing for every batch, whereas products labeled “shelf stable, keep refrigerated upon opening” need two consecutive production batches tested initially and then quarterly testing. Extended shelf life is desirable for marketing purposes and making batch sizes that maximize processing efficiencies and improve profitability. Results of this study can assist meat processors in making a decision between purchasing equipment and conducting in-house testing of pH and aw and sending samples to an accredited third party laboratory. All aspects need to be considered when making the decision, as there is not a ‘one size fits all’ application. Factors such as amount of production, staff and time availability, and number of samples to be tested will vary by processor and impact each processor’s decision.
Materials and Methods
Trial 1
Time to measure pH and aw in-house was determined in Trial 1. Four packages of pizza flavored cured ROP snack sticks were obtained from the Michigan State University (MSU) Meat Laboratory (East Lansing, MI) and tested in a MSU laboratory (in-house). One package per day (n=4) was tested for pH and aw. All of the samples were obtained from the same lot. Each of the snack sticks (n=6) in a package served as replicates and were tested individually for pH and then averaged within a meter (n=2 pH meters and n=1 aw meter) and package.
Each step, from set-up, calibration, sample preparation, testing, and clean-up was timed separately using a bench top timer (Cole-Palmer four-channel jumbo display clock/timer, Vernon Hills, IL). The set-up time included preparation of the bench top, collecting supplies and the snack sticks for each day of testing.
Measuring pH
The pH of a solution is a way of expressing hydronium ion concentration as a measure of acidity or alkalinity. It is defined as pH = -log[H3O+] and is measured on a scale of 0-14 where 7 is neutral, < 7 is acidic and > 7 is alkaline (Kotz & Treichel, 1999). Two pH meters were used to measure pH. The pH Meter A (Foodcare Portable pH meter, Model 99161, Hannah Instruments, Woonsocket, RI) was a portable meter. Two-point calibration was completed according to the user manual and followed on-screen guide instructions when in calibration mode. The probe was submerged in pH 4.0 buffer solution (EDM Chemicals, Gibbstown, NJ.) as prompted, followed by pH 7.0 buffer solution (EDM Chemicals, Gibbstown, NJ.). Between each buffer solution, the probe was rinsed with distilled deionized water and blotted dry. The pH Meter B was a handheld pen style pH probe (Model 8689, Thermoworks, American Fork, UT). Once in calibration mode, the meter automatically sensed what buffer to calibrate with and automatically continues the calibration. The same rinsing and blot drying procedures described with pH Meter A were followed between the two buffer solutions. If the meter did not calibrate, it was manually adjusted according to the procedures in the user manual. The time for calibration of the pH meters included any calibration adjustments that needed to be made. The calibration step for each pH meter was recorded each day and included all steps until the final calibration point was recorded.
Measuring water activity (aw)
Water activity is a measure of the ratio between water vapor pressure of the food and the pressure of water at the same temperature and describes the relative availability of water in a product (Romans, Costello, Carlson, Greaser, & Jones, 1994). Time to calibrate the aw meter (range from 0.00 - 1.00 ± 0.02; Aqualab Pawkit handheld water activity meter, Decagon Devices, Pullman, WA) included all preparations as well as the calibration. Calibration for the aw meter used 6.00 mol/kg NaCl (0.760 aw) and 2.33 mol/kg NaCl (0.920 aw) calibration solutions. To begin calibration, the 0.760 aw solution was poured into the sample cup and the reading was started then repeated for the 0.920 aw solution. If the meter did not display the correct aw readings, the user manual was followed to adjust the calibration and calibrations were conducted again. The meter was calibrated each day prior to use. The time recorded included any necessary recalibrations and ended after the final calibration reading was complete and acceptable. The aw meter used in this study came with a calibration certificate.
Sample preparation and timing of testing
Sample preparation of the snack sticks began after calibration. The same sample solution from each snack stick was used to measure pH with each meter. Sample preparation included the cutting and weighing of a 10-gram sample, measuring 90 ml of distilled deionized water in a graduated cylinder, adding both the sample and distilled deionized water to the blender (Magic Bullet, model MBR-1101, Homeland Housewares, Los Angeles, CA) and blending for approximately 20 seconds until thoroughly combined. After blending, the solution was transferred to a 250 ml beaker and filtered using 12 cm grade 1 filter paper (Whatman, Buckinghamshire, UK.) folded to create a cone and inserted into the meat slurry solution (Sebranek, Lonergan, King-Brink & Larson, 2001). The filter paper is set in the solution to allow the liquid to pass through the filter and separate from the solids in order for the sample to be analyzed. Time ended after enough of the sample had filtered through to immerse the pH electrodes. Each meter was timed separately to determine reading time for each meter and began when the meter was inserted into the solution. Time concluded when the reading was complete and then results were recorded. The order in which the pH meters were used was alternated.
Time for testing aw was separated by sample preparation and the actual test time. Sample preparation consisted of finely dicing the sample to increase the surface area for testing, filling the sample cup, and the placement of the meter. Test time began the moment the meter started and stopped when the aw reading was completed and recorded.
To provide the most accurate time range, clean-up between samples and also overall clean-up when testing concluded was recorded. Clean-up between samples began after both the pH and aw testing was concluded for each sample. This included the washing and rinsing of the blender and beakers with distilled deionized water between each sample. Overall clean-up time included washing and rinsing all other beakers, properly storing meters, storing all materials, and cleaning of the workspace.
Trial 2 – Third-party testing
The second set of samples (Trial 2) consisted of four different flavored cured ROP snack sticks (Black Pepper and Garlic, Devil’s Kiss, Jalapeno, and Shelf Stable) obtained from the MSU Meat Laboratory containing two sticks per package. Samples were tested at the in-house laboratory, the MSU Food Science and Human Nutrition laboratory, and shipped to an accredited third party laboratory. These results were analyzed for accuracy, cost, and turn-around time. The in-house sample set was tested following the procedures outlined in Trial 1. The Food Science and Human Nutrition laboratory completed the pH testing with an Accumet Basic AB15 meter (± 0.01 units; Fisher Scientific, Pittsburgh, PA). The aw testing was completed on a Aqualab bench top model 3TE (± 0.003 units; Decagon Devices, Pullman ,WA). Test results for both of the MSU laboratories were received the same day as the samples were received and would be representative of a processor doing in-house testing.
To analyze time and cost of testing, one set of samples were shipped to an accredited third party laboratory. Theses samples were packaged in a foam box and kept cold using two frozen reusable gel packs. The package was shipped (Fed-Ex Corporation, Memphis, TN) overnight to Alliance Analytical Laboratories (Coopersville, MI) and arrived by 10 am the next day. Results were received and compared to the other labs for time to send and receive results, accuracy, and cost.
Breakeven prices and calculation
Breakeven prices were calculated using set costs for each scenario (Table 1). Labor costs were calculated using $12/hour. Laboratory equipment and supplies pricing were from a scientific supply store. A total amount for supplies was used to calculate the breakeven sample point, as that is the minimum amount of supplies needed to begin in-house testing. Many of these supplies will last for over 50 samples depending on testing frequency. Maintenance and calibration were determined from potential service needed and associated costs every year of use for both the meters. Prices from the third party laboratories were used for sample preparation fees. An average of four accredited laboratories in Michigan were used for aw and pH test prices. The prices used for the aw and pH meter were from the meters that were used in the in-house analysis. More expensive benchtop models for pH and aw testing are also available. Benchtop pH meters can range anywhere from around $700 to $1,500. Bench top aw meters can range from $4,000 up to $10,000. Shipping costs were figured using an average of 2-day shipping for a 1-5 lb. package across the three major carriers. Packaging costs were based on the use of frozen gel packs and Styrofoam box. The breakeven point was calculated by taking the sum of costs to be incurred doing in-house testing and dividing that by the total cost incurred sending samples to an accredited third party laboratory (Table 1). Interest was not used as a factor in calculating the breakeven price because the total for equipment and supplies is slightly more than $3,200. The breakeven number represents an approximate total number of third party samples a producer could send before incurring the same costs as purchasing the equipment to test samples in-house.
Statistical analysis
Statistical analysis was completed using the real stats function pack in Excel® (Microsoft Corp., Redmond, WA). Paired t-test were used to determine differences in Trial 1. Non-parametric one-way ANOVA Kruskall-Wallis test (Laerd Statistics, 2013) was used to determine differences in Trial 2. Significance was determined at (P ≤ 0.05).
Results and Discussion
Trial 1
The time to measure each step of testing pH and aw are illustrated in Table 2. The time to calibrate the pH meters is spread out over a greater time range due to differences between meters. The pH meter B automatically detected the pH for the calibration solutions and was not always successful in doing so on the first try and often had to be manually adjusted. When it was manually changed, the solution was always measured a second time to ensure it was calibrated. It is also important to note that a learning curve to sample preparation and operation of the meters existed. The efficiency improved over time with the number of samples a person conducted and is reflected in the average time recorded. On average, measuring pH with two meters and aw with one meter, including calibration, took about 47 min 24 sec in the research laboratory. The average time for calibration between the two pH meters was 3 min 56 sec and the average meter time for testing pH between the two meters was 1 min 4 sec. Given that in a production setting only one pH reading would be used per sample, the average time to measure pH and aw from start to finish would be approximately 34 min 35 sec including calibration. In a production setting, after initial set-up and calibration of the meters, it would take approximately 14 min 10 sec to measure pH and aw of each sample including clean-up. For example, measuring pH and aw of two samples would take approximately 48 minutes and 45 seconds. Calibration of the aw meter and testing is approximately 5 minutes ± 30 seconds for each cycle, for a total time of 10 minutes ±30 sec for one sample.
The pH and aw criteria that must be met for shelf stability is displayed on the Specialized Retail Meat Processor (SRMP) process criteria chart (Figure 1; MDARD, 2014a). All of the Trial 1 pH and aw results (Table 3) were within the “A” criteria (packaged products are shelf stable and must be labeled “Refrigerate for safety after opening”) for pH and aw testing according to the SRMP Product Criteria chart (Figure 1). This chart was developed to display the relationship of pH and aw and the points that may support the growth of potentially harmful organisms. The precision and cost of pH Meter A (± 0.01 units; $445) is more than the precision and cost of pH Meter B (± 0.05 units; $69). Both meters utilized a two-point calibration that used pH 4.00 and 7.00 buffer solutions. These two points were chosen due to the expected pH range of various fresh and processed meats of 4.8 - 6.8 (Romans et al., 1994). Meter precision should also be taken into account when using results to determine product safety.
Temperature can affect pH readings and it is important to have a meter with automatic temperature compensation. A difference in sample temperature can affect the accuracy of the electrode, especially if the sample being tested is at a different temperature than the buffer solutions used in calibration (Barron, Ashton, Geary, 2006). Both meters used had automatic temperature compensation and the temperatures at testing time were recorded. Temperature is not believed to be a factor in the pH differences, as measurements were made in the same laboratory environment (21° C) and had similar recorded temperatures each day.
There was no difference (P = 0.052) between readings from the two pH meters for Trial 1. The trend for a difference in pH results may be related to the precision between the two pH meters. The aw results for Trial 1 were consistent across the trial period (standard error = 0.001). Despite the price difference in the pH meters, both gave acceptable results. All meters regardless of price should be properly calibrated and maintained to help reduce variability. Proper meter care and maintenance and spot checking against an accredited third party laboratory is encouraged.
Trial 2
There were differences in pH (P = 0.001) and aw (P = 0.048) among the flavors of the snack sticks. These differences were to be expected due to the differences in formulations among flavors. There were no differences in pH (P ≥ 0.05) and aw (P ≥ 0.05) between the laboratories or meters used for all flavors of snack sticks (Table 4).
Third party laboratory comparisons were obtained in Trial 2 (Table 4). The Black Pepper and Jalapeno sticks met the “A” criteria on the SRMP process chart. The “A” criteria states that the product must be labeled “refrigerated upon opening for safety”, as the product could support the growth of organisms. All pH and aw results for the Shelf Stable snack sticks met the shelf stable criteria “B” (cured meat products considered shelf stable) except those results obtained from the accredited third party laboratory. This could be a variation amongst the sticks or a difference of testing composite samples vs. an average between the two sticks tested individually. The “B” criteria results in product being labeled “shelf stable”. Results for Devil’s Kiss snack sticks (Table 4) were all in the “A” criteria (refrigerate upon opening for safety) except for the results obtained from pH meter A (“B” shelf stable). Devil’s Kiss snack sticks met the Variance requirements for labeling “shelf stable, refrigerate for safety after opening”. Depending on the snack stick flavor, SRMP “A” or “B” criteria varied among the different laboratories and meters but all snack sticks were either “A” or “B” (Table 4). All of the MSU Meat Laboratory snack sticks are currently labeled as “refrigerate after opening”, and would be in compliance based on the results from all of the laboratories.
The results from the in-house testing and MSU Food Science and Human Nutrition (MSU FSHN) Laboratory were received on the same day. The samples shipped to the accredited third party laboratory were received the next morning with a received temperature of 5.6°C. Results were emailed the same day the samples were received and then hard copies were received via the U.S. mail 11 days after samples were shipped.
Sample analysis at the third party laboratory was $12 for pH and $25 for aw samples. In addition to sample analysis, an $11 sample preparation fee for each different flavor snack stick was charged. Other laboratories within Michigan report rates from $8-$50 for pH testing and $24-$69 for aw testing per sample. None of the other laboratories advertise a sample preparation fee, but $10-$15 may be added to each sample. Turnaround time to receive results was advertised from same day results to up to two weeks. Despite these advertised times, delivery method needs to be taken into account and any other potential delays such as weekends and holidays.
When shipping samples to a third party lab, there are many additional costs that need to be considered, such as packing/shipping costs and time and the number of samples that need to be tested. Depending on an establishment’s proximity to the lab, there may be an opportunity for drop off or pick-up of samples. There is typically a charge for pick-up services, and dropping off samples requires an employee and time expense. The packaging used to package and ship samples may be reused but would require return from the laboratory.
In most cases it would be best to overnight or two-day ship the samples depending on location and mail services available. Suggested packaging for a refrigerated or frozen product is a 2-inch-thick Styrofoam box or similar insulated container with a cooling source such as frozen gel packs. Depending on the amount of sample and desired shipping preferences, dry ice may be an option. When using gel packs, they should be rated for -17.8°C or colder. In a scenario using dry ice, it is critical to follow safe handling instructions, properly package the samples, and also comply with all federal shipping regulations. When shipping with either method, time of year, climate where you are shipping to, time of day you ship, and day of week are important factors to ensure your package arrives in a safe temperature range unless the product is shelf stable. To avoid potential delays, ship samples early in the week and not on or before a weekend.
Additional costs are incurred with overnight or 2-day shipping. These costs will vary based on carrier and also on the weight/dimensions of the package (Table 5). Across all three major carriers, United Parcel Service (Atlanta, GA), Unites States Postal Service (USPS, Washington, D.C.), and Fed-Ex Corporation, list prices for overnight shipping ranges from $34 - $67 depending on desired delivery time and weight of the package. Second day shipping costs can range from $6.80 for a small USPS flat rate box to $25 for other carriers. There may be organization or account price discounts that would lower the shipping costs. Most of the shipping options include tracking and insurance.
The breakeven point of outsourcing 28 samples would be equivalent to purchasing the equipment for pH and aw testing in house (Table 6). The number of samples to be tested vary by amount of production and frequency of testing. Table 7 displays an example of the costs that would be incurred if quarterly third party sampling was required on two different products per year using average costs from four accredited labs in Michigan as a reference. The example of quarterly sampling of two different products, results in 4.45 years of testing before in-house costs would be covered. Establishments that have more product types or greater testing frequency needs, such as for each lot, will justify investment of equipment and supplies much sooner than others. In cases where processors are extending the shelf life of their products from the 14 days allowed with the Specialized Meat Processing Variance Shelf Stability guidelines, (MDARD, 2014b) additional testing may be needed.
Summary/Implications
The amount and frequency of cured, ROP packaged meat products that are produced and need testing will influence a processors decision to invest in equipment and supplies needed for measuring pH and aw in-house vs. sending them to a third party laboratory. Results from this project give processors information to make decisions to determine if it is best for their operation to measure pH and aw in-house or send samples to a third party. The number of samples and frequency of testing will influence the decision the most and will also depend on the time and resources each processor has available.
Literature Cited
Barron, J. J., Ashton, C., & Geary, L. (2006). The effect of temperature on pH measurement. Technical Services Department, Reagecon Diagnostics Ltd, 01(2).
Kotz, J. & Treichel, P. (1999). Chemistry and chemical reactivity (4th ed., p. 806). Fort Worth: Saunders College Publishing.
Laerd Statistics (2013). One-way ANOVA. Lund Research Ltd. Retrieved from: https://statistics.laerd.com/statistical-guides/one-way-anova-statistical-guide.php.
Michigan Department of Agriculture and Rural Development. (2014a). Specialized meat processing variance and extended shelf life for retail establishments. Lansing, MI: MDARD. Retrieved from: Michigan.gov/meatprocessing.
Michigan Department of Agriculture and Rural Development. (2014b). Specialized meat processing shelf stability. Lansing, MI: MDARD. Retrieved from: Michigan.gov/meatprocessing.
Romans, J., Costello, W., Carlson, C., Greaser, M., & Jones, K. (1994). The meat we eat (13th ed.). Danville, IL: Interstate Publishers, Inc.
Sebranek, J. G., Lonergan, S. M., King-Brink, M., & Larson, E. (2001). Meat science and processing. (3rd ed.). Zenda, Wis. Peerage Press.
Tables and Figures
Table 1: Prices used when calculating breakeven pricing
|
Labor/hour |
|
$12.00 |
|
Laboratory Equipment |
Graduated cylinder |
$45.54 |
|
|
Magic Bullet |
$39.99 |
|
|
Wash bottle |
$6.08 |
|
|
|
$91.61 |
|
Laboratory Supplies |
Gallon of deionized water |
$43.12 |
|
|
Filter paper |
$12.40 |
|
|
Kim wipes |
$8.65 |
|
|
pH 4.0 |
$11.75 |
|
|
pH 7.0 |
$5.90 |
|
|
pH 10 |
$12.50 |
|
|
Sample cups (500 count) |
$196.00 |
|
|
0.76 aw calibration solution |
$96.00 |
|
|
0.92 aw calibration solution |
$96.00 |
|
|
|
$482.32 |
|
Maintenance/Calibration |
|
$100.00 |
|
Sample Prep per sample |
|
$11.00 |
|
Aw testing per sample |
|
$13.00 |
|
pH testing per sample |
|
$44.00 |
|
Water activity (aw) meter |
|
$2,000.00 |
|
pH meter |
|
$445.00 |
|
Shipping |
|
$16.90 |
|
Packaging to ship |
|
$24.00 |
Table 2: Time for in-house testing of pH and aw
|
Time (min:sec) |
|||
|---|---|---|---|
|
Step of Testing |
Average |
Low |
High |
|
Gather equipment and supplies |
03:49 |
02:29 |
05:57 |
|
Calibrate aw meter |
12:25 |
12:04 |
12:47 |
|
Calibrate pH Meter A |
02:46 |
01:03 |
04:09 |
|
Calibrate pH Meter B |
05:06 |
02:50 |
07:25 |
|
Aw preparation time |
01:46 |
01:12 |
03:01 |
|
Aw test time |
05:20 |
05:05 |
05:32 |
|
pH Meter A preparation time |
03:22 |
01:43 |
04:26 |
|
pH Meter A test time |
00:39 |
00:16 |
01:47 |
|
pH Meter B preparation time |
03:22 |
01:43 |
04:26 |
|
pH Meter B test time |
01:28 |
00:33 |
02:35 |
|
Clean-up between samples |
02:06 |
01:31 |
02:45 |
|
Overall Cleanup |
05:15 |
02:41 |
07:35 |
|
Estimated time for pH Meter A |
37:27 |
28:04 |
47:59 |
|
Estimated time for pH Meter B |
40:37 |
30:08 |
52:03 |
|
Estimated average time using a single pH metera |
34:35 |
29:06 |
50:01 |
a Estimated time using only one pH meter was calculate using an average calibration and testing time between pH meter A and B.
Table 3: Trial 1: In-house Pizza flavored snack sticks pH and aw resultsa by testing day
|
|
Day 1 |
Day 2 |
Day 3 |
Day 4 |
Overall |
|
|---|---|---|---|---|---|---|
|
|
Mean |
Mean |
Mean |
Mean |
Mean |
Standard Error |
|
aw |
0.96 |
0.96 |
0.95 |
0.95 |
0.95 |
0.001 |
|
pH Meter A |
4.64 |
4.56 |
4.52 |
4.52 |
4.56b |
0.014 |
|
pH Meter B |
4.19 |
4.51 |
4.61 |
4.55 |
4.46b |
0.038 |
aAll results for Trial 1 met the pH and aw criteria for “refrigerate upon opening for safety” for shelf stable cured products.
bMeans with the same superscript letter are similar (P = 0.052)
Table 4: Trial 2: pH and water activity (aw) of different flavored snack sticks from in-house or third party laboratories
|
Sample |
Laboratory |
pH |
Standard Error |
aw |
Standard Error |
SMP Charta |
|---|---|---|---|---|---|---|
|
Black Pepper Garlic
|
In-House Ab,f |
4.25i |
0.015 |
0.94j |
0.000 |
A |
|
In-House Bc,f |
4.41i |
0.015 |
A |
|||
|
MSU Food Science and Human Nutritiond,g |
4.39i |
0.015 |
0.93j |
0.008 |
A |
|
|
Third Party Labe,h |
4.40i |
0.96j |
A |
|||
|
Devil's Kiss
|
In-House A |
4.05k |
0.050 |
0.95l |
0.005 |
B |
|
In-House B |
4.49k |
0.060 |
A |
|||
|
MSU Food Science and Human Nutrition |
4.31k |
0.005 |
0.94l |
0.000 |
A |
|
|
Third Party Lab |
4.30k |
|
0.96l |
|
A |
|
|
Jalapeno |
In-House A |
4.53m |
0.025 |
0.94n |
0.010 |
A |
|
In-House B |
4.55m |
0.050 |
A |
|||
|
MSU Food Science and Human Nutrition |
4.62m |
0.005 |
0.94n |
0.002 |
A |
|
|
Third Party Lab |
4.60m |
|
0.95n |
|
A |
|
|
Shelf Stable |
In-House A |
4.36o |
0.010 |
0.91p |
0.000 |
B |
|
In-House B |
4.51o |
0.005 |
B |
|||
|
MSU Food Science and Human Nutrition |
4.41o |
0.005 |
0.92p |
0.001 |
B |
|
|
Third Party Lab |
4.50o |
|
0.94p |
|
A |
a Michigan Department of Agriculture and Rural Development Specialized Meat Processing Variance Chart (2014a)
b ± 0.01 units for In-House pH Meter A (Foodcare Portable pH meter, Model 99161, Hannah Instruments, Woonsocket, RI)
c ± 0.05 units for In-House pH Meter B (Model 8689, Thermoworks, American Fork, UT)
d ± 0.002 units for MSU Food Science and Human Nutrition pH meter (Accumet Basic AB15 meter Fisher Scientific, Pittsburgh, PA)
e ± 0.002 units for Third Party pH meter
f ± 0.02 units for In-House aw meter (Aqualab Pawkit handheld water activity meter, Decagon Devices, Pullman, WA)
g ± 0.003 units for MSU Food Science and Human Nutrition aw meter (Aqualab bench top model 3TE Decagon Devices, Pullman ,WA)
h unknown precision for Third Party aw meter
I pH values not different (P = 0.245)
j aw values not different (P = 0.368)
k pH values not different (P = 0.142)
l aw values not different (P = 0.308)
m pH values not different (P = 0.151)
n aw values not different (P = 0.368)
o pH values not different (P = 0.207)
p aw values not different (P = 0.165)
Table 5: Approximated shipping costsa for overnight and 2-day shipping for up to 10 lbs. package
|
Carrier |
Delivery Time |
Max Cost |
|
|---|---|---|---|
|
1-5 lbs |
6-10 lbs |
||
|
UPS Next Day Air Early A.M. |
8 am next business day |
$61.25 |
$66.95 |
|
UPS Next Day Air |
10:30 am next business day |
$31.25 |
$36.95 |
|
UPS Next Day Air Saver |
3 pm next business day |
$28.05 |
$33.55 |
|
UPS Second Day Air A.M. |
2 business days by 10:30 am |
$18.20 |
$22.75 |
|
UPS Second Day Air |
End of business day |
$15.85 |
$19.75 |
|
USPS Priority Mail Flat Rate Boxes (Large, Medium, and Small with a 70 lb max) |
1-3 days |
$18.75 |
|
|
$13.45 |
|||
|
$6.80 |
|||
|
FedEx First Overnight |
Next day by 8am |
$60.60 |
$66.52 |
|
FedEx Priority Overnight |
Next day by 10:30 am |
$32.60 |
$38.52 |
|
FedEx Standard Overnight |
Next day by 3 pm |
$30.03 |
$35.97 |
|
FedEx 2Day A.M. |
2nd day by 10:30 am |
$19.79 |
$24.69 |
|
FedEx 2Day |
2nd Day by 4:30 pm |
$17.21 |
$21.47 |
aPrices as of 6-19-16; subject to change
Table 6: Breakeven cost for in-house compared to third party testing on a per sample basis
|
|
In-house |
Third Party |
|
Labor at $12/hr (35 min for testing, 30 min to ship) |
$7.20 |
$6.00 |
|
Laboratory equipment |
$90.00 |
|
|
Laboratory supplies |
$480.00 |
|
|
Aw meter |
$2,000.00 |
|
|
pH meter |
$445.00 |
|
|
Maintenance/Calibrationa |
$100.00 |
|
|
Sample prep fee |
|
$11.00 |
|
Aw testing |
|
$44.00 |
|
pH testing |
|
$13.00 |
|
Shipping |
|
$16.90 |
|
Packaging to ship |
|
$24.00 |
|
Total |
$3,222.20 |
$114.90 |
|
Total pH only |
$734.20 |
$70.90 |
|
Breakeven pH and aw |
28 samples |
|
|
Breakeven pH only |
10 samples |
|
aEstimated maintenance and calibration as needed
Table 7: Third party testing costs on a quarterly testing basis based on 2 samples tested per quarter.
|
Quarterly Testing |
|
|
Labor x 4 |
$24.00 |
|
Sample Prep x16 (n=2) |
$176.00 |
|
Snack Sticks pH x 4 |
$52.00 |
|
Snack Sticks Aw x 4 |
$176.00 |
|
Jerky pH x 4 |
$52.00 |
|
Jerky Aw x 4 |
$176.00 |
|
Shipping x 4 |
$67.60 |
|
Packaging x 4 |
$96.00 |
|
Total Annual Cost for 2 Samples Quarterly |
$723.60 |
|
|
|
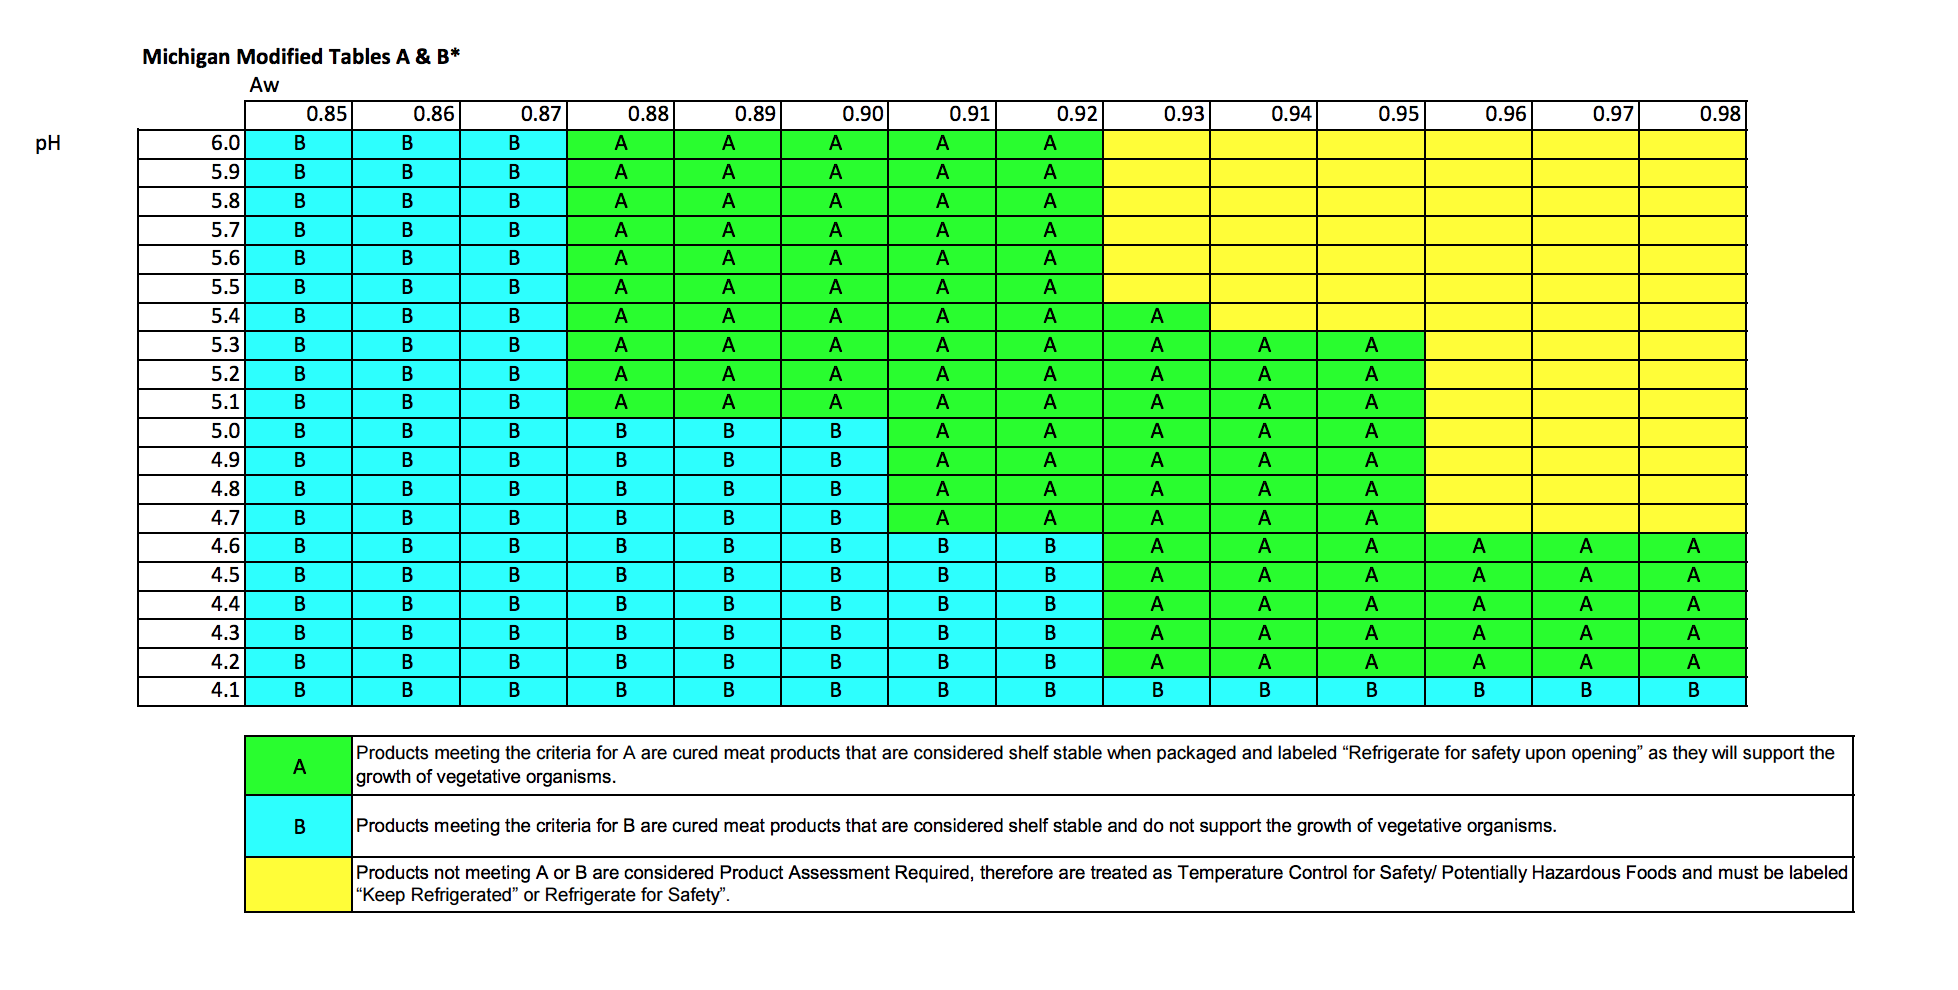
Figure 1: SMP Process Criteria Charta
aMichigan Department of Agriculture and Rural Development, 2014a