Journal of the NACAA
ISSN 2158-9429
Volume 10, Issue 1 - June, 2017
Maryland Eastern Shore Agriculture Needs Assessment
- Dill, S. P., Extension Educator - AGNR, University Of Maryland Extension
Miller, J.O. , Extension Educator - AGNR, University of Maryland Extension
McCoy, T., Assistant Director of Evaluation, University of Maryland Extension
Rhodes, J.L., Extension Educator - AGNR, University of Maryland Extension
ABSTRACT
Needs assessments are critical to Cooperative Extension to understand current and emerging issues facing clientele; form educational responses that help address those issues; and effectively focus Extension program resources. For all of these reasons, the University of Maryland Extension conducted an agricultural needs assessment framed around farm vitality for the nine counties on the Eastern Shore of Maryland. Results for farm viability were related to topics in regulations, agriculture production and farm management. Farmers’ top three priorities for UME services were related to field research trials, assistance with regulations and education to consumers about the importance of agriculture.
Introduction
Extension Educators use formal clientele and community needs assessments to identify areas of program concentration and ensure that limited resources are used effectively (Seevers et al., 2007). Within Extension, needs assessments are referred to as the foundation of successful program design, development, and delivery and, for new educators, a first priority (Caravella, 2006; and Seevers et al., 2007). Beyond programming, needs assessment data are useful in grant applications, individual Educator reports and reports to external stakeholders (Angima et al., 2014).
Over the years, University of Maryland Extension (UME) has conducted various informal county and commodity-based needs assessments within individual counties and gathered input from Extension Advisory Councils (EACs) and other stakeholders. In addition, Educators have used secondary data sources, particularly the Agricultural Census, to monitor trends and adjust programs accordingly. However, a formal needs assessment focused on the nine Eastern Shore counties as a whole had not been conducted. These counties have a strong agriculture industry that encompasses poultry, corn, soybeans, vegetables, livestock, and other agronomic and specialty crops. The agricultural Extension Educators serving these counties wanted to explore both similarities and differences in needs across demographics and commodity areas and develop programs that would serve the Shore as a region in Maryland.
In 2015, the Eastern Shore Agriculture Educators implemented a comprehensive agricultural needs assessment that included farmers from all commodity areas. A survey approach was used to allow for data consistency and aggregation and allow participants time to consider their responses and keep their anonymity (Ripley, 2011). The purpose of the needs assessment was to understand what farmers consider important to a viable agriculture industry on the Eastern Shore; what they were concerned about related to the industry; their research and education needs concerning topics related to production and farm business management; education and training preferences; and priorities for UME services.
Theoretical Framework
The theoretical framework used for this study was that of farm viability. A farm is considered to be “economically viable when it generates enough revenue from its operations to cover all variable and fixed costs of production, all appropriate family living expenses and capital replacement costs” (Adelaja, 2004). Viable farms have the capacity to operate and have a reasonable chance of success. Factors that influence viability include, for example, low production costs, farmer attitudes and farm management skills and practices (Adelaja, 2004). With this framework, survey questions were constructed to gauge what items farmers believed were most important to the viability of the Shore’s agriculture industry as a whole and about their farming operations and avoid “opinion polls that generate wish lists of solutions to scarcely articulated problems” (Witkin, 1994).
Methods
The researchers attempted to find an existing reliable and valid survey instrument that suited multiple commodities. This search proved to be a difficult task. After reviewing the literature and sending a national call to other agricultural educators, the 2008 Michigan Dairy Industry Survey was identified as a potential model (Bitsch, 2009) because it moved beyond general questions of what training and education was needed to an in-depth understanding about what farmers needed. While this survey was a base from which to start, additions and changes were made to include more than the livestock industry and to add crop production systems. The survey questions were constructed using an educator team approach to elicit subject-matter, organizational and industry expertise for face validity, with the support of the UME Assistant Director of Evaluation. In addition, the instrument was pilot-tested with five farmers from the Eastern Shore to check for question comprehension and survey fatigue because of the number of questions. In 2015, the 26-question survey was finalized and approved by University of Maryland Institutional Reveiw Board (IRB). Question types were Likert, multiple choice and open ended.
The survey was conducted in two phases: 1) a random sample, and 2) a survey open to the public. The first phase was a systematic, general sample of active Eastern Shore farmers in the nine counties. The sample was not stratified by county. University of Maryland Extension contact lists from each county comprised the sampling frame. From the list of 1,800 farmers on the Eastern Shore, a random sample of 400 was drawn. Twenty names from the original sample were deleted because of duplication, non-deliverable addresses, death or by request.
To ensure the best response rate, Dillman’s Tailored Design Method (TMD; Dillman et al., 2009) was used. A pre-notification letter was sent and then the cover letter and survey were sent through the U.S. mail in February 2015. In the survey cover letter, farmers were given a survey link to use if they preferred to respond electronically. Only five chose this option. Potential respondents were sent a self-addressed, stamped envelope to return the survey. A gift card incentive was used, as well. There were 111 responses to the sample survey (29% response rate). The research team was pleased with this response considering the length of the survey, the time of the year, and standard rates of farmer survey completion (Joost et al., 2002).
When the first phase closed, the second phase of data gathering began to allow anyone to access the survey and respond. A link to the survey was included on the Extension county web pages and was publicized through the regional agricultural newspaper, the Farm Bureau and other commodity groups' emails, newsletters, and web sites. There were 186 people who completed the public, online survey. The second phase was added to ensure that anyone who wanted to complete the survey but was not in the sample could do so.
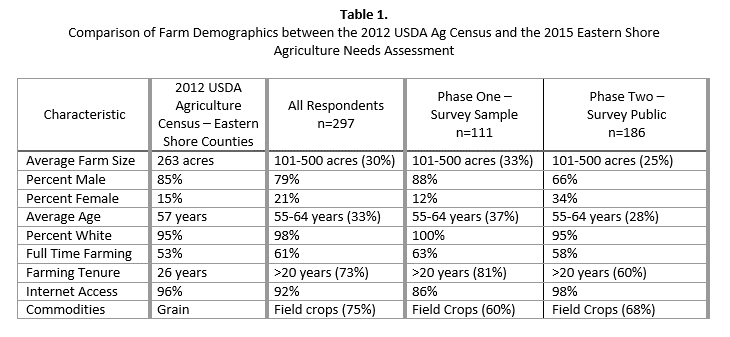
The first-phase and second-phase respondent demographics were then compared to the 2012 Agricultural Census data for the Eastern Shore agricultural population (USDA-NASS, 2012). There is a great deal of consistency among the demographics of the three groups, giving more confidence to the research team that the sample was indeed representative of the population. Table 1 shows the comparison between these three groups. Results and discussion are based on the combined data of the sample and public responses.
Results and Discussion
The Respondents
All nine Eastern Shore counties were represented in the survey. As also indicated by the 2012 Agricultural Census, Eastern Shore farmers are predominantly male (79%) and white (95%); have an average age of between 55-64 years; have been farming more than 20 years (73%); are engaged in full-time farming (61%); and have an average farm size of 101-500 acres. Some demographic characteristics reflect emerging trends: 28% of respondents farm fewer than 50 acres, and 12% were beginning farmers. While the majority of respondents were male, 21% were female. Fourteen percent were under the age of 44, and 54% had a bachelor’s degree or higher.
Eastern Shore Agriculture Viability – Priorities and Concerns
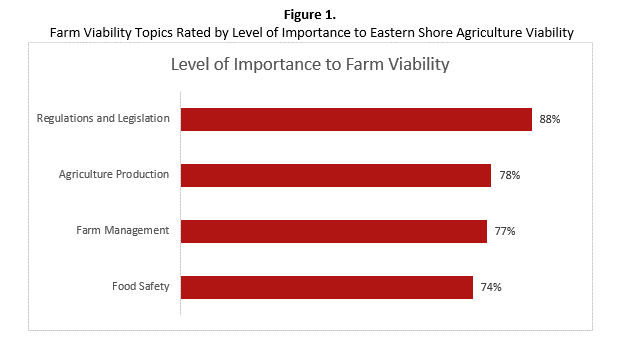
Farmers were asked to rate, on a four-point Likert scale, the importance of regulations and legislation, agricultural production, food safety and farm management related to the viability of the Shore’s agricultural industry. The Likert scale responses were: not important (1), a little important (2), important (3), and very important (4). Regulations and legislation ranked the highest for farm viability on the Eastern Shore (88%), followed by agriculture production (78%), farm management (77%), and food safety (74%), as shown in Figure 1.
In each of the farm viability topics, there were a number of related subtopics. The 32 subtopics and their level of importance (important and very important) were combined and sorted for the highest ranking subtopics. Not surprisingly, subtopics in the regulations and legislation were the most highly ranked followed by agriculture production and farm management. Table 2 summarizes the top 18 subtopics with averages over 80% importance.

Research and Education Needs
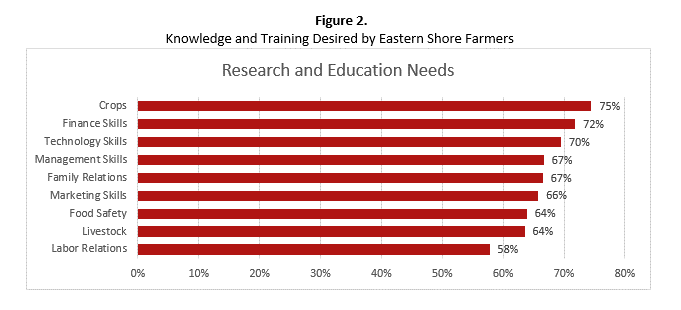
The next part of the survey was specific to educational needs. Farmers were asked to indicate how much knowledge and training they desired across nine major topics and 58 subtopics. The four-point Likert scale responses were none (1), a little (2), some (3), and a lot (4). In order to rank topics, responses of “none” or “a little” were combined into one category and the responses of “some” and “a lot” were combined into one category. The percentage of responses in each category were then calculated and ranked in order from those receiving the highest percentage to the least percentage. Crop production was the most desired knowledge and training topic among farmers (75%), followed by finance skills (72%) and technology skills (70%). The least-desired topics for knowledge and training were in the areas of food safety (64%), livestock production (64%), and labor relations (58%). A complete summary is shown in Figure 2.
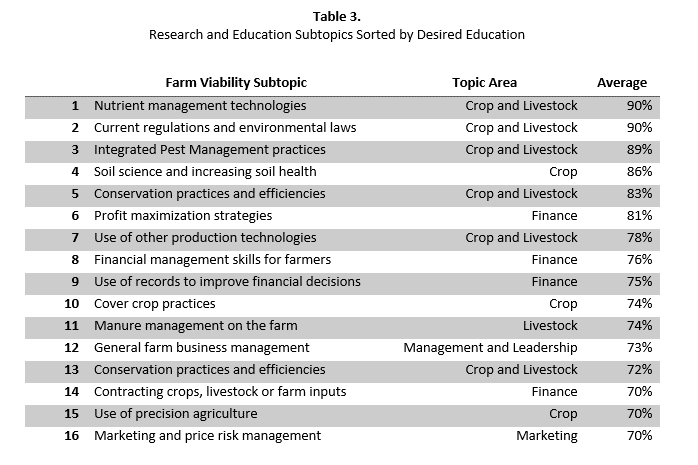
Each of the nine topics above had subtopics for ranking on the four-point Likert scale. In total, there were 58 subtopics, and there were six that received greater than 80% in terms of desire for research and education (Table 3). These include nutrient management technologies (90%), current regulations and environmental laws (90%), integrated pest management practices (89%), soil science and increasing soil health (86%), conservation practices (83%) and profit maximization strategies (81%).
Education and Training Preferences
Farmers were asked to prioritize services they would like for UME to provide for farms and the agricultural industry during the next 10 years. Respondents ranked research data from field and variety trials, interpretation and assistance with agricultural regulations, on farm consulting and agriculture promotion and education to consumers and non-farmers as their top three priorities. The least desired services were in the areas of manager or employee training. Figure 3 shows the complete ranking of all services.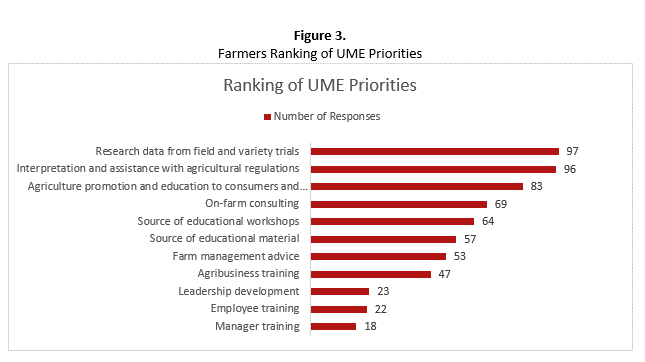
Respondents also provided their preferences on receiving information. Extension newsletters were rated the highest (3.01) followed closely by half-day workshops and hands on training (2.94). Of least interest were live presentations via the internet (2.09) and radio or TV programs (1.98). The lack of interest in online programs was not due to internet access as only 8% of respondents said they do not have an internet connection. Almost 69% report having a Facebook account and 45% use YouTube.
Conclusions and Implications for Extension
The results from the Eastern Shore Needs Assessment provide a framework and baseline for Eastern Shore agricultural Extension Educators to use the data and their extensive knowledge of the area to formulate recommendations for the University of Maryland Extension to remain a critical resource to the agriculture community. The results of the needs assessment, while not surprising, provide evidence that the program focus of UME on the Eastern Shore targets critical needs. In addition, the data help to ensure that the nine county Extension offices, two research centers, and the University of Maryland Eastern Shore campus provide needed Extension services necessary to farm viability.
The Eastern Shore team of Educators have reviewed and analyzed the data to generate a comprehensive list of programmatic, staffing and communication recommendations for UME. In summary, these recommendations are:
1. Continue to invest in the Agricultural Law Education Initiative (ALEI) to provide information and services to farmers concerns regulations and legislation.
2. Increase interaction with legislators and the public through tours, presentations and social media that create understanding of and appreciation for the importance of agriculture and the pressures that occur.
3. Focus Extension programs and positions on the production efficiencies and technologies that will help farmers be profitable.
4. Review program delivery and enhance communication. Shorten programs into half day seminars and hands-on trainings, and utilize newsletters.
There are plans to extend this process into other regions of Maryland, and this is a survey that could easily be replicated for other educators as they consider the viability, education and dissemination needs of their clientele. Needs assessments, formal or informal, are a necessary process for Cooperative Extension programming. This information impacts Educators at the local level in order to justify funding, grant requests and to support programmatic reporting. Moving forward, farms will diversify, resources will tighten, and staffing may be limited. It will be more important than ever to deliver defined educational programming and have the ability to confirm Extension activities with credible evidence.
Acknowledgement
Thank you to UME Educators and teams in the nine counties for assisting with the survey and farmers that took the time to complete the survey and share this important information.
Literature Cited
Adelaja, S. (2004). The Value Gap: The Preservation-Viability Dilemma of Agriculture at the Urban Fringe. Land Policy Institute, Michigan State University, East Lansing, MI. Report No. 2004–2.
Angima, S., Etuk, L., & King, D. (2014). Using Needs Assessment as a Tool to Strengthen Funding Proposals. Journal of Extension. [On-line], 52(6) 6TOT1. Available at: http://www.joe.org/joe/2014december/tt1.php.
Bitsch, V. (2009). 2008 Michigan Dairy Industry Survey. Agricultural Economics Report, Michigan State University, East Lansing, MI. Report No. 637,
Caravella, J. (2006). A Needs Assessment Method for Extension Educators. Journal of Extension. [On-line], 44(1) 1TOT2. Available at: http://www.joe.org/joe/2006february/tt2.php.
Dillman, D. A., Smyth, J. D., & Christian, L, M. (2009). Internet, mail and mixed-mode surveys. Hoboken, NJ: Wiley.
Joost M. E. Pennings, Irwin, S., & Good, D. (2002). Surveying Farmers: A Case Study. Review of Agricultural Economics, 24(1), 266-277. Retrieved from http://www.jstor.org.proxy-um.researchport.umd.edu/stable/1349833
Ripley, J. (2011). A Comprehensive Process to Identify Issues in Extension. Journal of Extension. [On-line], 49(3) 3TOT1. Available at: http://www.joe.org/joe/2011june/tt1.php.
Seevers, B., Graham, D., & Conklin, N. (2007). Education through Cooperative Extension (2nd ed.). Columbus, OH: The Ohio State University.
United States Department of Agriculture - National Agriculture Statistics Service (USDA-NASS). (2012). Quick Facts. Retrieved January 27, 2016, from http://www.agcensus.usda.gov.
Witkin, B. R. (1994). Needs assessment since 1981: The state of the practice. American Journal of Evaluation.