Journal of the NACAA
ISSN 2158-9429
Volume 10, Issue 2 - December, 2017
Impact of Fertilizer Applicator Certification Training (FACT) Programs on Producer Perceptions and Practices in Ohio
- Griffith, M. , Extension Educator, Agriculture & Natural Resources, Ohio State University Extension
Schoenhals, J., Extension Educator, Agriculture & Natural Resources, Ohio State University Extension
Douridas, A., Extension Educator, Agriculture & Natural Resources, Ohio State University Extension
Lentz, E., Associate Professor, Extension Educator, Agriculture & Natural Resources, Ohio State University Extension
Rose, M., Program Director, Pesticide Safety Education Program, Ohio State University Extension
ABSTRACT
As part of an effort to address water quality concerns, the Ohio legislature passed a law in 2014 requiring agricultural fertilizer applicators to attend a fertilizer certification training program. The Ohio State University Extension was tasked with developing the curriculum and providing the training. Between September 2014 and March 2017, OSU Extension educators delivered certification programs to 16,501 applicators. A voluntary survey was distributed to participants to evaluate perceptions related to water quality and nutrient management, current agronomic practices, and willingness to change practices. Responses were analyzed based on several demographic factors including farm size and region of the state. This presentation summarizes survey results to enhance understanding of farmer perspectives and current practices related to nutrient management.
Introduction
Lake Erie, a drinking water source to over 11 million people, is also a significant driving force in Ohio’s economy, generating about $1.4 billion in commercial and recreational activities (Coastal Resilience Project, n.d.). As a result of large algal blooms in Lake Erie in 2011 and 2014, access to drinking water as well as economic activities related to tourism, recreation, and commercial water use were impaired due to high levels of microcystin, a toxin produced by cyanobacteria in Harmful Algal Blooms (HABs). Microcystin can be harmful to human health if consumed in high enough quantities (Carmichael, 2001). It has been reported that HABs may form when water contains excessive levels of phosphorus (P), and that agricultural fertilizer may be a major source of this P (Graham, 2007). However, very little is known about the nutrient management practices that farmers use and their influence on P loading and water quality.
The increased public attention on agriculture’s impact on water quality prompted the Ohio legislature to pass legislation attempting to reduce P loading. Ohio Senate Bill 150 was signed by Governor John Kasich on June 5, 2014. This law requires that anyone who applies commercial fertilizer to at least 50 acres of land for agricultural production receives nutrient management training in order to become a certified fertilizer applicator. This law applies to row crop operations as well as nurseries, orchards, and greenhouses that exceed the 50 acre size limit. While driven by attention to HABs in Lake Erie, the certification is required for all Ohio applicators. While there are many sources of nutrients that contribute to HAB development this certification is focused on reducing P losses from agricultural fertilizer.
The law specifies that to become certified, applicators must attend a Fertilizer Applicator Certification Training (FACT) conducted by Ohio State University Extension (OSUE). In addition to the training, this law requires individuals who apply fertilizer to keep records of all applications for three years. The deadline to become certified was September 30, 2017. Following certification, all applicators are required to be recertified by attending a one hour training every three years.
OSUE developed new curriculum for FACT programs to achieve the objectives of the legislation. The objective of the curriculum was to educate applicators on the role agricultural fertilizer plays in water quality issues in Ohio, as well as nutrient management practices that minimized P losses. The curriculum also focused on utilizing tools including soil test values and the Tri-State Fertilizer Recommendations to determine the right application rate to reduce P losses while maintaining yields. The Tri-State Fertilizer Recommendations, published in 1995, provide fertilizer recommendations based on university research for Michigan, Ohio and Indiana (Vitosh et al, 1995).
Using this curriculum, OSUE educators delivered programs to certify 16,501 applicators between September 2014 and March 2017. The curriculum was designed to be relevant to all agricultural applicators regardless of operation size, educational backgrounds, and geographical region.
As part of the new curriculum, a program evaluation and survey tool was available for OSUE educators to distribute following each program. The survey included questions to evaluate perceptions related to water quality and nutrient management, current agronomic practices, and willingness to change practices. Utilizing data from 4,126 collected surveys, perceptions on phosphorous management were analyzed with respect to variables including farm size, farm location, age of the farmer, and education level of the farmer.
This article discusses survey results to enhance understanding of farmer perspectives and practices as a framework to guide delivery of programs to effectively engage farmers with differing perceptions about the interaction between nutrient management and water quality issues in Ohio. As certification continues, this data will serve as a baseline to compare how perceptions and practices change as a result of the implementation of the certification requirement.
Methods
At the end of each training, a paper survey was distributed to each individual in attendance. Completion of the survey was voluntary and anonymous, and not all respondents answered every question. The survey consisted of 18 questions that asked about basic demographic information, level of agreement on various statements, and questions about agronomic practices.
Likert scale ratings for level of agreement with several statements were analyzed with respect to various demographic factors using the Kruskal-Wallace rank sum test (p≤0.05) followed by a multiple comparison test (p≤0.05). Chi-Square analysis (p≤0.05) was used to analyze results of multiple-choice questions. All statistical analysis was completed using R (version 3.3.1, 2016).
Results
A total of 16,501 individuals attended trainings between September 2014 and March 2017, and 4,126 surveys were collected for a response rate of 23.4%. Respondents were residents of 84 of Ohio’s 88 counties. Responses for acres farmed were grouped into two categories for analysis (0-1,000 acres, N= 2,998; and >1,000 acres, N=823). Responses for education level were grouped for analysis (High school or less, N=2,224; and Any College, N=1,454). County of residence was used to create a variable for region of Ohio (Northwest, N=1,222; Southwest, N=1,735; and East, N=1,082). Regional boundaries were based on regional differences in farming practices and characteristics, geography, watersheds, and soil types (Fig. 1). In general, the Northwest is mostly comprised of grain farms on flat to gently rolling glaciated soils in the Western Lake Erie Basin watershed, Southwest features mostly grain farms on flat to gently rolling soils outside the Western Lake Erie Basin watershed. The farms in the eastern half of the state are generally smaller and more diversified on flat to steep glaciated and unglaciated soils of the Appalachian plateaus.
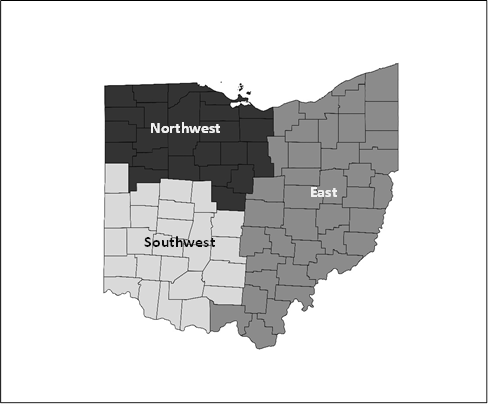
Fig. 1. Regional boundaries were based on regional differences in farming practices and characteristics, geography, watersheds, and soil types.
FARMER PERCEPTION
How does the perception of the significance of field P loss to water resources differ based on county, farm size, age, and educational level?
On the Likert scale (1=strongly disagree to 5=strongly agree), Ohio farmers tended to agree with the statement “Farm field P loss is a significant problem to our water resources” (Fig. 2). Survey responses indicated no difference among farm size, educational level, or age. Significant differences existed among regions of the state.
In response to the statement “Farm field P loss is a significant problem to our water resources,” farmers in the Southwest had a mean Likert rating of 3.944, compared to a mean rating of 3.866 in the Northwest and 3.862 in the East. The rating for each region indicates overall acceptance of the idea that agricultural P loss is a water quality concern. There was significant difference in response between the Southwest and Northwest. Compared to the Southwest, farmers in the Northwest had less agreement on the statement that agricultural P loss is a significant problem for water quality.
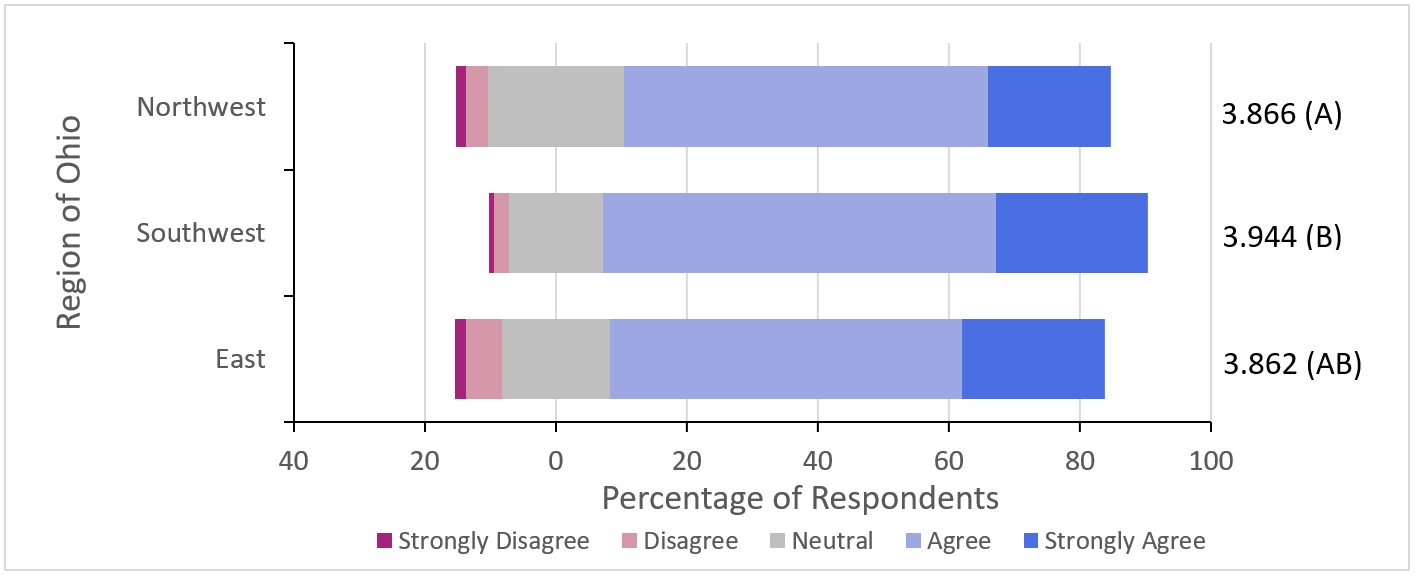
Fig. 2. Survey response to the statement “Farm field P loss is significant problem to our water resources.” Regions followed by the same letter are not significantly different (Kruskal-Wallace multiple comparisons, p≤0.05).
How does county, farm size, age, and educational level impact perception of yield limitations due to current Tri-State Fertility Recommendations for P?
Ohio farmers were divided over the statement “Current Tri-State recommendations for P will limit corn and soybean yields” (Fig. 3). Results indicated no difference in responses based on age, farm size, or region of the state. Significant differences existed between farmer education levels.
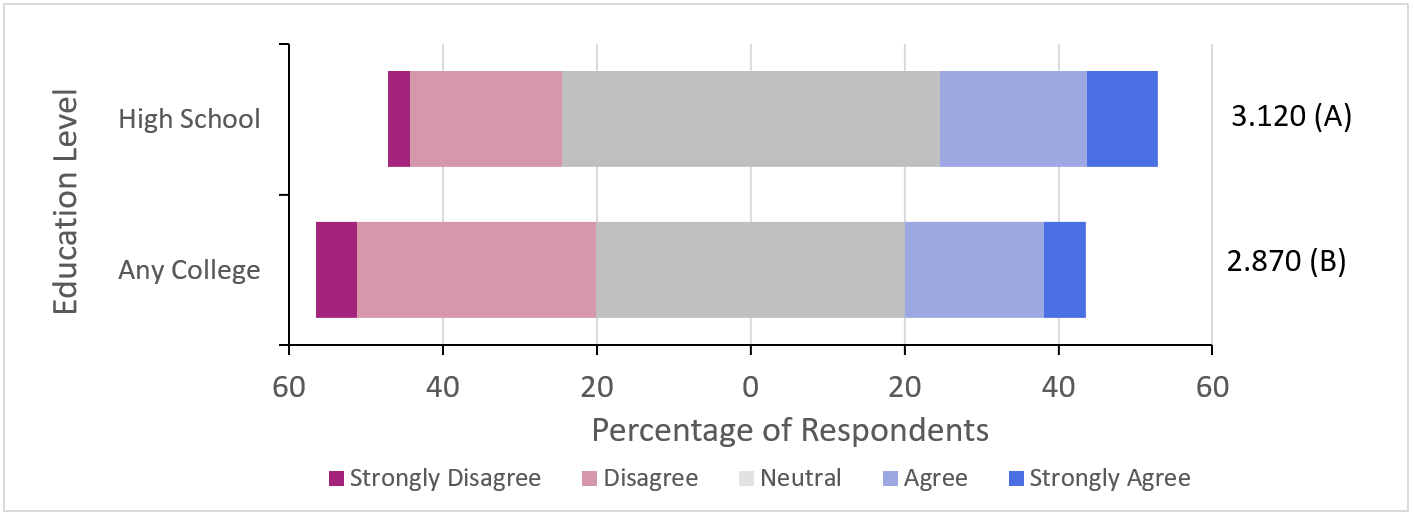
Significant differences exist between famers of different education levels with regard to the perception that Tri-State Fertility guide recommendations limit corn and soybean yields. Compared to farmers with any amount of college education, farmers with only a high school degree were more likely to be neutral or agree that Tri-State Fertility recommendations limit yields. Only about 23% of farmers with only a high school degree agreed or strongly disagreed with the statement that the recommendation limit yield, compared with 36% of farmers with a college education.
FARMER PRACTICES
How does location and farm size impact the method used when soil sampling?
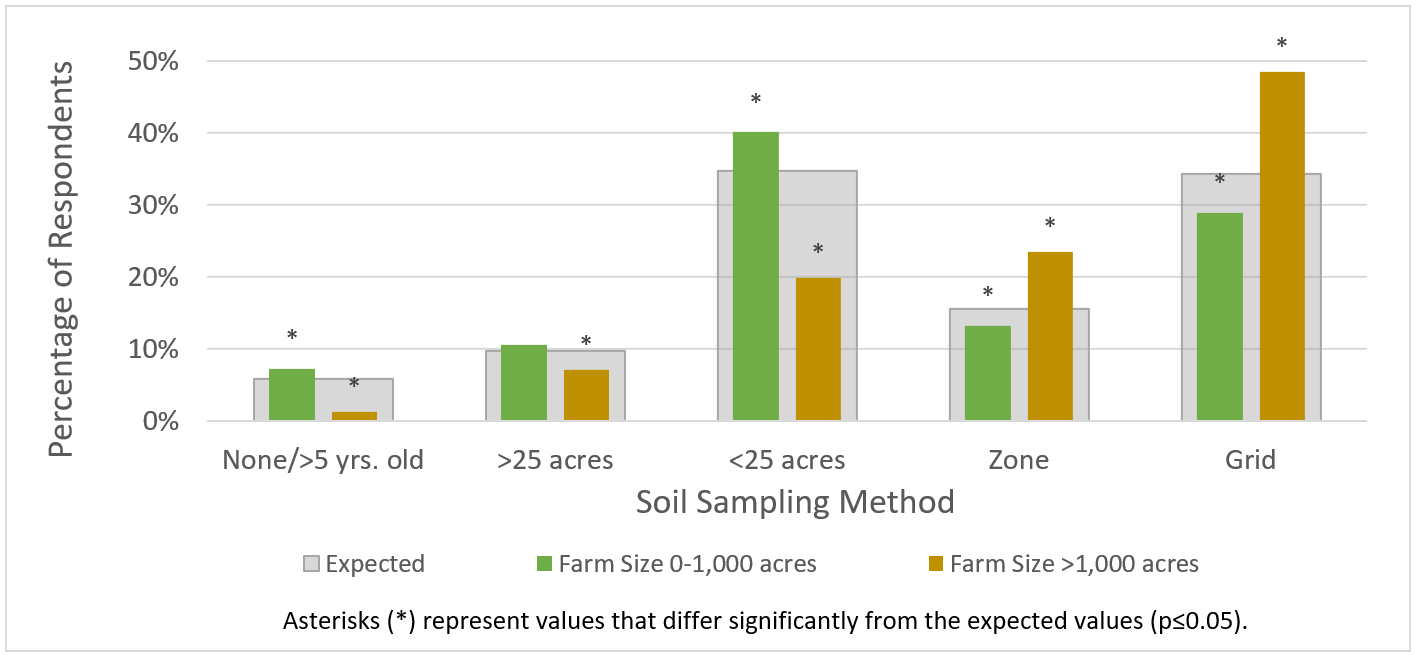
Respondents were asked to describe soil sampling practices by selecting one of the following choices: more than 25 acres per soil sample; less than 25 acres per soil sample; grid soil samples; zone sampling by soil type; zone sampling by yield monitor; not sampling or using soil samples older than 5 years. Significant differences in soil sampling methods exist by farm size (Fig.4). Farms of 0-1,000 acres indicated significantly less grid sampling, less zone sampling, and more frequent use of no sampling or soil sampling greater than 5 years old, compared to > 1,000 acre farms. For the larger farms, 48.5% utilized grid sampling (2.5-5 acre grids) compared to 28.9% of the smaller farms. Zone sampling was used by 23.4% of larger farms compared to 13.2% of the smaller farms. Additionally, 1.3% of farmers over 1,000 acres indicated they did not soil sample or used soil samples older than 5 years, compared to 7.2% of farmers sized 0-1,000 acres.
Significant differences in soil sampling methods also existed by region (Fig. 5). The East utilized less grid and zone sampling than either the Northwest or Southwest. For the Northwest, 20.6% utilized zone sampling, significantly higher than the 9.8% of respondents from the East. The Southwest utilized more grid sampling, with 42.7% using grid samples compared to 33.0% and 21.5% in the Northwest and East, respectively.
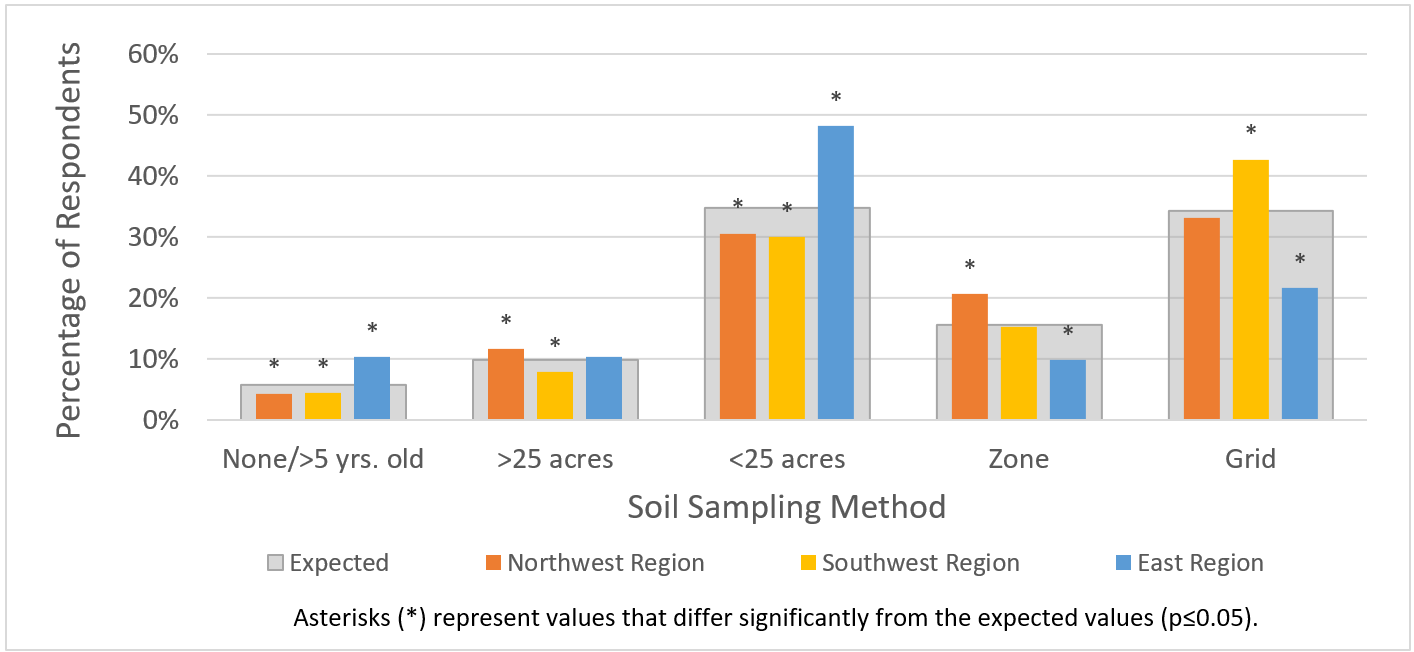 Fig. 5. Soil sampling methods utilized in Ohio regions. Expected response rate is calculated based on a normal Chi-Square distribution.
How does location and farm size impact when the majority of P fertilizer is applied?
Significant differences in timing of P applications existed by farm size (Fig. 6). Larger farms more frequently reported fall application of P compared to smaller farms. Of larger farms, 41.9% applied P in the fall (September – November) compared to 24.8% of small farms. Only 47.7% of the larger farms applied P in the late spring or summer (March – August), which is significantly lower than similar application times on small farms (63.4%).
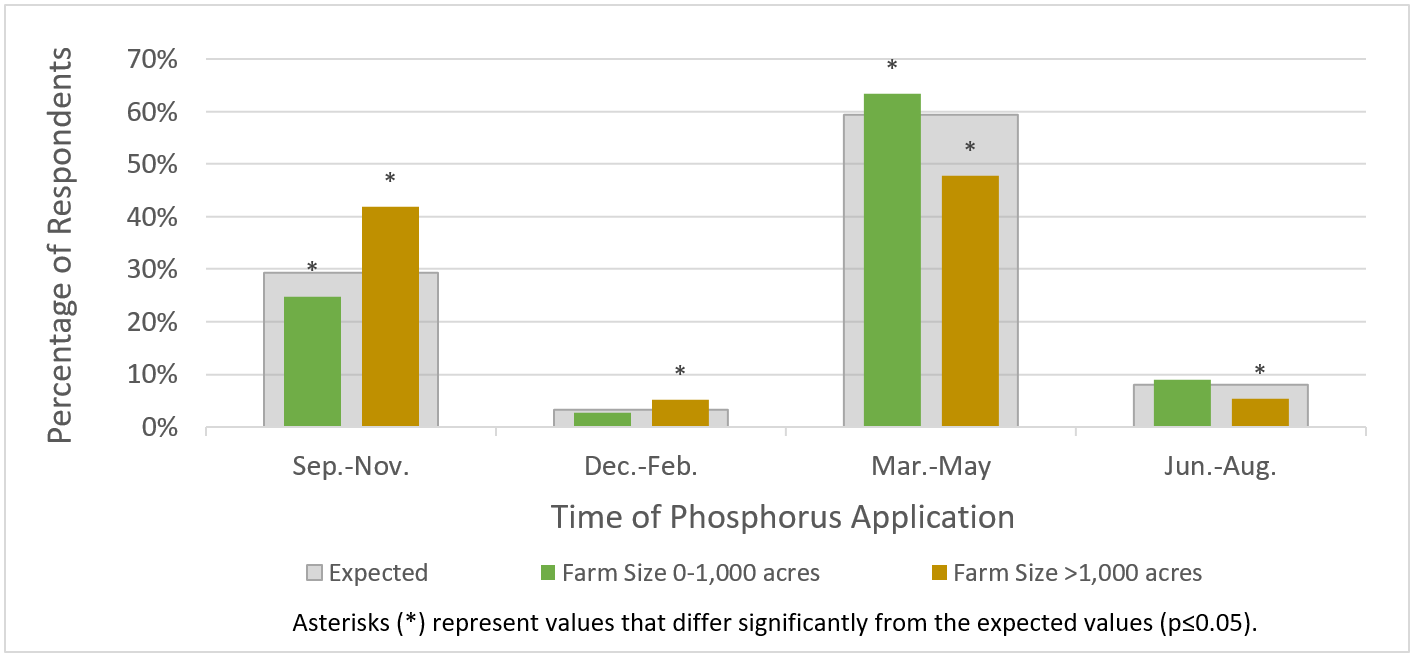 Fig. 6. P application time for large and small farms. Expected response rate is calculated based on a normal Chi-Square distribution.
Differences in timing of P applications also existed by region (Fig. 7). Regardless of region, the majority of farmers favored spring applications of P. Differences existed in fall application based on region, with farmers in the East significantly less likely to report fall application. Survey responses showed 33.9% of farmers in the Southwest and 34.7% in the Northwest report fall application, compared to 14.8% in the East. In the East, 83.0% of farmers reported P application in March – August, compared to 61.0% and 63% for the Southwest and Northwest, respectively.
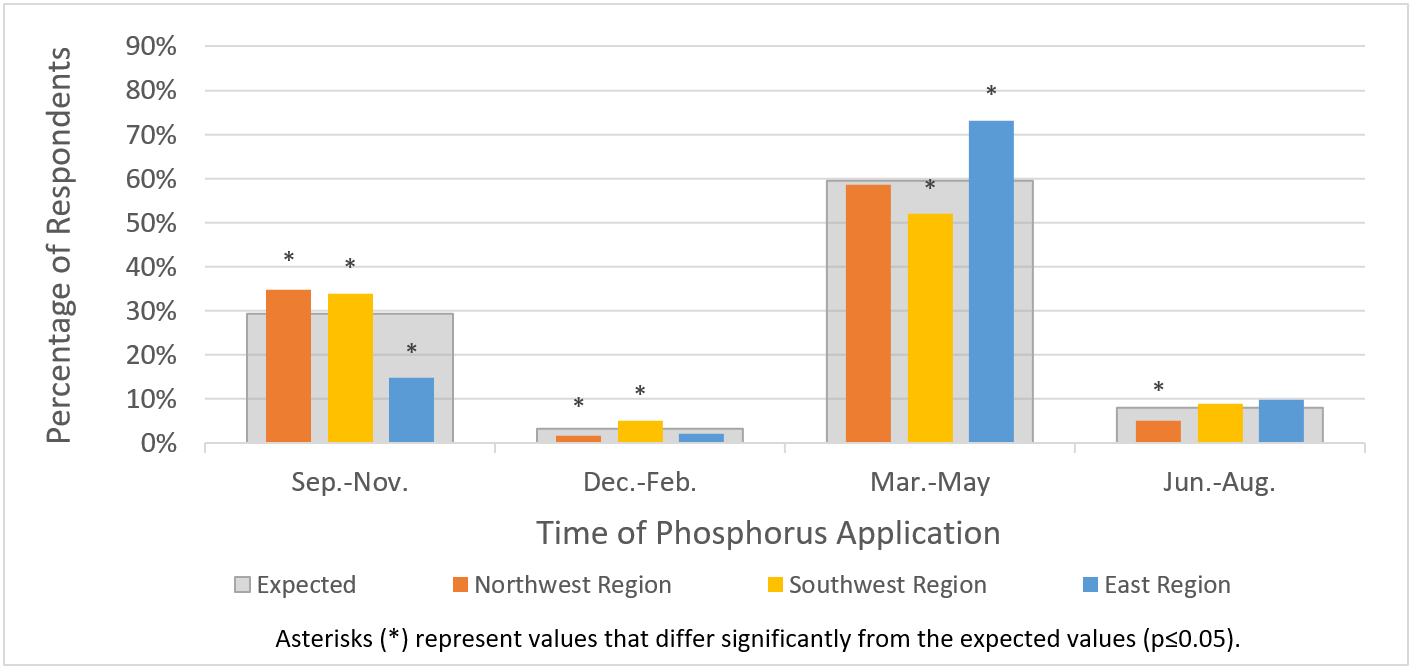 Fig. 7. P application time for Ohio regions. Expected response rate is calculated based on a normal Chi-Square distribution.
WILLINGNESS TO CHANGE
What types of producers plan to change nutrient management practices as a result of the meeting?
Ohio farmers tended to agree with the statement “I will change my nutrient management practices as a result of this meeting” (Fig. 8). Results indicated no differences in response based on age or education level. Significant differences existed for farm size and region.
Farmers with 0-1,000 acres agreed more that they would change practices as a result of the meeting (mean Likert rating = 3.709) compared to a mean Likert rating of 3.500 for farmers with more than 1,000 acres (Fig. 8)). Significant differences in willingness to change practices also existed for region. Compared to farmers in the East (mean Likert rating = 3.750), farmers in both the Southwest (mean Likert rating = 3.619) and Northwest (mean Likert rating = 3.641) were neutral or disagreed more that they would change practices (Fig. 9).
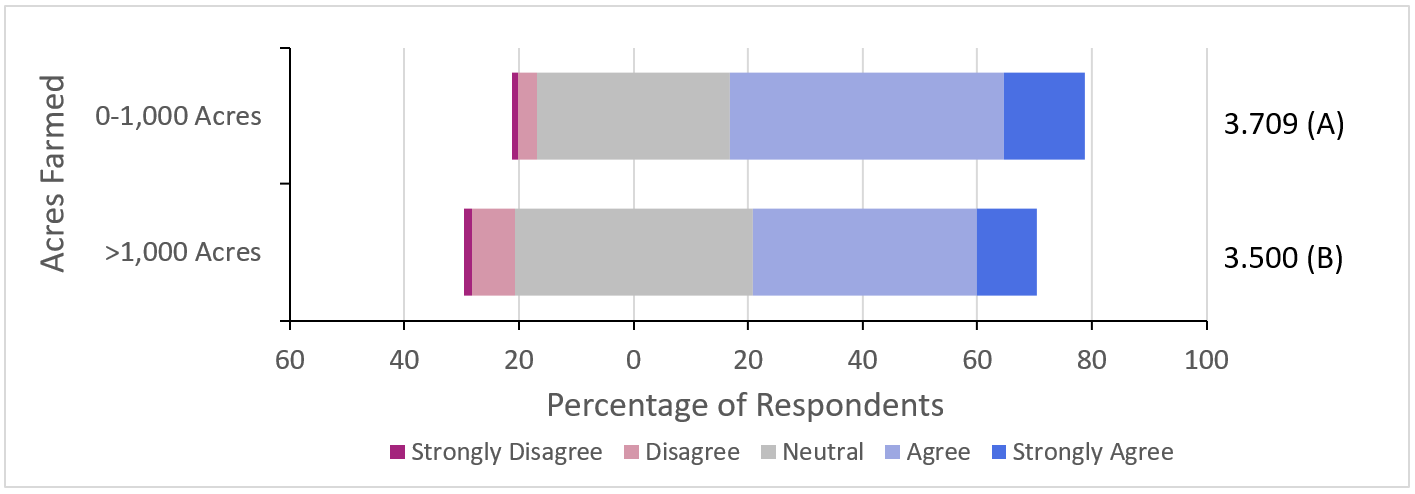 Fig. 8. Farm size response to the statement, “I will change my nutrient management practices as a result of this meeting.” Data followed by the same letter are not significantly different (Kruskal-Wallace multiple comparisons, p≤0.05).
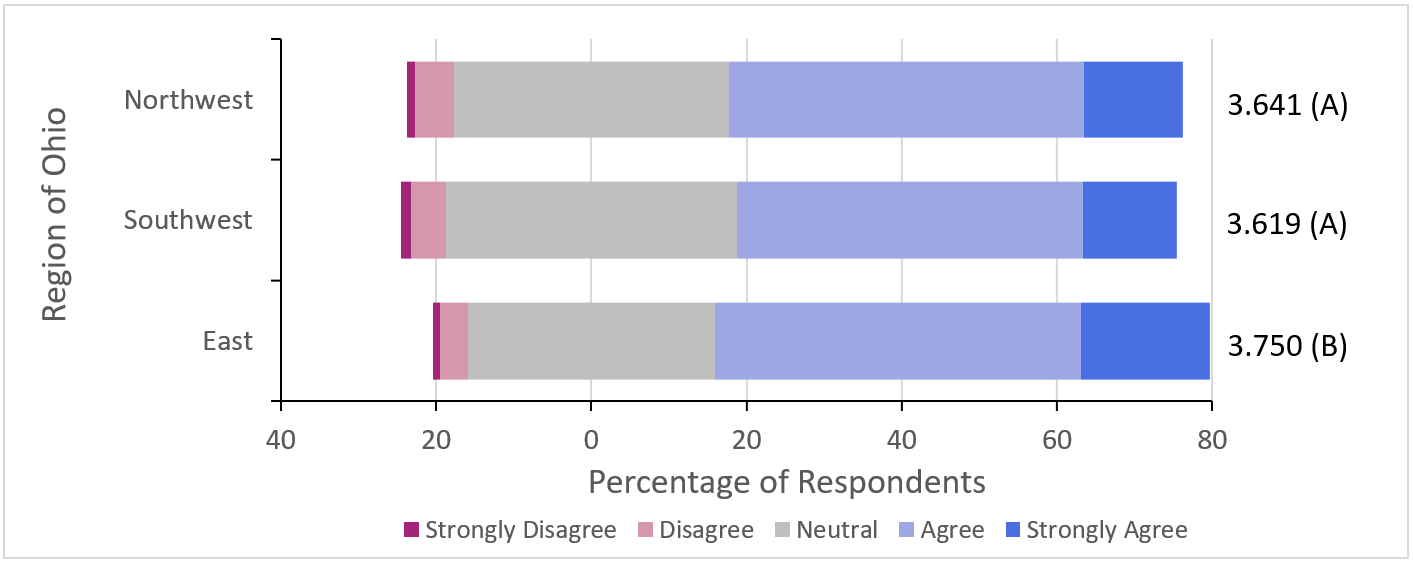 Fig. 9. Geographical response to “I will change my nutrient management practices as a result of this meeting.” Regions followed by the same letter are not significantly different (Kruskal-Wallace multiple comparisons, p≤0.05).
Discussion
The agreement by farmers that farm field P loss is a significant water quality problem seems dependent upon the amount of exposure and education the farmers have received on the topic. Some farmers in the Southwest have been dealing with water quality issues from P loading since 2009. Grand Lake St. Marys has suffered from harmful algal blooms for many years and the watershed was determined to be distressed by the Ohio Department of Natural Resources in 2011. This designation led to the implementation of restrictions on manure application. This area has one of the heaviest concentrations of livestock farms in Ohio (2012 Census of Agriculture). As a result, farmers were aware of the P loading issues and many had been part of conversations pertaining to the role of agriculture in water quality prior to attending FACT programs.
These conversations had not happened as frequently with farmers in the Northwest and East. They had been exposed to the importance of water quality to some extent through the news media and initial meetings with OSUE, Soil and Water Conservation Districts, and Farm Bureau; however, the exposure was not to the extent that it was in the Southwest. There still was some skepticism of the idea that agriculture played a larger role in the water quality issues than rural septic systems or municipalities. This became evident in the survey results when the Southwest region had a stronger agreement that farm field P loss was an issue.
The majority of farmers surveyed have reservations about using the Tri-State Fertilizer Recommendations. The Tri-State guide has not been updated since 1995, and some farmers believe the recommendations may be too low for today’s top yielding hybrids and varieties. Soil fertility specialists are completing research to update the recommendations. This is crucial so farmers feel confident they can be used as a reliable resource from which to base their fertilizer decisions.
The soil sampling methods farmers use to make nutrient decisions did show significant differences, but they were as expected. Larger farms have made the investment into grid or zone sampling, which generally has a higher initial cost than more traditional methods. The East typically has smaller farms and fields compared to the Southwest and Northwest; therefore, it is expected that they would be more similar to the 0-1,000 acre farm responses.
Larger farms were more likely to apply fertilizer in the fall. Drier weather in the fall often helps reduce soil compaction and reduce the workload in the spring. However, there is a greater chance for the nutrients to leave the field during the winter and early spring months. With a larger portion of farms with more than 1,000 acres utilizing fall application, a significant portion of Ohio farm ground is at a greater risk to nutrient loss over the winter. The focus of education and research of Extension Educators should be efficient application methods for large farms in March through August, or to incorporate fertilizer following a fall broadcast application. Moving these large farms away from fall application has the potential to greatly reduce P movement.
Farmers in the Northwest, who fall within the Western Lake Erie Basin watershed, may be less likely to accept responsibility for nutrient losses due to the possibility of additional, stricter regulations. Concern exists that if increased regulations occur in the future, they will hamper a producer's’ ability to economically run an operation by increasing the costs of production. Agricultural groups who provide information to the broader public emphasize that the vast majority of farmers are doing a good job of nutrient management. When farmers hear this, they see less need to change practices.
Extension Educators may have a greater challenge to get larger farm producers and producers in the Northwest and Southwest to change their practices since they believe they are already doing what needs to be done. Even though many of these farmers have already implemented changes such as high resolution soil sampling and working with agronomists to make nutrient decisions, they are still applying most of their fertilizer in the fall.
One benefit of these trainings has been exposure to additional fertility best management practices for smaller producers and farmers in the East. These producers are more willing to change their practices. These small farms are more likely to listen to OSUE Educators for research-based nutrient recommendations since they have fewer opportunities to work with private consultants and professional agronomist.
Conclusion
These findings present an opportunity for Extension Educators to develop programs aimed at producers of all sizes to provide research-based information about nutrient management and water quality. The opportunity also exists to demonstrate to the public the practices farmers utilize to protect water, soil, and rural communities.
The farmers surveyed for this study are required to attend recertification trainings every three years. OSUE plans to continue to use a survey tool to gauge perceptions and practices following recertification trainings into the future. This data will serve as a baseline to compare how perceptions and practices change over time as Ohio continues to focus on water quality issues.
Additionally, these evaluations shed some light on areas for OSUE to focus on as educators continue to deliver fertilizer certification and recertification programs in the future. Based on farmer responses, Extension Educator’s programs will need to focus on getting large farm operators to switch P applications from fall to the March through August timeframe. Concurrently, research needs to address new methods to apply P during the spring and summer months. Moving these large farms away from fall application has the potential to greatly reduce P losses. Continuing to provide sound nutrient management advice to small farms is also important as Extension is the only exposure they have to this information.
References
2012 Census of Agriculture. (2014). Retrieved from: https://www.agcensus.usda.gov/Publications/2012/#full_report
Carmichael, W.W. (2001). Health effects of toxin-producing cyanobacteria: “The Cyano-HABs”. Human and Ecological Risk Assessment 7:1393–1407.
Coastal Resilience Project: Western Lake Erie. (n.d.). Retrieved from: http://coastalresilience.org/project/western-lake-erie/
Graham, J. L. (2007). Harmful algal blooms. US Department of the Interior, US Geological Survey, Fact Sheet 2006-3147
Vitosh, M.L., Johnson, J.W., and Mengel, D.B. (1995). Recommendations for Corn, Soybeans, Wheat and Alfalfa. Extension Bulletin E-2567. Michigan State University, East Lansing, MI.