Journal of the NACAA
ISSN 2158-9429
Volume 11, Issue 2 - December, 2018
A Comparison of Two Years of E. Coli (Escherichia coli) Samples on Utah's Fremont River
- Wilde, T. , Extension Associate Professor, Utah State University Extension
ABSTRACT
In 2016 an E. coli (Escherichia coli) sampling plan was implemented at ten sites along Utah’s Fremont River by the Utah Division of Water Quality. Samples were taken once a month at each of the ten sites in 2016 and 2017. The 2016 samples were collected by a Utah Water Watch volunteer, and the 2017 samples were taken by Utah State University Extension. The IDEXX Colilert 18 method was used to test the samples for E. coli. The samples from 2016 were compared to the samples in 2017 to identify similarities and inconsistencies.
Introduction
The Federal Water Pollution Control Act of 1972 (2017a) legislated all waters of the United States be safe for human recreation. The Federal Water Pollution Control Act of 1972 (2017b) also required states to provide the federal government biennial reports describing water quality for all designated water bodies relative to water quality standards required by the legislation. To fulfill the federal requirements states implemented water sampling programs to analyze water quality in water bodies affected by the legislation (Smith et al., 2001).
E. coli (Escherichia coli) has been identified as an indicator of fecal contamination and has been used to analyze the microbiological quality of water (Hamilton et al., 2005). In 2008 the National Park Service began collecting E. coli samples on tributaries to the Fremont River which runs through Capitol Reef National Park in Wayne County, Utah (Thoma et al., 2017). From 2012 to 2015 samples collected by the National Park Service violated state water quality standards for E. coli (Hackbarth and Weissinger, 2016). As a result of these violations, a segment of the Fremont River which flowed through Capitol Reef National Park upstream to the town of Bicknell, Utah was listed on the Utah Division of Water Quality’s 303(d) impaired water body list (Division of Water Quality, 2016).
The Federal Water Pollution Control Act of 1972 (2017c) requires states to create total maximum daily load values for pollutants of water bodies listed on the 303(d) list and to provide recommendations to resolve exceedances of those standards. In 2016, the Utah Division of Water Quality implemented an E. coli sampling plan to collect data for the total maximum daily load standard. Ten sites from the town of Loa, Utah to Hickman Bridge in Capitol Reef National Park were selected to collect samples.
Due to cost realities associated with monitoring regulated water bodies many states struggle to accomplish monitoring requirements (Smith et al., 2001). As a result of these financial restraints, the Utah Division of Water Quality has relied on volunteers to collect water samples.
A volunteer collected and tested E. coli samples once a month at each of the ten sites in 2016. Previous conflict between the volunteer and the Wayne County Commission resulted in the commission questioning the objectivity of the volunteer. As a result of these concerns, the Wayne County Commission suggested the samples be collected by Utah State University Extension. To resolve these concerns, the Utah Division of Water Quality agreed to have Extension collect and analyze the samples. Extension started collecting the samples in April 2017.
This article compares the two years of E. coli samples and identifies common trends.
Methods
All samples were collected according to water sampling protocols established by the Utah Division of Water Quality. Samples for this study were collected once a month at ten sites along the Fremont River from April 2016 to March 2018 with two exceptions in November of 2016 and February of 2017. One control sample was prepared before each sample run by filling a one hundred milliliter bottle with bottled water purchased from a grocery store. Two one hundred milliliter water samples were collected at each of the ten sites. Samples from all ten sites were collected in a single day. The control sample and all samples from the ten sites were kept on ice in a cooler until they were ready to be analyzed.
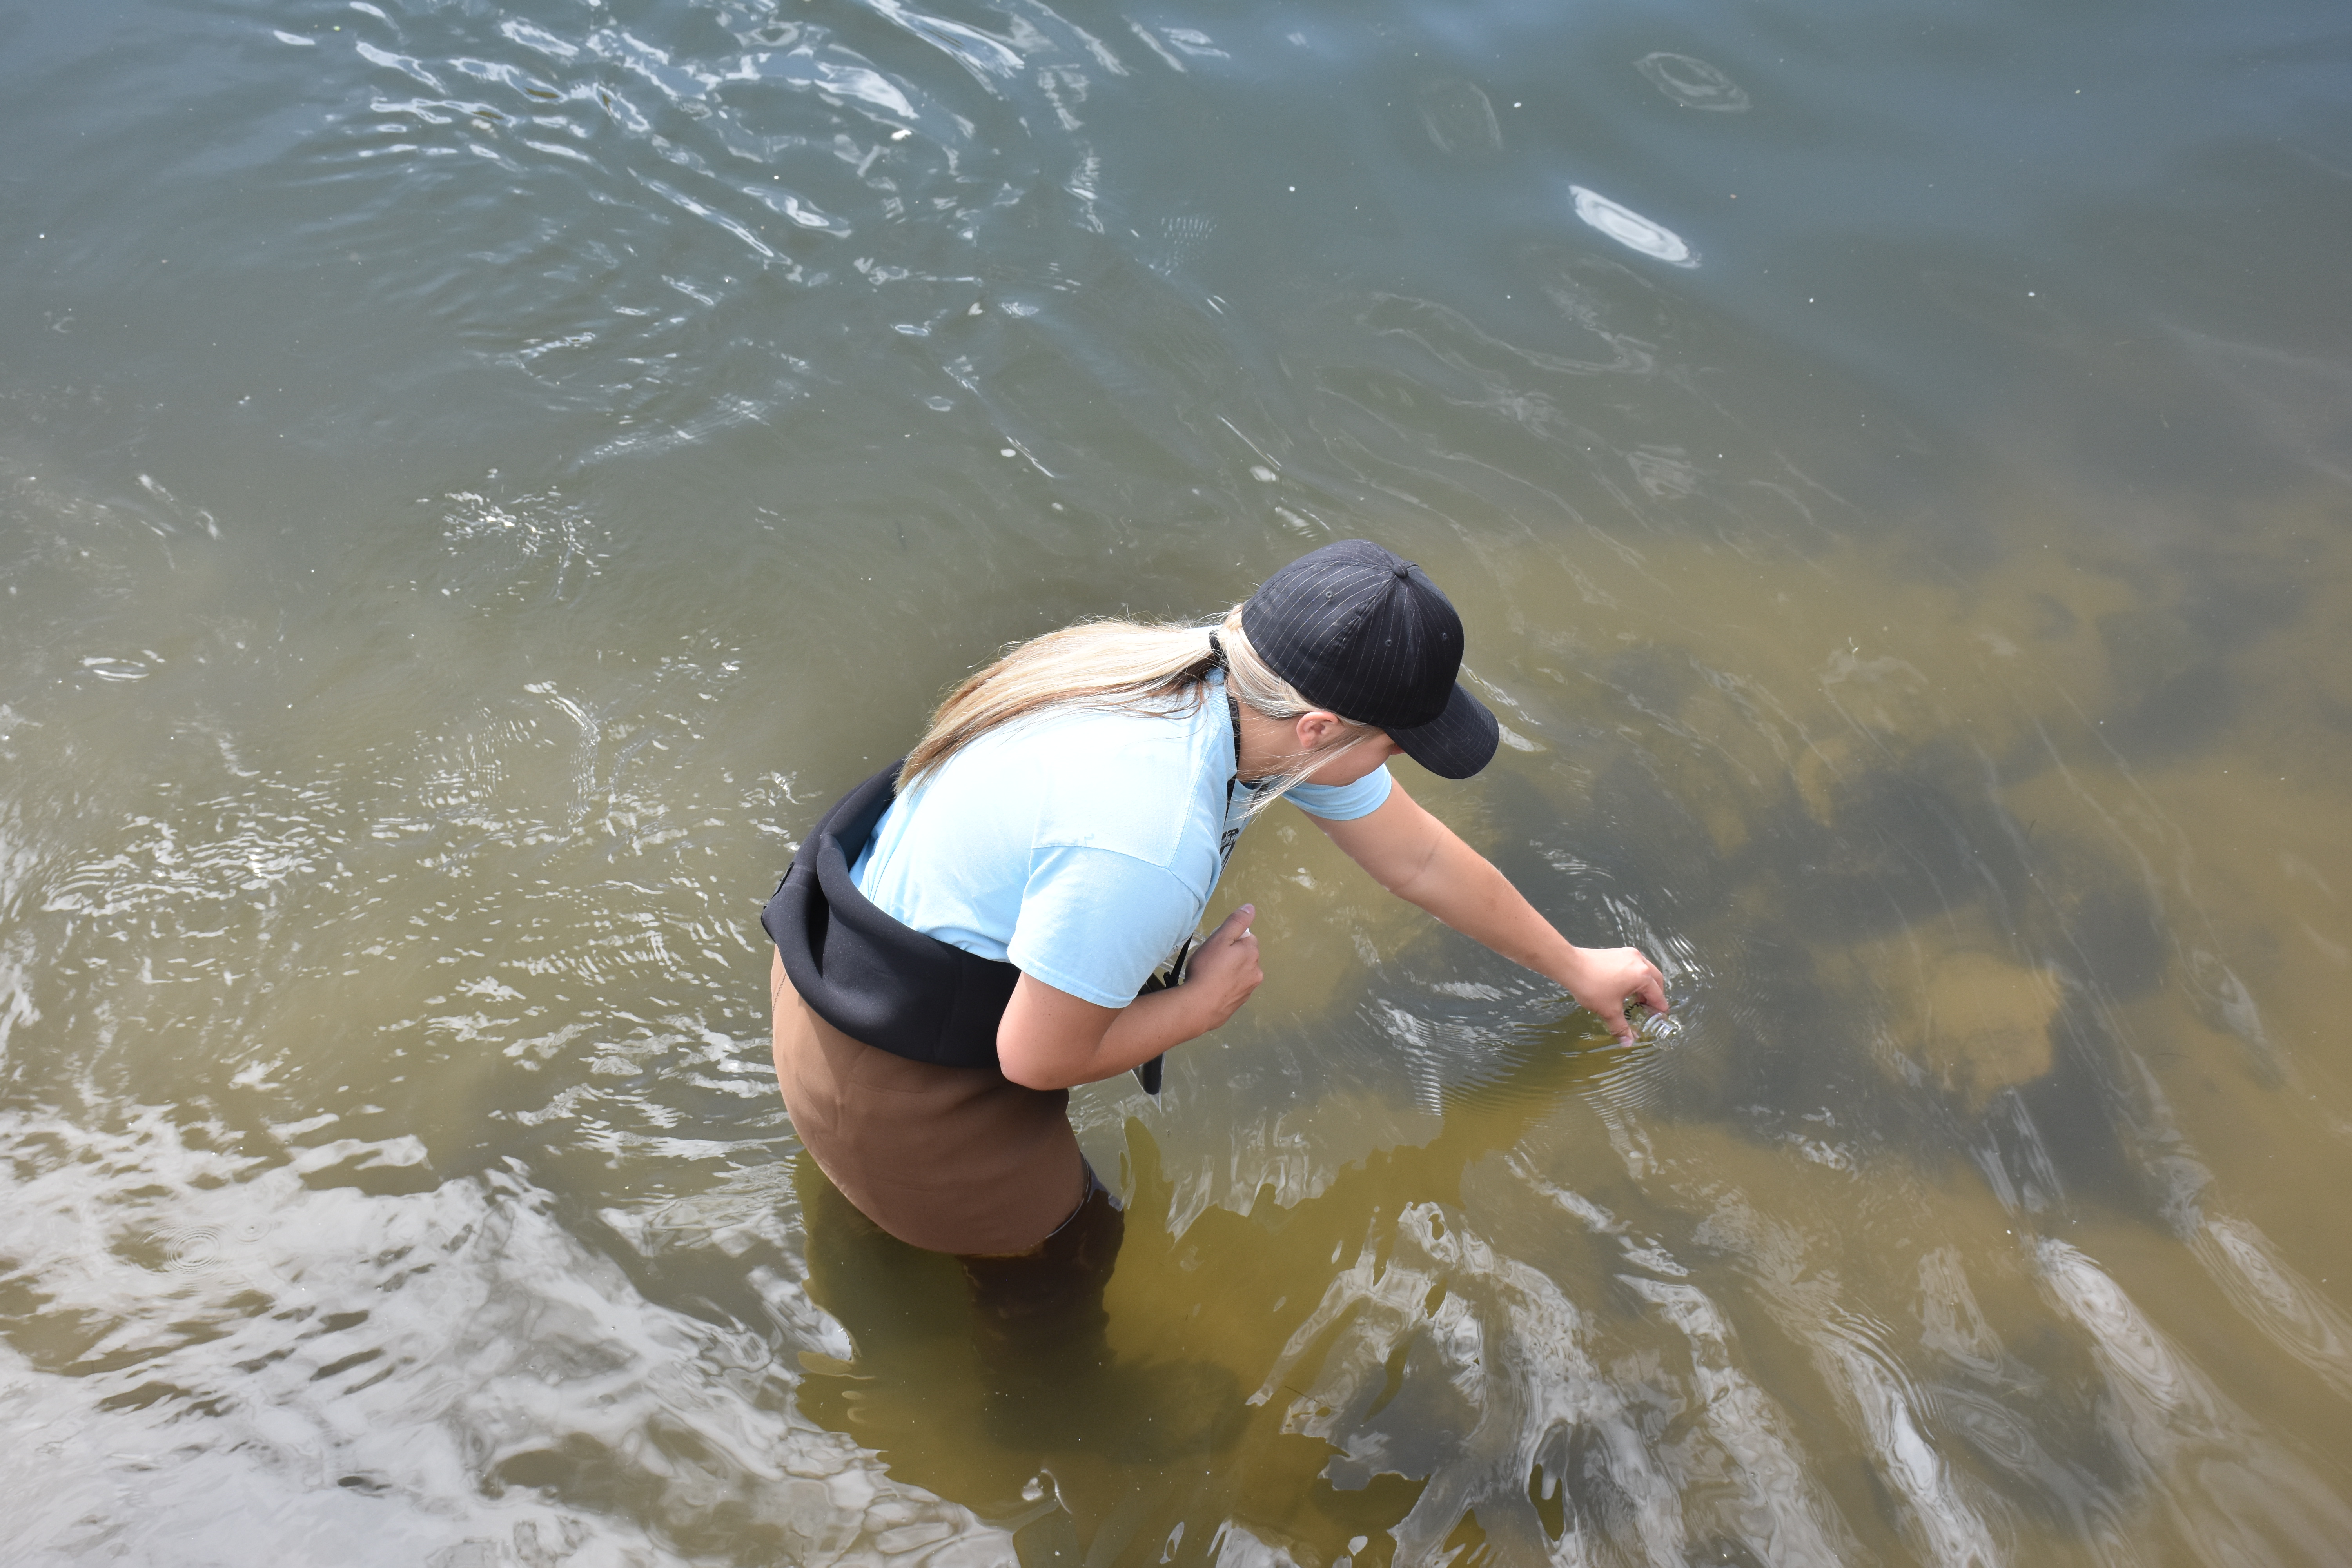
Figure 1. Extension intern collecting water sample.
The samples were tested for the presence of E. coli using the IDEXX Quanti-Tray/2000® and Colilert®-18 system. On the day the samples were collected, one snap pack of Colilert®-18 reagent was added to each one hundred milliliter water sample including the control sample. After the reagent was dissolved in the sample, each sample was poured into a Quanti-Tray/2000® tray and sealed using an IDEXX Quanti-Tray® Sealer. The sealed trays were incubated in a preheated incubator at thirty-five degrees Celsius for eighteen hours.
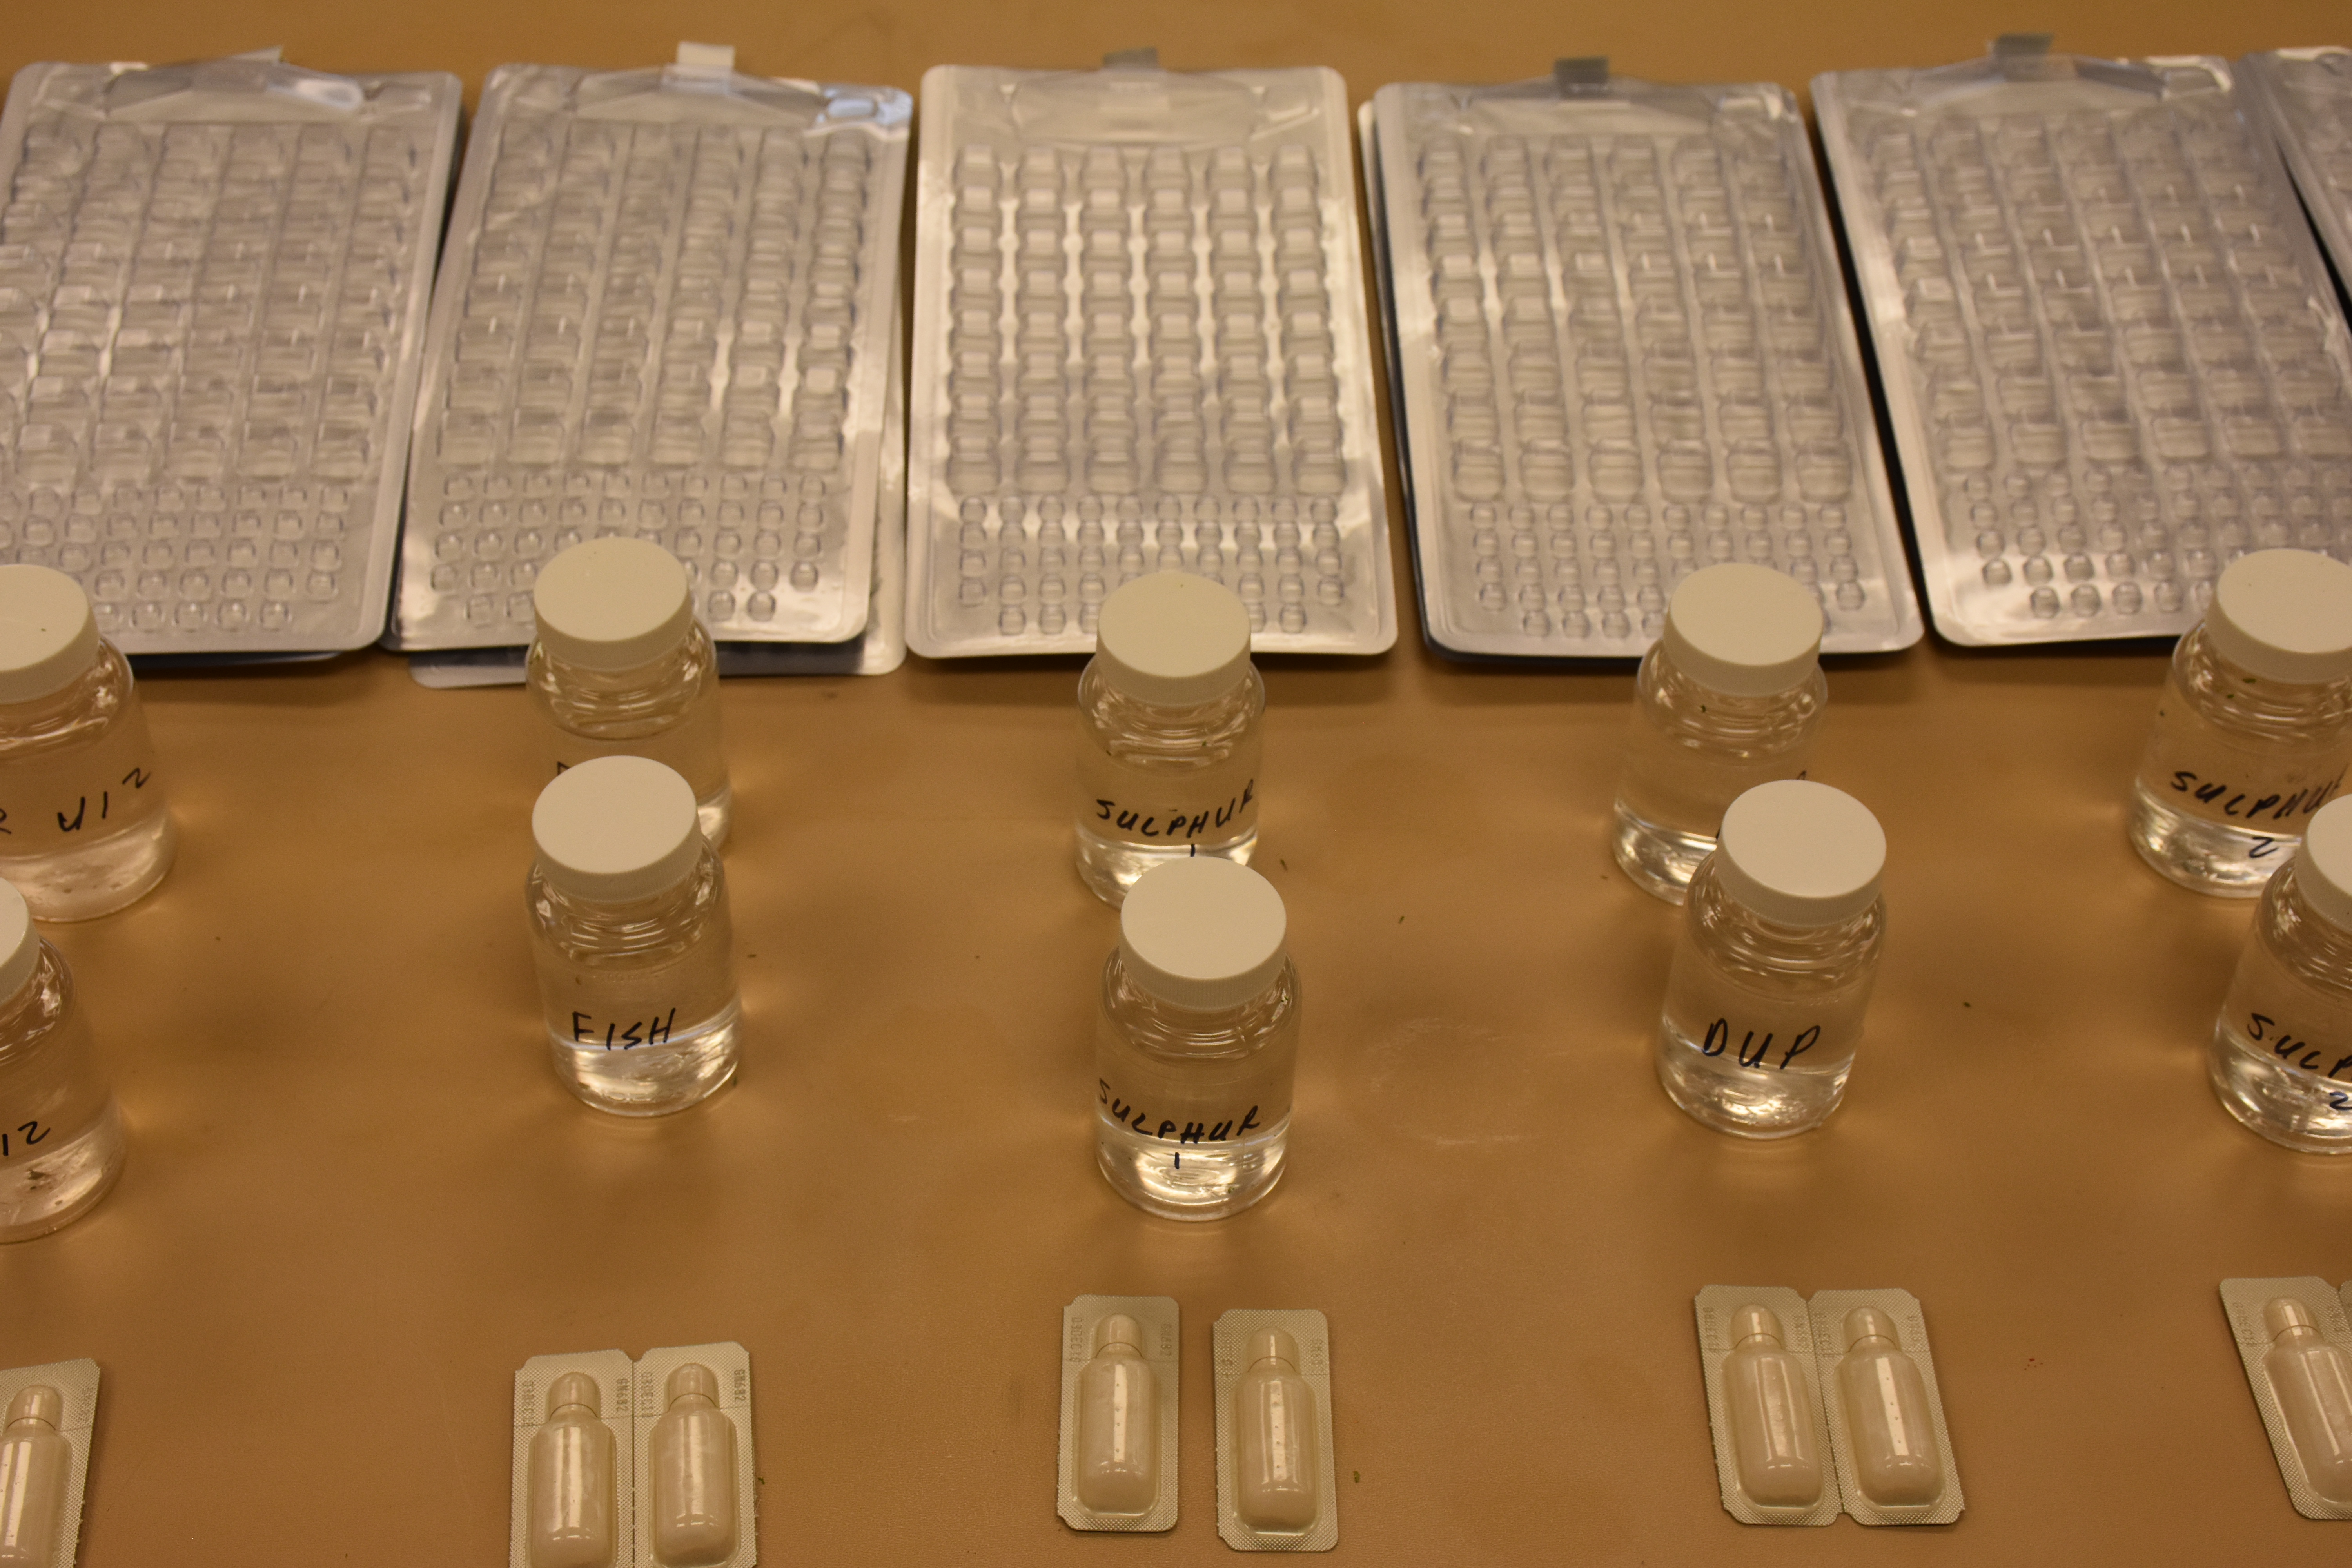
Figure 2. Samples, trays and reagents used for testing.
After eighteen hours in the incubator, the samples were removed from the incubator. Immediately after being removed from the incubator each tray was inspected for the presence of total coliforms and the presence of E. coli. Each tray had forty-nine large wells and forty-eight small wells. Each well was compared to a comparator tray provided by IDEXX.
In full light a yellow colored well indicated the well tested positive for total coliforms. To identify the presence of E. coli the room was darkened, and an ultraviolet (UV) light was reflected on the tray. In the presence of UV light, wells which fluoresced indicated the well tested positive for E. coli. For each tray the number of large and the number of small wells which tested positive for total coliforms were written on a sample sheet, and the number of large wells and the number of small wells which tested positive for E. coli were also written on the sample sheet.
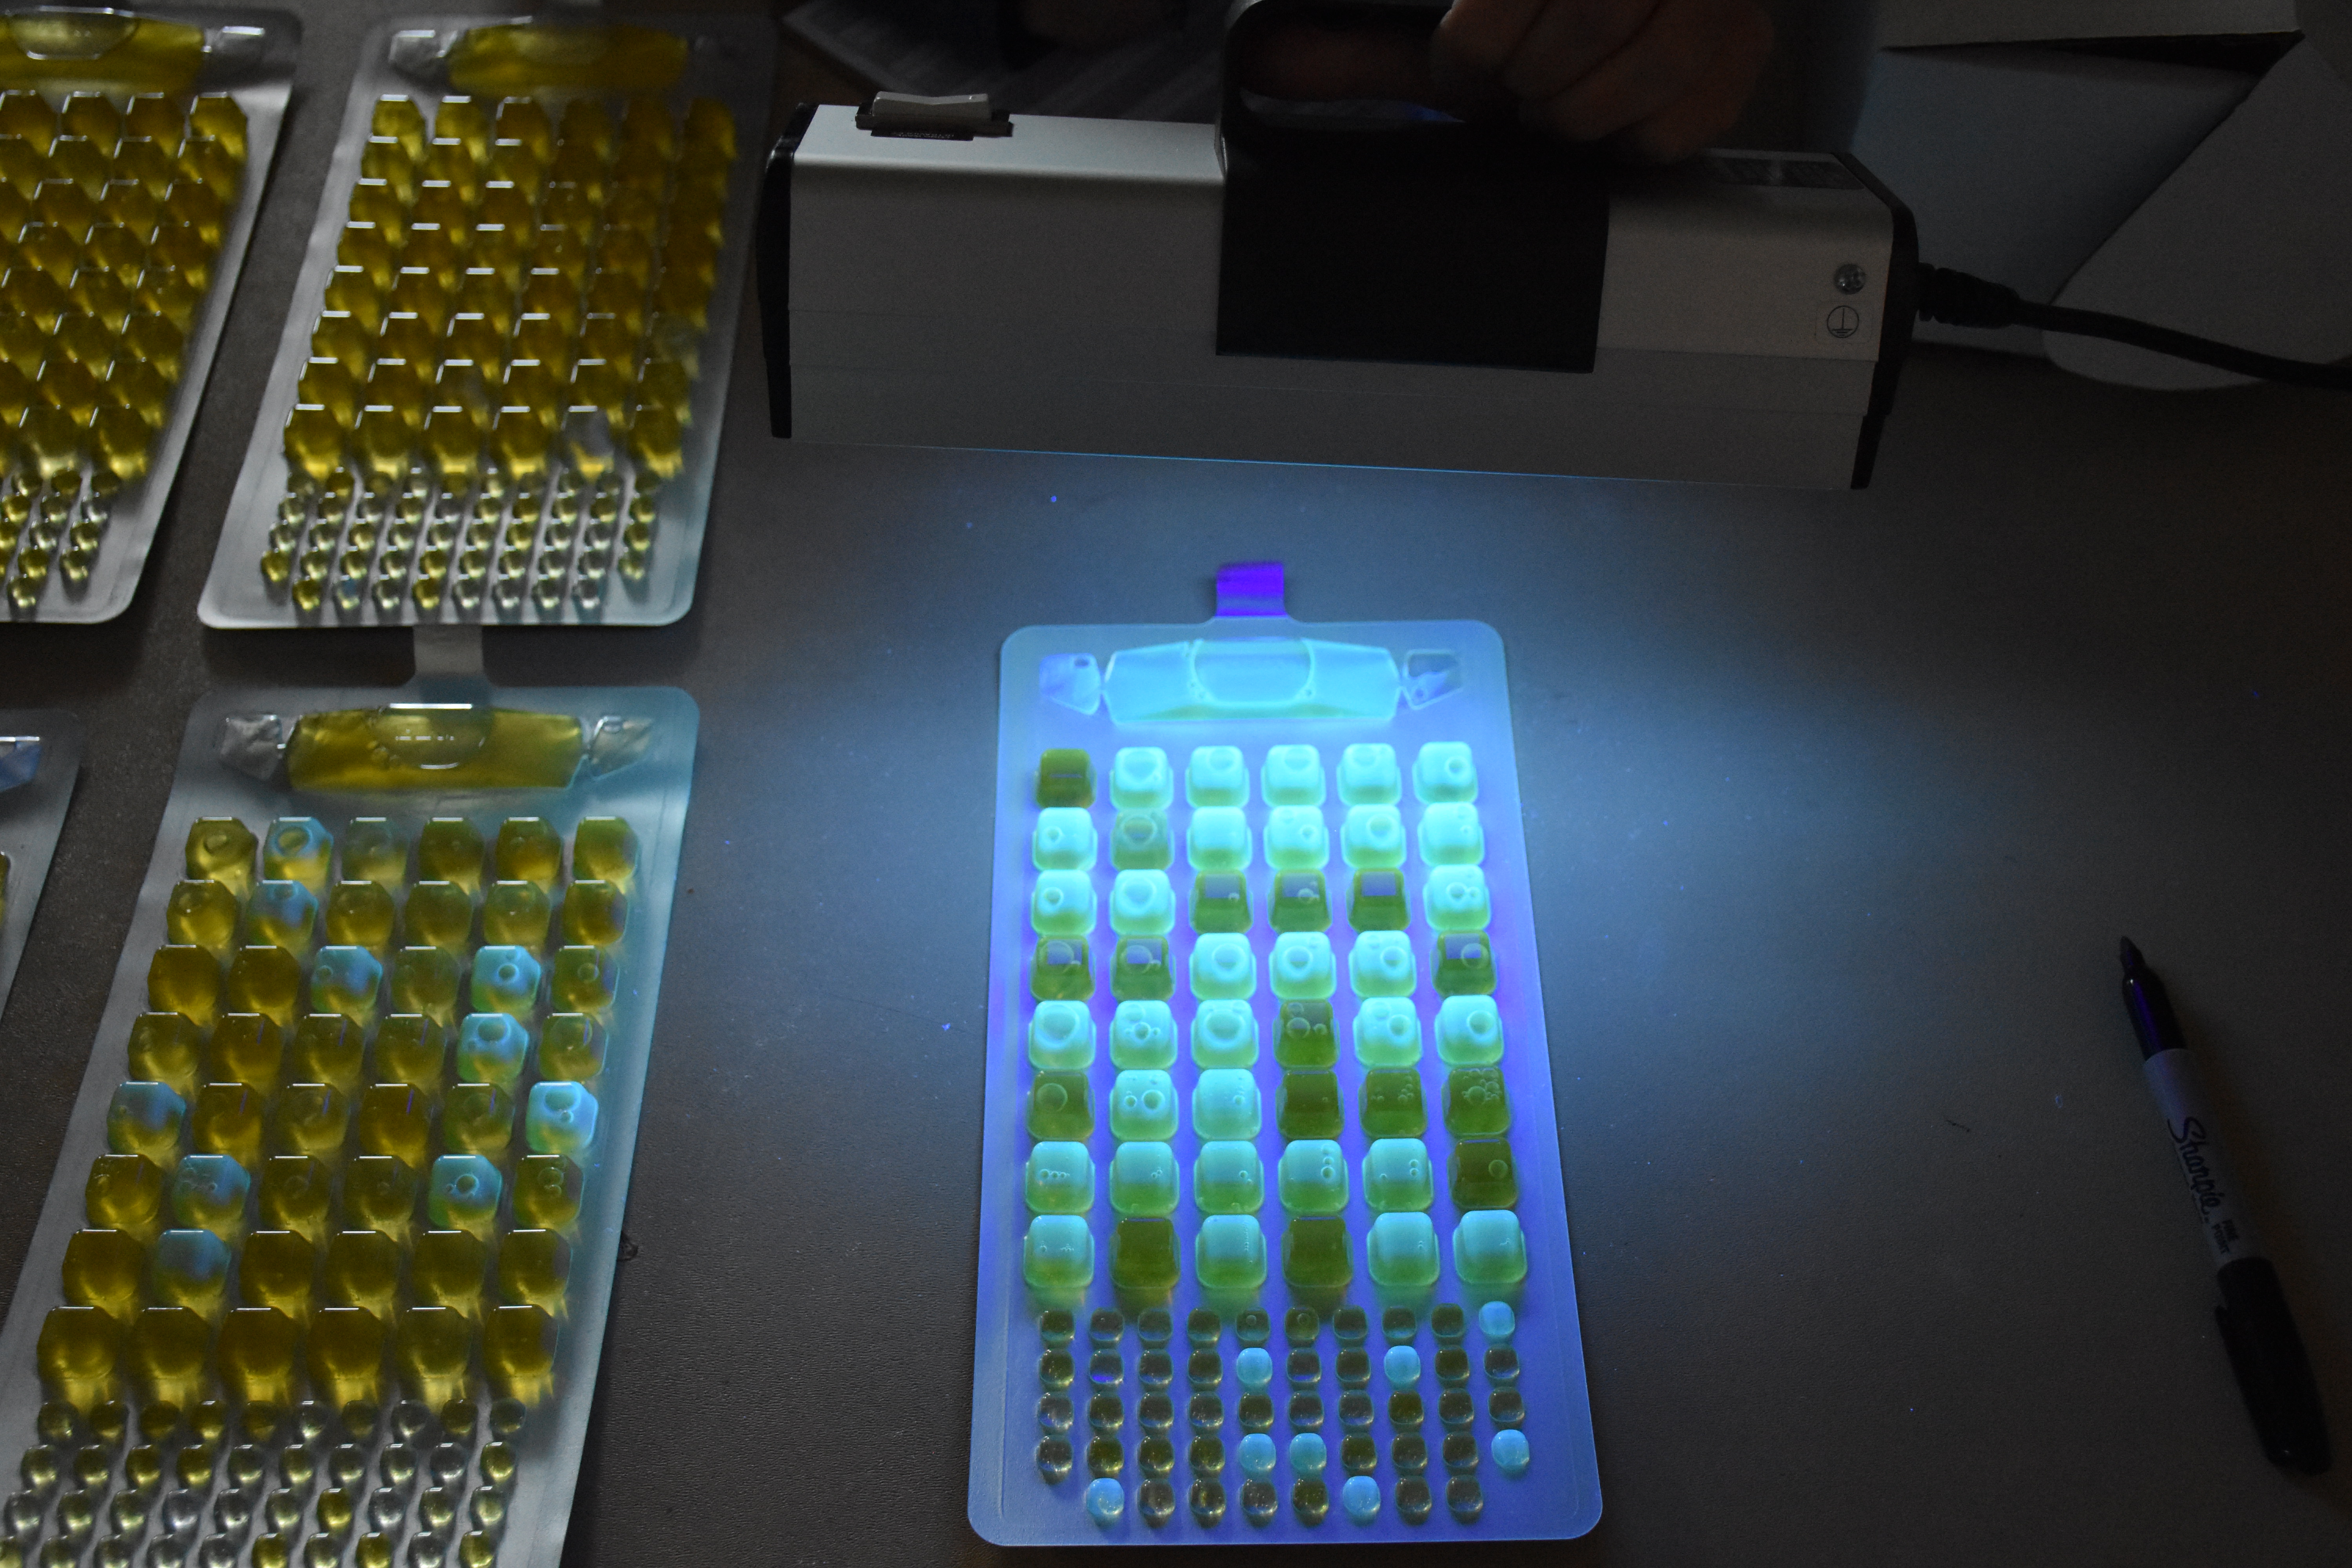
Figure 3. Fluoresced wells under UV light
The number of large wells and the number of small wells from each tray which tested positive for total coliforms were entered into the IDEXX Water MPN Generator to calculate the Most Probable Number of total coliforms for each one hundred milliliter sample, and the number of large wells and the number of small wells from each tray which tested positive for E. coli were enter into the IDEXX Water MPN Generator to calculate the Most Probable Number of E. coli for each one hundred milliliter sample.
The E. coli MPN/100 ml numbers for each sample were compared to the Utah Division of Water Quality’s E. coli standard. The UDWQ E. coli standard defined anything over 409 MPN/100 ml as a violation of state water quality standards.
Results
The E. coli MPN/100 ml numbers for the samples taken between April 2016 and March 2018 are shown in Table 1. The numbers shown are the higher value of duplicate samples at each site. The results indicate one major trend in the data. For sites where water flow was diverted for irrigation during the summer months, E. coli violations consistently occurred during the summer months peaking in July during the peak of irrigation season then receding during the winter months as diverted flows returned to the channel. These results suggest that spikes in E. coli violations during the summer months are correlated with the lack of dilution compared to the winter months.
Table 1. E. coli MPN/100ml for ten sites on Fremont River and tributaries. The numbers shown are the higher value of duplicate samples at each site. Numbers exceeding the UDWQ E. coli standard are shown in bold. A volunteer collected samples from 4/29/16 through 3/23/17, while later samples were collected by Extension personnel. Spring Creek (Spring Crk.) and the Fremont River above the Big Rocks site (Big Rocks) are largely diverted for irrigation during the irrigation season.
| Sampling Date | Spring Crk. | Big Rocks | Bicknell | Fish Cr. | F.R. U12 | Sulphur 1 | Sulphur 2 | Hatties | Camp | Hickman |
|---|---|---|---|---|---|---|---|---|---|---|
| 4/29/16 | 29 | 575 | 77 | 4 | 66 | 44 | 53 | 50 | ||
| 5/30/16 | 1553 | 24 | 37 | 9 | 31 | 19 | 64 | 248 | 34 | 1733 |
| 6/30/16 | 1553 | 1553 | 308 | 345 | 411 | 139 | 2420 | 210 | 225 | 187 |
| 7/29/16 | 517 | 548 | 222 | 88 | 727 | 2019 | 387 | 411 | 461 | 461 |
| 8/29/16 | 435 | 291 | 261 | 73 | 54 | 236 | 308 | 308 | 248 | 387 |
| 9/27/16 | 1300 | 548 | 45 | 37 | 118 | 77 | 201 | 70 | 150 | 214 |
| 10/29/16 | 248 | 214 | 36 | 770 | 43 | 22 | 20 | 47 | 68 | 55 |
| 12/12/16 | 488 | 26 | 34 | 37 | 51 | 135 | 31 | 48 | 53 | 64 |
| 1/11/17 | 365 | 345 | 48 | 58 | 28 | 57 | 12 | 52 | 44 | 33 |
| 3/23/17 | 210 | 1986 | 161 | 291 | 137 | 68 | 157 | 160 | 57 | 161 |
| 4/27/17 | 345 | 921 | 260 | 8 | 46 | 128 | 119 | 29 | 28 | 45 |
| 5/25/17 | 238 | 115 | 153 | 5 | 140 | 16 | 82 | 11 | 20 | 44 |
| 6/21/17 | 921 | 326 | 222 | 31 | 275 | 6 | 1986 | 147 | 248 | 345 |
| 7/19/17 | 2420 | 2420 | 435 | 127 | 1046 | 249 | 192 | 1046 | 921 | 727 |
| 8/30/17 | 548 | 105 | 126 | 42 | 249 | 111 | 210 | 72 | 186 | 365 |
| 9/13/17 | 12038 | 115 | 121 | 88 | 142 | 260 | 210 | 91 | 75 | 115 |
| 10/12/17 | 3658 | 435 | 88 | 12 | 113 | 108 | 99 | 86 | 73 | 99 |
| 11/7/17 | 345 | 84 | 91 | 3 | 82 | 79 | 81 | 57 | 59 | 61 |
| 12/11/17 | 179 | 120 | 31 | 2 | 20 | 10 | 13 | 14 | 15 | 11 |
| 1/4/18 | 345 | 127 | 48 | 3 | 27 | 16 | 10 | 33 | 22 | 12 |
| 2/7/18 | 140 | 129 | 16 | 1 | 32 | 3 | 3 | 35 | 38 | 36 |
| 3/13/18 | 166 | 228 | 111 | 4 | 35 | 10 | 3 | 23 | 14 | 16 |
With few exceptions, channels where flows were not diverted for irrigation remained well under the standard throughout the year (all but Spring Creek and Big Rocks; Table 1). An important exception to the trend was the Sulphur Creek site (Sulphur 2) near the picnic area in Capitol Reef National Park. This site tested at or near maximum readings for the test in both June of 2016 and June of 2017 while the Sulphur Creek site approximately one mile upstream (Sulphur 1) remained consistently under the standard during these same dates.
Although there appeared to be consistent sources of E. coli in these water bodies throughout the year, spikes in E. coli violations occurred consistently during the summer months on the streams where water was being diverted for irrigation (Spring Creek and Big Rocks).
The repeated at- or near-maximum E. coli test levels on the lower Sulphur Creek site in the month of June while the upper site remained consistently under the standard during the same period suggests a source of contamination between the upper and lower sites at this specific time of year.
Discussion
Livestock and wildlife have access to these streams throughout the year. It is suspected that livestock and wildlife are the sources of E. coli in the majority of these waters. Because livestock and wildlife have access to these streams throughout the year, the amount of E. coli present may not change significantly throughout the year. Where state standards are based upon concentrations of E. coli rather than total E. coli, violations of the state standard during the summer months may not be the result of increased E. coli contributions. Further study is needed to determine if E. coli contributions by livestock and wildlife vary throughout the year, or if E. coli concentrations rise during the summer months solely due to decreased flows due to diversion for irrigation.
The one exception to this observation is the lower Sulphur Creek site. Livestock are not present in this location, and wildlife are relatively few. Human contributions are a more likely cause in this area. Large numbers of tourists congregate in this area, and the septic system infrastructure for the buildings in the park are located between the upper and lower sites. Further study is needed to verify ongoing issues and pinpoint any possible sources of pollutants.
Literature Cited
Division of Water Quality. (2016). Utah’s final 2016 Integrated Report. Salt Lake City, UT: Utah Department of Environmental Quality.
Federal Water Pollution Control Act of 1972, 33 U.S.C. § 1251 (2017a).
Federal Water Pollution Control Act of 1972, 33 U.S.C. § 1315 (2017b).
Federal Water Pollution Control Act of 1972, 33 U.S.C. § 1313 (2017c).
Hackbarth, C., and Weissinger, R. (2016). Water quality in the Northern Colorado Plateau Network, water years 2013-2015. (Natural Resource Report NPS/NCPN/NRR-2016/1332). Fort Collins, CO: National Park Service.
Hamilton, W. P., Kim, M., and Thackston, E. L. (2005). Comparison of commercially available Escherichia coli enumeration tests: implications for attaining water quality standards. Water Research, 39(20), 4869-4878.
Smith, E. P., Ye, K., Hughes, C., and Shabman, L. (2001). Statistical assessment of violations of water quality standards under section 303(d) of the Clean Water Act. Environmental Science and Technology, 35(3), 606-612.
Thoma, D., Thomas, H., Sharrow, D., Wynn, K., Brown, J., and Beer, M. (2017). Water quality vital signs monitoring protocol for park units in the Northern Colorado Plateau Network: version 1.03 (Natural Resource Report NPS/NCPN/NRR-2017/1499). Fort Collins, CO: National Park Service.