Journal of the NACAA
ISSN 2158-9429
Volume 12, Issue 1 - June, 2019
Marketing Locally-Grown Fish to Restaurants: Results from Kentucky and Ohio
- Bryant, R.C., Extension Associate, Kentucky State University
Dasgupta, S., Professor and Principal Investigator, Kentucky State University
Wright, A., Small Farms Agent, Kentucky State University
Caporelli, A., Aquaculture Coordinator, Kentucky Department of Agriculture
Tiu, L., Extension Agent, University of Florida
ABSTRACT
Restaurants are increasingly featuring locally grown food. While locally grown vegetables and meat seem to be popular, locally grown fish could be another product option. This paper presents data related to the marketing of locally grown fish to independent restaurants in Kentucky and Ohio. The results show that restaurants are interested in several types of locally-grown fish; however, their top choices were trout, hybrid striped bass, and catfish. Using the restaurants’ stated willingness to pay as a guide, the sales of whole trout and catfish fillets could be profitable for local, small-scale farmers.
INTRODUCTION
Many independent restaurants are exhibiting a trend of buying locally grown foods that has created marketing opportunities for small-scale growers. Perhaps this is fueled by a greater interest among U.S. consumers to narrow the separation between the consumers and farmers; or it could be that chefs, like other concerned Americans, are interested about food origins before making purchasing decisions (Curtis and Cowee, 2009).
In Kentucky and neighboring states, where there are a large percentage of small-scale farms, locally grown food is often more expensive to produce than food imported from large-scale domestic or international suppliers. Fortunately, many restaurants interested in locally grown food had indicated that price is of less importance when compared with food quality (Starr et al., 2003).
Locally grown produce, eggs, dairy products, and meat are often featured at “buy local” restaurants. Bachmann (2004) discussed four case studies of farms selling food directly to restaurants; all of the represented farms were selling either fruits and vegetables, or meat and eggs. Likewise, most stories on the internet regarding “local food” was about vegetables, herbs, poultry products, meat products, and honey. One food item that is seemingly absent in restaurants is locally-produced fish. This is enigmatic because small-scale fish production (or aquaculture) is prevalent throughout Eastern, Southern, Central, Mountain, and Western United States and Hawaii (USDA, 2013). Thus, one should expect that locally grown fish would be on the menus of restaurants interested in buying local food. To explore this issue further, a marketing study was conducted among restaurants in Kentucky and Ohio to investigate the potential of selling locally grown fish to restaurants. This paper outlines results of that study.
The small-scale fish farms of Kentucky and Ohio, similar to other small-scale farms, cannot compete with the low prices of comparable imported seafood. Hence, these farms rely on sales directly to consumers and in niche markets that pay premium prices. Selling fish to restaurants specializing in local foods, at premium prices, is a scenario in which these farms can become competitive. However, the preface to successful fish marketing to restaurants must be knowledge of species, product form, size, and delivery schedule preferred by chefs (Dasgupta and Durborow, 2009). This paper reports on these parameters of fish marketing for Kentucky and Ohio. Given the prevalence of small-scale fish farms in the United States, this paper should help agricultural extension professionals to better serve and advise their stakeholders.
MATERIALS AND METHODS
As part of a USDA-AMS Federal State Marketing Improvement Program (FSMIP)-funded project, 289 locally-owned restaurants in Kentucky and Ohio were surveyed using Survey Monkey (https://www.surveymonkey.com/). Also, 50 questionnaires were hand delivered to locally-owned restaurants in the Cincinnati area along with self-addressed, stamped envelopes. The link to the electronic survey was also included in the Ohio Restaurant Association's "News Bites” e-publication. The questions (Table 1) focused on their willingness to buy fish that are typically produced in Kentucky and Ohio, such as channel catfish, tilapia, largemouth bass, bluegill, hybrid striped bass, paddlefish, yellow perch, and rainbow trout. Restaurants were asked about the types of freshwater fish that they currently were serving, their willingness to pay for locally-grown fish, and their preferred delivery schedules. They were also asked about importance of seafood attributes such as freshness, taste, product form (whole on ice, live, fillets, etc.), size of fish, and product origin. Finally, restaurants were asked to rank preferred fish species by eliciting their top three choices for fish.
Table 1. Example questions from the survey of independent restaurants in Kentucky and Ohio. "Product form" refers to whether the fish will be alive, whole-gutted, steaked, or filleted.
|
Questions: |
Potential responses |
|
Does your restaurant currently serve freshwater fish? |
Yes/No |
|
Please rate the importance of the following attributes of fish: 1) freshness, 2) locally grown, 3) product form, 4) product quality, 5) year-round availability, and 6) price. |
On a scale from “none”, “little”, “moderate”, “great” or “extreme” |
|
What is your preferred delivery frequency of locally-grown fish? |
Options include: “weekly”, “twice monthly”, “monthly”, every other month”, “seasonally”, or “I will not buy fish” |
|
How many pounds of fish would you like per delivery? |
“pounds of whole fish” and “pounds of processed fish" |
|
Of the list of locally-grown fish from Kentucky and Ohio, which are your number 1, number 2, and number 3 choices, in decreasing order of preference? |
|
|
For your number 1 choice fish, what is your preferred product form? Also for numbers 2 and 3. |
Live, whole-gutted, steaks, or fillets |
|
For your number 1 choice fish, what is your preferred product size for: a) whole fish and/or b) fillets? Also for numbers 2 and 3. |
Pounds and ounces |
|
For your number 1 choice fish, what is the maximum price that you will pay for: a) whole fish and/or b) fillets? Also for numbers 2 and 3. |
$ per pound |
|
What is the best classification of the socio-economic status of most of your customers? |
Options include: “wealthy”, “upper middle class”, “middle class”, “blue collar”, “Other” |
|
What is the total number of seats in your restaurant? |
|
Results and Discussion
Marketing Results
A total of 52 restaurants (39 from Kentucky and 13 from Ohio) completed the survey questionnaire. Twenty-seven restaurants currently served various freshwater fish including tilapia, catfish, and hybrid striped bass, as illustrated in Figure 1.
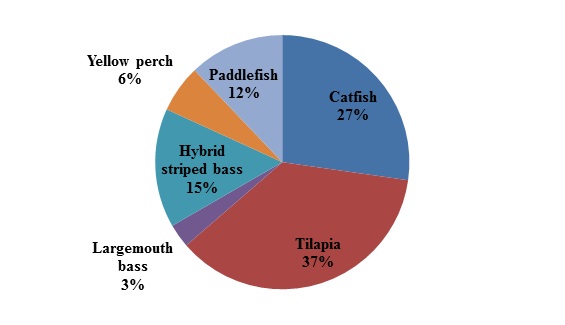
Figure 1. Types of fish currently served in independent restaurants surveyed in Kentucky and Ohio.
The surveyed restaurants indicated that they wanted the following types of locally-grown fish (Figure 2): rainbow trout (42 restaurants), hybrid striped bass (31), yellow perch (25), catfish (19), largemouth bass (19), paddlefish (13), and bluegill (9).
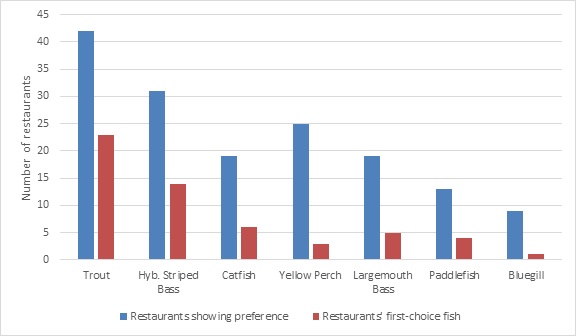
Figure 2. Total number of restaurants showing preference for locally-grown fishes and the number of restaurants that considered some fishes to be their first choice of seafood.
The respondents stated that the fish attributes that were “important” were product quality, consistent supply, and taste. When questioned about preferred fish delivery schedules, the restaurants provided a range of schedules that were summarized in Figure 3. Clearly, weekly deliveries of fish was the most preferred schedule.
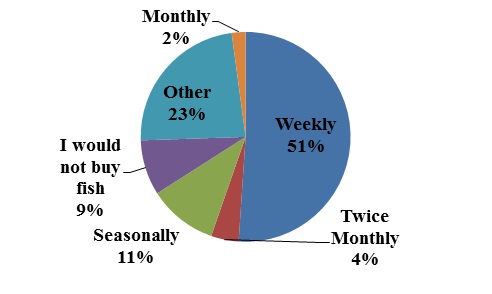
Figure 3. Fish delivery preferences for independent restaurants surveyed in Kentucky and Ohio.
The survey asked restaurants to report their expected order sizes. Only 12 restaurants provided useful data which were illustrated in Figure 4. Interestingly, fish fillets and whole fish were ordered by six of the 12 responding restaurants. The quantities of 10 pounds and 20 pounds were the most popular order sizes and weekly ordering was the most popular order frequencies.
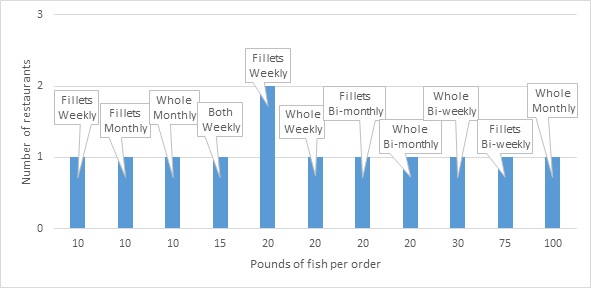
Figure 4. Expected order size, number of restaurants, form of fish (fillets, whole fish, or both), and frequency of orders.
Rainbow trout was the choice fish of 42 restaurants and the first-choice fish for 23 restaurants. Of the restaurants that chose trout, 17 indicated a willingness to buy a whole fish, with the preferred size of 1.5 pound fish or smaller. All 42 restaurants wanted to buy trout fillets that were from 5 to 9 ounces (i.e., one-third to one-half pound). Figure 5 shows the average willingness to pay for whole trout to be $4.89 per pound and trout fillets to be $8.91 per pound.
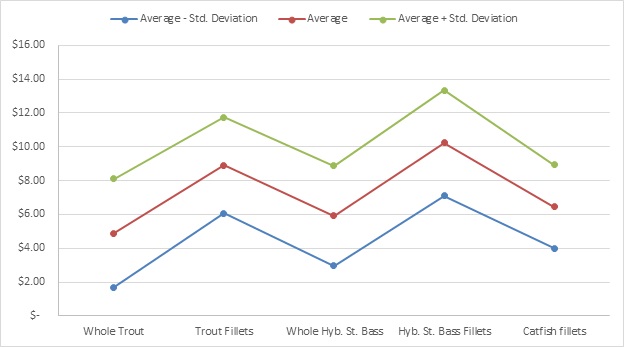
Figure 5. Average willingness to pay (± standard deviation) for trout, hybrid striped bass, and catfish.
Hybrid striped bass was a choice fish for 31 restaurants and the first-choice fish of 14 restaurants. Of the restaurants that liked this fish, nine indicated that they preferred a whole fish of size greater than 3 pounds. All 31 restaurants wanting hybrid striped bass were willing to buy fillets of a sizes between 5 and 9 ounces. The average willingness to pay for whole hybrid striped bass was $5.91 per pound. Of the restaurants wanting to purchase hybrid striped bass fillets, the average willingness to pay was $10.22 per pound (Figure 5).
Nineteen restaurants wanted catfish; however, catfish was the first-choice fish for only 2 of those restaurants. Whole catfish was unpopular: only 2 of the 19 restaurants wanted this product form; however, all 19 restaurants wanted catfish fillets. The preferred fillet size was from 5 to 9 ounces, and the average willingness to pay was $6.46 per pound for fresh fillets (Figure 5).
Restaurants’ clientele did not seem to influence their choice of fish. For example, of the 26 restaurants that reported having upper middle-class clientele, 9 restaurants wanted trout, 6 wanted hybrid striped bass, and 2 wanted catfish. Of the 15 restaurants that reported having middle-class clientele, 9 wanted trout, 3 wanted hybrid striped bass, and 1 wanted catfish. Of the 9 restaurants that reported mixed-class clientele, 4 wanted trout, 3 wanted hybrid striped bass, and 1 wanted catfish. However, two restaurants that reported catering to college students exclusively chose catfish as their first choice of fish.
Profitability of Selling Fish to Restaurants
No marketing discussion is complete without addressing the issue of whether the markets are profitable. Profitability can be measured by comparing the restaurants’ willingness to pay with the cost of fish production, filleting, and transportation (Table 2). Existing literature outlines the expected costs of fish production for trout, bass, and catfish, while Caporelli and Lazur (2014) estimated the cost of small-scale fish filleting. Transportation costs are highly variable and were not included in this discussion; however, as a guide to farmers, since light transportation was needed to move 100 pounds of fish or less from local producers to restaurants, the cost of road transportation could be assumed to be $0.58 per mile which the IRS (2018) used as the cost of using a car, van, or pickup truck for business purposes.
Table 2. Restaurants’ average willingness to pay (WTP) and predicted product costs. Product cost is derived from two components: fish production and processing cost. Fish production costs are obtained from San et al. (2001) for trout, Dasgupta and Thompson (2014) for hybrid striped bass, and Engle and Stone (2014) for catfish. Caporelli and Lazur (2014) outline fish processing cost to be approximately $0.71 per pound and the cost of catfish fillets to be approximately $3 per pound.
|
Product |
Average WTP, $/lb |
Predicted product cost, $/lb |
|
Whole trout |
$4.89 |
$2.94 |
|
Trout fillets |
$8.91 |
$8.06 |
|
Whole hybrid striped bass |
$5.91 |
$4 to $5 |
|
Hybrid striped bass fillets |
$10.22 |
$14 to $17 |
|
Catfish fillets |
$6.46 |
$3 |
Trout production is dependent on having adequate supplies of cool freshwater. San et al. (2001) reported the cost of trout production at a small scale. For a 2,500 pounds per year production scale, they suggested that use of polyethylene tanks and a water flowrate of 60 gallons per minute would be adequate. Higher levels of production will require substantial investment in the construction of cement raceways and water flow rates exceeding 100 gallons per minute. For a small-scale trout production scenario, San et al. (2001) calculated the expected breakeven price to be near $1.12 per pound in 2001 U. S. dollars. However, due to currency inflation since 2001, and the higher cost of fingerling trout and feed, the corresponding cost of small-scale trout production was estimated at $2.94 per pound in 2016 U. S. dollars. Since the restaurants’ average willingness to pay for whole trout was $4.89 per pound, sales this product could be profitable for small-scale producers.
Rodrigues de Souza et al. (2015) outlined the dress-out yield of rainbow trout fillets to be approximately 40% of total body weight. Using Caporelli and Lazur’s (2014) estimation of filleting cost, at a small-scale, to be $0.71 per pound of fillet weight, the cost of trout fillet production was estimated at $8.06 per pound, assuming that the producer and processor were vertically integrated, which is the case for a number of fish farms in Kentucky and Ohio. Since this estimated production cost was close to the average willingness to pay for trout fillets ($8.91 per pound), trout fillet sales to restaurants are likely to be unprofitable for small-scale operations.
Dasgupta and Thompson (2013) reported the costs of hybrid striped bass production. Their results showed that the breakeven price would vary from $4 to $5 per pound for the whole fish. The average willingness to pay for whole hybrid striped bass was $5.91 per pound, which is close to the production cost. Thus, it is difficult to conclude whether sales of whole hybrid striped bass to restaurants will be profitable for small-scale farms.
Using the fish processing premium of Caporelli and Lazur (2014), hybrid striped bass fillets would cost $14 to $17 per pound to produce, assuming a 30% dress out for the fillets. Given that restaurants will pay only $10.22 per pound, on average, for hybrid striped bass fillets, sales of this hybrid striped bass fillets to restaurants would not be profitable.
Engle and Stone (2014) used farm-level data to arrive at a $1.32 per pound production cost for catfish in small-scale farms. Caporelli and Lazur (2014) reported the cost of catfish fillets to be approximately $3 per pound. Since restaurants’ average willingness to pay for fresh catfish fillets was $6.46 per pound, sales of catfish fillets to local restaurants can be profitable.
EXTENSION IMPLICATIONS AND CONCLUSIONS
Interest in purchasing locally-grown food is expanding in the United States and this interest has also pervaded American restaurants (Bukenya, et al., 2007; Curtis & Cowee, 2009; Starr et al., 2003). The United States Department of Agriculture reported widespread production of fish across the nation, albeit at a small scale (USDA, 2013). Fish farmers should consider selling fish in local food markets such as independent restaurants.
There are several results in this paper that should be important to county agricultural agents. For Kentucky and Ohio, this paper shows that independent restaurants prefer rainbow trout, hybrid striped bass, and channel catfish over other types of locally grown fish. These preferences could differ in other parts of the country, and agricultural extension professionals should cooperate with agricultural researchers to discover the fish marketing parameters for their region. Farmers should focus on high quality products because the surveyed restaurants preferred food quality over its price, which validated earlier results that restaurants consider taste and freshness of food to be of primary importance.
Another result that should get the attention of county agricultural agents is that some restaurants would buy whole (i.e., unprocessed) fish from farmers. Whole fish requires minimal handling unlike processed fish which must be done at Hazard Analysis at Critical Control Points or HACCP-certified fish processing facilities. Since building processing facilities could be cost prohibitive for small-scale farmers, this paper indicates that there is a possibility of selling unprocessed fish to restaurants. For Kentucky and Ohio restaurants, the preferred whole fishes were trout that were 1.5 pounds or smaller and whole hybrid striped bass that were at least 3 pounds. The willingness to pay for whole trout or hybrid striped bass ranged from $4 to $6 per pound. Whole catfish was not popular.
Since fish fillets are convenient to prepare and for consumers to eat, many restaurants chose fresh fillets to be their preferred product form. Our results show that trout and hybrid striped bass fillets were too expensive to produce and could be unprofitable if sold to restaurants. However, fresh catfish fillets would be profitable for restaurant sales. If farmers want to sell fresh fillets to restaurants, having access to HACCP-certified fish processing facilities is crucial. Kentucky has a mobile fish processing trailer, which can be rented by fish farmers (Extension.org, 2013). In other states, farmers might be able to rent HACCP-certified processing facilities that have an existing HACCP plan for fish filleting operations.
Therefore, the recommendations to fish producers in Kentucky and Ohio would be to target the production of trout and catfish as the fish species that are suitable for sales to restaurants. Since trout production is dependent upon large supplies of cold, clean water, it would be more suitable for farmers in the eastern regions of the two states. Catfish farmers could profit from the sale of fresh fillets to restaurants, although it would require the additional labor and expense of fish processing.
REFERENCES
Bachmann, J. (2004). Selling to restaurants. Business and marketing. National Sustainable Agriculture Information Service, retrieved from: https://attra.ncat.org/attra-pub/summaries/summary.php?pub=266
Bukenya, J. O., Mukiibi, M. L., Molnar, J. J., & Siaway, A. T. (2007). Consumer purchasing behaviors and attitudes toward shopping at public markets. Journal of Food Distribution Research 38(2):12.
Curtis, K. R., & Cowee, M. W. (2009). Direct marketing local food to chefs: chef preferences and perceived obstacles. Journal of Food Distribution Research, 40(2):26-36.
Caporelli, A. & Lazur, A. M. (2014). Small scale, on-farm fish processing. Southern Regional Aquaculture Center, Publication number 442, retrieved from: https://srac.tamu.edu/viewCategory/23.
Dasgupta, S., & Thompson, K. R. (2013). Comparison of costs of different hybrid striped bass production system in ponds. Southern Regional Aquaculture Center, Publication number 3000, retrieved from: https://srac.tamu.edu/viewCategory/12.
Dasgupta, S., & Durborow, R. M. (2009). Small-scale marketing of aquaculture products. Southern Regional Aquaculture Center, Publication number 350, retrieved from https://srac.tamu.edu/viewCategory/14.
Engle, C. R. & Stone, N. (2014). Costs of small-scale catfish production for direct sales. Southern Regional Aquaculture Center, Publication Number 1800, retrieved from: https://srac.tamu.edu/viewCategory/3.
Extension.org. (2013). Kentucky mobile poultry processing unit. Retrieved from http://articles.extension.org/pages/16092/kentucky-mobile-poultry-processing-unit.
Internal Revenue Service (2018). IRS issues standard mileage rates for 2019. IR-2018-251, retrieved from: https://www.irs.gov/newsroom/irs-issues-standard-mileage-rates-for-2019.
Rodrigues de Souza, M. L., Macedo-Viegas, E. M., Sampaio Zuanon J. A., Barbieri de Carvalho, M. R., and Souza dos Reis Goes, E. (2015). Processing yield and chemical composition of rainbow trout (Oncorhynchus mykiss) with regard to body weight. Acta Scientiarum. Animal Sciences, 37(2):103-108.
San, N. N., Miller, D., D’Souza, G., & Semmens, K. (2001). West Virginia trout enterprise budgets. Publication #AQO1-I, West Virginia University, Morgantown, WV.
Starr, A., Card, A., Benepe, C., Auld, G., Lamm, D., Smith, K., & Wilken, K. (2003). Sustaining local agriculture barriers and opportunities to direct marketing between farms and restaurants in Colorado. Agriculture and Human Values, 20(3):301-321.
USDA (2013). Census of Aquaculture. Available from: https://www.agcensus.usda.gov/Publications/2012/Online_Resources/Aquaculture/aquacen.pdf.