Journal of the NACAA
ISSN 2158-9429
Volume 12, Issue 1 - June, 2019
High-Quality Cereal Rye Silage as a Forage Alternative for Lactating Dairy Cows
- Caputo Oliveira, R., Graduate Research Assistant, Ruminant Nutrition Physiology, UW-Madison
Shaver, R., Department of Dairy Science, University of Wisconsin-Madison
Shelley, K., Nutrient and Pest Management Program, University of Wisconsin-Madison
Binversie, L., Division of Extension, University of Wisconsin-Madison
Johnson, H., Division of Extension, University of Wisconsin-Madison
Akins, M., Department of Dairy Science and Division of Extension, University of Wisconsin-Madison
ABSTRACT
Including three ryelage qualities (high, average, low) in lactating dairy cow diets with varying proportions of alfalfa and corn silage was evaluated for impact on predicted milk yield and income over feed cost using diet simulations. Original diets were provided by two farms in Wisconsin and nutrient analysis of 13 ryelage samples collected from 5 dairy farms were used in simulations. Seven diets for each farm and category of ryleage were simulated. The replacement of alfalfa silage with high quality ryelage, but not the low or average quality ryelage, maintained or increased predicted milk yield and income over feed cost.
INTRODUCTION
Using cover crops as a forage source is becoming an increasingly popular practice among farmers. However, one of the biggest obstables to convincing farmers to adopt the practice is the limited research on how to best incorporate the forage into the ration. Nutritionists do not like working with the unknown and neither do farmers, especially with depressed milk prices and not knowing the risk it could pose to milk production.
Therefore, the objective of this study was to determine the impact of inclusion of three qualities of ryelage (cereal rye silage) harvested from winter cover crop in lactating dairy cow diets with varying proportions of alfalfa and corn silage on predicted milk yield and income over feed cost through diet simulations using the Agricultural Modeling and Training Systems LLC (AMTS) software.
METHODS
Farms' original lactation diets
Original lactation diets provided by two dairy farms, M and S, contained corn and alfalfa silages and ryelage. Ingredient and chemical composition of the original diets are presented in Table 1.
Table 1. Ingredient and chemical composition of lactation diets at dairy farm M in October of 2018 and dairy farm S in August of 2018 which were the rations used at each dairy for the simulations. Protein mix contained additives, minerals, and vitamins. Neutral detergent fiber was corrected for starch and ash residues. DM=dry matter. NEL=net energy for lactation.
|
Dairy farm M |
Dairy farm S |
|
|
Ingredient offered |
% of diet DM |
% of diet DM |
|
Corn silage |
21.56 |
22.42 |
|
Alfalfa silage |
21.38 |
8.14 |
|
Ryelage |
16.89 |
7.77 |
|
Corn grain ground fine |
-- |
14.24 |
|
High moisture corn |
22.05 |
13.16 |
|
Protein mix |
-- |
10.28 |
|
Cottonseed |
-- |
8.85 |
|
Barley malt sprouts |
-- |
5.81 |
|
Canola meal |
-- |
4.56 |
|
Soybean meal extruded |
6.16 |
-- |
|
Soybean meal |
2.05 |
3.15 |
|
Soybean whole extruded |
2.01 |
-- |
|
Corn distillers |
1.98 |
-- |
|
Hay |
-- |
1.63 |
|
Blood meal |
1.53 |
-- |
|
Palmitic acid |
1.19 |
-- |
|
Calcium carbonate |
1.10 |
-- |
|
Sodium bicarbonate |
0.59 |
-- |
|
Calcium phosphate Di (Dical) |
0.59 |
-- |
|
Salt white |
0.52 |
-- |
|
Magnesium ox |
0.16 |
-- |
|
Premix with chelates |
0.14 |
-- |
|
Premix Dairy |
0.05 |
-- |
|
Methionine |
0.04 |
-- |
|
Chemical composition |
|
|
|
Crude protein (CP) |
16.53 |
16.68 |
|
Neutral detergent fiber (NDF) |
29.94 |
32.71 |
|
Ether extract (EE) |
5.87 |
3.46 |
|
Sugar |
4.15 |
4.05 |
|
Starch |
25.68 |
29.36 |
|
Soluble fiber |
6.05 |
5.65 |
|
Non-fiber carbohydrates |
39.22 |
41.45 |
|
NEL, Mcal/lb of diet DM |
0.78 |
0.73 |
Except for forages, all diets were formulated using nutrient composition of ingredients from the AMTS library (version 4.10.5). Forage nutrient composition was analyzed at Cumberland Valley Laboratories (CVAS; Waynesboro, PA) and Dairyland Laboratories (DLL; Arcadia, WI) for dairy farms M and S, respectively (Table 2). The laboratory determined neutral detergent fiber digestibility (NDFD) after 30-h incubation (Goering and Van Soest, 1970). Neutral detergent fiber (NDF) and crude protein (CP) values were similar to analyses conducted at the University of Wisconsin-Madison Agricultural Research Station in Arlington (Brinkman et al., 1990).
Table 2. Chemical composition of alfalfa and corn silages at dairy farm M in October of 2018 and dairy farm S in August of 2018, and high, average, and low quality ryelage. aNDFom=Neutral detergent fiber corrected for ash and starch contamination. uNDF=undigestible neutral detergent fiber at 240 hours post incubation. NDF kd=rate of digestion of neutral detergent fiber. NFC=non-fiber carbohydrate, calculated using the equation: NFC=1–(CP+NDF+EE+Ash). NEL 3x=dietary net energy for lactation at 3x maintenance.
|
Dairy M forages |
Dairy S forages |
Ryelage |
||||||
|
|
Units |
Alfalfa |
Corn |
Alfalfa |
Corn |
High |
Average |
Low |
|
Dry matter (DM) |
% of as fed |
33.0 |
32.0 |
33.0 |
32.0 |
33.1 |
33.1 |
33.1 |
|
aNDFom |
% of DM |
36.6 |
39.5 |
35.3 |
39.4 |
52.0 |
58.7 |
65.4 |
|
Lignin |
% of NDF |
18.9 |
7.7 |
21.8 |
7.8 |
4.6 |
7.0 |
9.5 |
|
uNDF |
% of NDF |
51.4 |
31.2 |
42.4 |
29.9 |
18.4 |
23.4 |
27.3 |
|
NDF kd |
%/h |
4.3 |
3.4 |
6.3 |
4.4 |
4.9 |
4.2 |
3.6 |
|
NDFD 30h |
%/NDF |
44.3 |
54.7 |
46.6 |
56.9 |
70.4 |
62.7 |
54.9 |
|
NFC |
% of DM |
27.5 |
46.9 |
25.8 |
45.1 |
16.9 |
12.2 |
7.4 |
|
Sugar |
% of DM |
4.7 |
1.2 |
3.7 |
0.9 |
11.6 |
5.9 |
0.2 |
|
Starch |
% of DM |
1.5 |
38.3 |
1.7 |
36.3 |
0.1 |
0.1 |
0.1 |
|
Soluble Fiber |
% of DM |
12.2 |
4.6 |
16.3 |
0.9 |
-- |
-- |
-- |
|
Acetic |
% of DM |
2.6 |
1.1 |
1.0 |
1.9 |
-- |
-- |
-- |
|
Propionic |
% of DM |
0.0 |
0.0 |
0.3 |
0.5 |
-- |
-- |
-- |
|
Butyric |
% of DM |
0.5 |
0.0 |
0.0 |
0.0 |
-- |
-- |
-- |
|
Lactic |
% of DM |
5.4 |
1.2 |
2.8 |
4.6 |
-- |
-- |
-- |
|
Crude protein (CP) |
% of DM |
21.9 |
7.3 |
22.6 |
6.5 |
17.5 |
13.6 |
9.6 |
|
Soluble protein |
% of CP |
64.7 |
27.6 |
60.2 |
67.8 |
58.6 |
67.3 |
76.0 |
|
Ash |
% of DM |
10.4 |
3.6 |
12.8 |
5.4 |
8.6 |
11.3 |
14.0 |
|
Ether extract (EE) |
% of DM |
3.7 |
2.7 |
3.6 |
3.6 |
4.9 |
4.3 |
3.5 |
|
NEL 3x |
Mcal/lb |
0.64 |
0.75 |
0.63 |
0.72 |
0.64 |
0.57 |
0.51 |
|
Relative feed value (RFV) |
-- |
154 |
-- |
151 |
-- |
103 |
87 |
72 |
|
Relative feed quality (RFQ) |
-- |
160 |
-- |
154 |
-- |
145 |
112 |
80 |
|
Milk per ton |
lb/ton of DM |
2933 |
3340 |
2801 |
3402 |
3071 |
2564 |
2056 |
Ryelage Sample Collection, Analysis and Categories
Ryelage samples (n = 13) were collected by our team at 5 dairy farms from July to October 2018 and sent to DLL for nutrient analyses. Three categories of ryelage (Low, Average, and High quality) were created using the average and standard deviation calculated from each nutrient for the ryelage samples collected (Table 2). The nutrient composition of the average quality ryelage was determined as the average content of each nutrient. For the high quality ryelage, nutrient composition was calculated as the average of each of the following nutrients: crude protein (CP), sugar, starch, ether extract (EE), neutral detergent fiber digestibility after 30-h incubation (NDFD), rate of digestion of neutral detergent fiber, net energy for lactation at 3x maintenance (NEL 3x), relative feed value (RFV), relative feed quality (RFQ) and milk per ton plus 2 times their standard deviation; and the average of each of the following nutrients: neutral detergent fiber (NDF), ash, and lignin minus 2 times their standard deviation. For the low quality ryelage, nutrient composition was calculated as the average of each of the following nutrients: CP, sugar, starch, EE, NDFD, rate of digestion of neutral detergent fiber, NEl 3x, RFV, RFQ, and milk per ton minus 2 times their standard deviation; and the average of each of the following nutrients: NDF, ash, and lignin plus 2 times their standard deviation.
Simulated diets, software inputs and outputs
Seven diets for each farm and for each category of ryelage were simulated through AMTS Dairy Software (version 4.10.5) by replacing (dry matter [DM] basis) all ryelage in the original diet (diet 1) with alfalfa silage (diet 2) or with corn silage (diet 3), and by replacing all ryelage with half alfalfa and half corn silage (diet 4). Similarly, all alfalfa silage in the original diet dry matter was replaced with ryelage (diet 5) or with corn silage (diet 6), and all alfalfa silage was replaced with half ryelage and half corn silage (diet 7). Metabolizable energy (ME) and protein (MP) allowable milk, and dietary net energy of lactation were predicted by the AMTS software using the simulated diets and the following inputs provided by the farms:
- for S, the inputs were 3rd lactation Holstein cow, 1400 lb body weight (BW), 170 days in milk (DIM), 55.3 lb/day dry matter intake (DMI), 82.6 lb/day milk yield, 3.62% milk fat, 3.04% milk true protein, 4.78% milk lactose, and 0.130 lb/day average daily gain (ADG);
- for M, the inputs were 3rd lactation Holstein cow, 1400 lb BW, 170 DIM, 55.6 lb/d DMI, 93 lb/d milk yield, 3.95% milk fat, 3.10% milk true protein, 4.78% milk lactose, and 0.130 lb/d ADG.
Predicted income over feed cost (IOFC) was calculated by subtracting daily feed cost per cow from daily revenue per cow. Daily revenue per cow was calculated by multiplying milk price ($0.16/lb of milk) by the average of ME and MP allowable milks. Cost of production for corn silage, alfalfa silage, and ryelage were assumed to be $69.5, $104.7, and $128.4 per ton of DM, respectively. Cooperating farmers reported most of the rye forage was harvested at boot stage. However, no information about field operations or yield of rye forage per acre was collected for use in the simulations in this study. Thus, an equal cost of production for low, average, and high quality ryelages was assumed. Forages costs and assumptions are detailed in Table 3. Fertilizer nutrient requirements were estimated (Laboski and Peters, 2012). Field operations costs were estimated using the 2018 Iowa Farm Custom Rate Survey (Plastina and Johanns, 2019).
Table 3. Forage production cost estimates for January 2019. Crops are corn silage after corn silage, alfalfa (4 year average costs), and ryelage after corn silage. TDM=ton dry matter. Seed costs are prices paid for 2018 corn silage hybrids and rye at UW Arlington Research Station. Field operations costs are from 2018 Iowa Farm Custom Rate Survey and Wisconsin Custom Rate Guide, 2017. Fertilizer are from 2019 spring fertilizer prices at once WI retailer and University of Wisconsin guidelines for crop removal. Other costs adapted from Estimated Costs of Crop Production in Iowa 2019 (Plastina, 2019). Interest is 1% per month on pre-harvest inputs and field operations.
|
|
Corn silage |
Alfalfa |
Ryelage |
|
Yield, TDM/acre |
8.8 |
5 |
2 |
|
Seed, $/acre |
121.00 |
17.00 |
20.00 |
|
Planting, $/acre |
23.00 |
4.50 |
18.00 |
|
Fertilizer, $/acre |
|
|
|
|
N ($0.40/lb) |
56.00 |
-- |
-- |
|
P2O5 ($0.54/lb) |
49.00 |
35.00 |
19.00 |
|
K2O ($0.27/lb) |
60.00 |
86.75 |
46.00 |
|
S&B ($0.34/lb) |
4.00 |
11.31 |
2.00 |
|
Lime, $/acre |
-- |
14.00 |
-- |
|
Fertilizer spreading, $/acre |
6.00 |
10.50 |
6.00 |
|
Herbicides, $/acre |
30.00 |
6.25 |
-- |
|
Insecticides, $/acre |
-- |
11.25 |
-- |
|
Spraying, $/acre |
8.00 |
8.00 |
-- |
|
Tillage, $/acre |
-- |
8.50 |
-- |
|
Soil test, $/acre |
1.00 |
1.00 |
1.00 |
|
Interest, $/acre |
28.64 |
17.13 |
10.88 |
|
Harvest, $/acre |
225.009 |
292.50 |
110.00 |
|
Total cost, $/acre |
611.64 |
523.69 |
256.88 |
|
Cost, $/TDM forage |
69.50 |
104.74 |
128.44 |
RESULTS AND DISCUSSION
Differences in IOFC from original lactation diets ($8.35 vs $9.71/cow/day for M and S, respectively) is partially explained by differences in the daily revenue per cow and cost of diets from forages versus concentrates. Cows on dairy farm M generated a daily revenue of $13.91/cow/day while cows on S generated $14.63/cow/day. M spent $1.64/cow/day on forages while S spent $1.03/cow/day, which was explained by a greater use of forages by farm M; dairy farms M and S used 59.8% and 38.3% of total diet DM as forage, respectively (Table 1). Consequently, the daily usage of ingredients other than forages was lower for M vs S, but the total diet costs on ingredients other than forages was not substantially different; $3.92/cow/d and $3.89/cow/day for M and S, respectively. Briefly, based on the model, cows on S generated more revenue with a lower diet cost compared to M.
High quality ryelage
For M, maintaining the same proportion of corn silage and replacing all the alfalfa silage in the original diet with high quality ryelage (diet 1 and 5, respectively) increased ME and MP allowable milks by 1.78 and 0.15 lb/day, respectively (Figure 1). However, the higher predicted milk yield was diluted by the higher cost of production of ryelage compared to alfalfa silage, thereby not resulting in substantial differences in IOFC between the two diets ($9.08 vs. $9.09/day for diet 1 and 5, respectively).
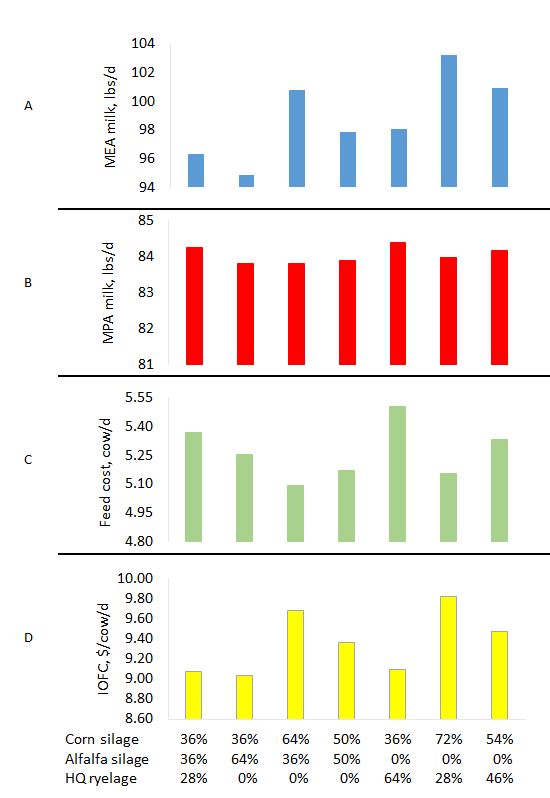
Figure 1. A) Predicted metabolizable energy (MEA), B) predicted protein (MPA) allowable milk, C) net energy for lactation (NEl) content, and D) income over feed cost (IOFC) of lactation diets with different proportions of silages and with high quality (HQ) rye silage at dairy farm M. Total use of silages represents 59.8% of total farm’s base diet DM. Predicted income over feed cost was calculated by multiplying milk price ($0.16/lb of milk) by the average of metabolizable energy and protein allowable milk minus feed cost. Assumed costs of production of corn silage at $69.5, alfalfa silage at $104.7, and ryelage at $128.4 per ton of DM.
For S, maintaining the same proportion of corn silage and replacing all the alfalfa silage in the original diet with high quality ryelage increased ME and reduced MP allowable milks by 1.80 and 0.15 lb/day, respectively (Figure 2). The higher predicted milk yield resulted in an increased IOFC by $0.08/day for diets with all alfalfa silage replaced with high quality ryelage compared to the original diet (Figure 2).
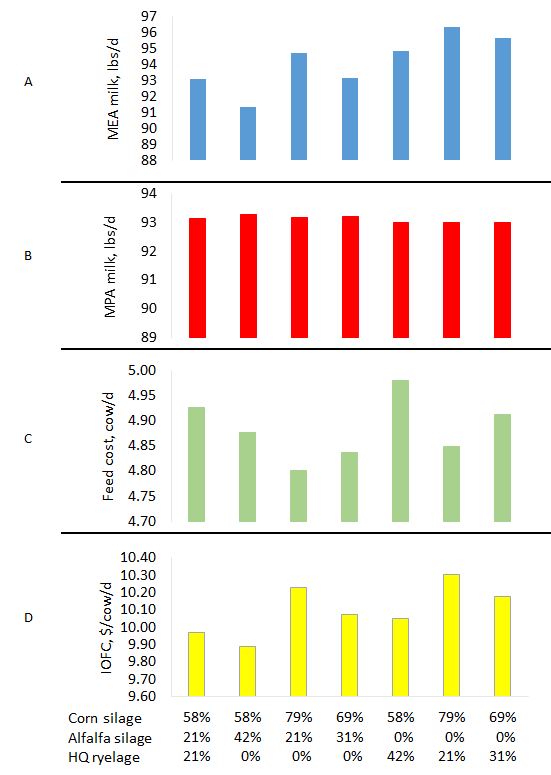
Figure 2. A) Predicted metabolizable energy (MEA), B) predicted protein (MPA) allowable milk, C) net energy for lactation (NEl) content, and D) income over feed cost (IOFC) of lactation diets with different proportions of silages and with high quality (HQ) rye silage at dairy farm S in August of 2018. Total use of silages represents 38.3% of total farm’s base diet DM.
Average quality ryelage
For M, maintaining the same proportion of corn silage and replacing all the alfalfa in the original diet with average quality ryelage reduced ME and MP allowable milks by 2.21 and 4.47 lb/day, respectively (Figure 3). The reduction in predicted milk yield combined with greater feed cost reduced IOFC by $0.68 for diets with all alfalfa silage replaced with average quality ryelage compared to the original diet (Figure 3).
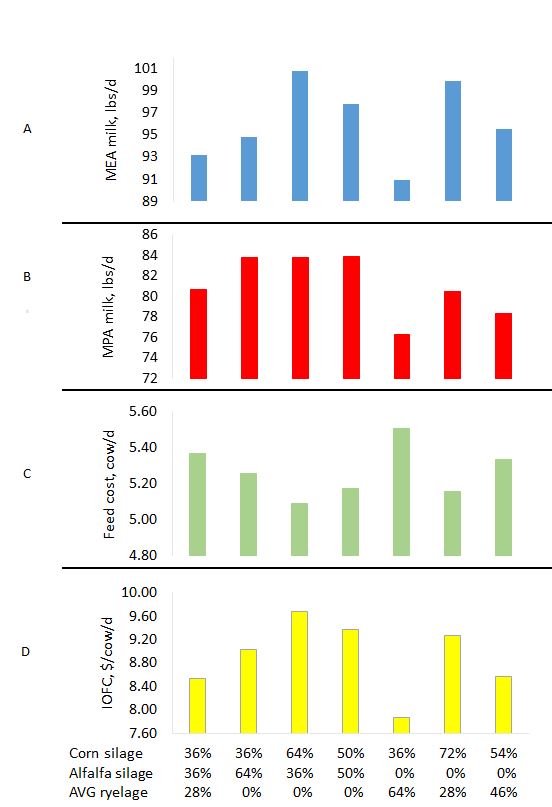
Figure 3. A) Predicted metabolizable energy (MEA), B) predicted protein (MPA) allowable milk, C) net energy for lactation (NEl) content, and D) income over feed cost (IOFC) of lactation diets with different proportions of silages and with average quality (AVG) rye silage at dairy farm M in October of 2018. Total use of silages represents 59.8% of total farm’s base diet DM.
For S, maintaining the same proportion of corn silage and replacing all the alfalfa silage in the original diet with average quality ryelage reduced ME and MP allowable milks in 1.52 and 0.04 lbs/day, respectively (Figure 4). The reduction in predicted milk yield combined with greater feed cost reduced IOFC by $0.18 for diets with all alfalfa silage replaced with average quality ryelage compared to the original diet (Figure 4).
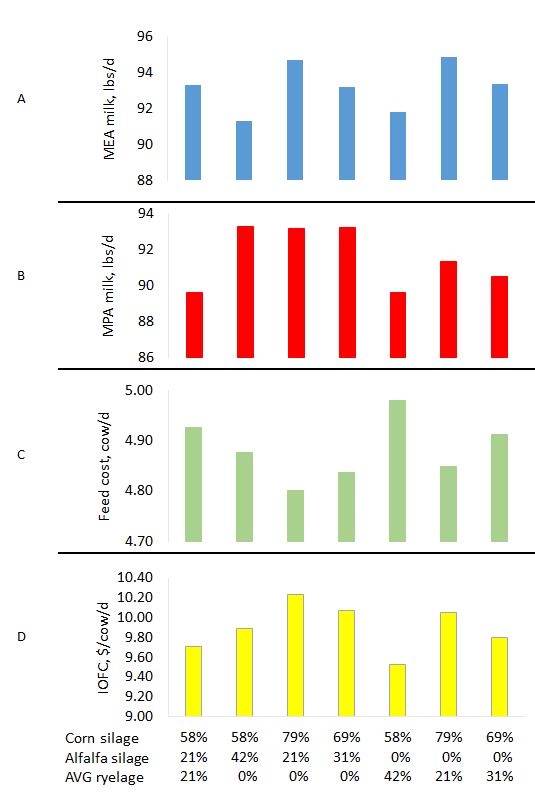
Figure 4. A) Predicted metabolizable energy (MEA), B) predicted protein (MPA) allowable milk, C) net energy for lactation (NEl) content, and D) income over feed cost (IOFC) of lactation diets with different proportions of silages and with average quality (AVG) rye silage at dairy farm S in August of 2018. Total use of silages represents 38.3% of total farm’s base diet DM.
Low quality ryelage
For M, maintaining the same proportion of corn silage and replacing all the alfalfa silage in the original diet with low quality ryelage reduced ME and MP allowable milks by 6.66 and 9.26 lb/day, respectively (Figure 5). The reduction in predicted milk yield combined with a higher feed cost reduced IOFC by $1.41 for diets with all alfalfa silage replaced with low quality ryelage compared to the original diet (Figure 5).
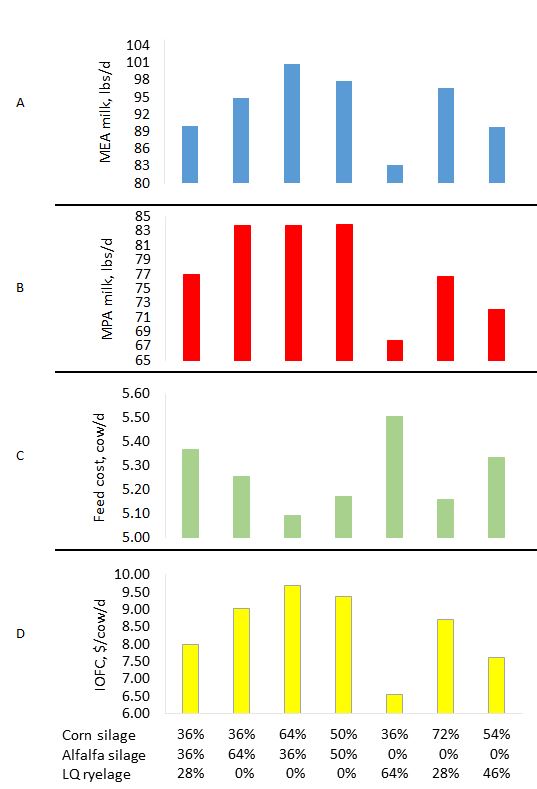
Figure 5. A) Predicted metabolizable energy (MEA), B) predicted protein (MPA) allowable milk, C) net energy for lactation (NEl) content, and D) income over feed cost (IOFC) of lactation diets with different proportions of silages and with low quality (LQ) rye silage at dairy farm M in October of 2018. Total use of silages represents 59.8% of total farm’s base diet DM.
For S, maintaining the same proportion of corn silage and replacing all the alfalfa silage in the original diet with low quality ryelage reduced ME and MP allowable milks by 1.62 and 3.73 lb/day, respectively (Figure 6). The reduction in predicted milk yield combined with greater feed cost reduced IOFC by $0.48 for diets with all alfalfa silage replaced with low quality ryelage compared to the original diet (Figure 6).
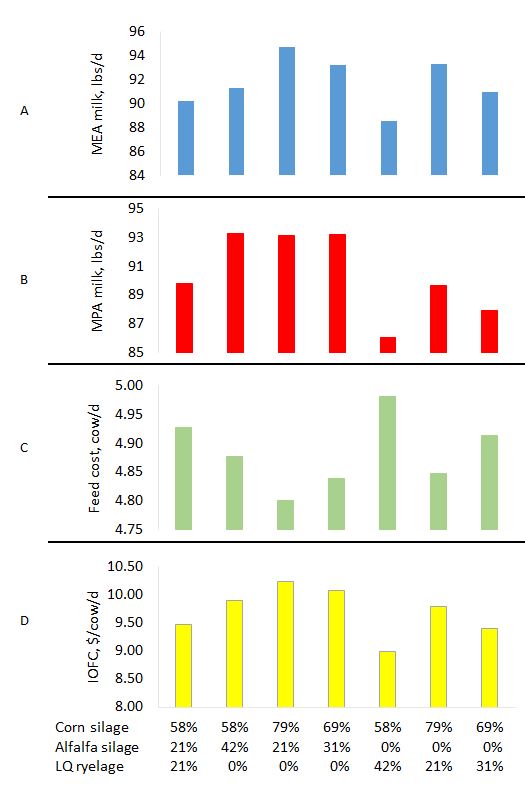
Figure 6. A) Predicted metabolizable energy (MEA), B) predicted protein (MPA) allowable milk, C) net energy for lactation (NEl) content, and D) income over feed cost (IOFC) of lactation diets with different proportions of silages and with low quality (LQ) rye silage at dairy farm S in August of 2018. Total use of silages represents 38.3% of total farm’s base diet DM.
CONCLUSIONS
The impact of replacing alfalfa silage with ryelage depended on the quality and amount of ryelage. The replacement of alfalfa silage with high quality ryelage, but not the low or average quality ryelage, maintained or increased predicted milk yield and IOFC. The original diet from farm M had a greater proportion of forages in the diet DM compared to farm S, so the magnitude of the impact of replacing alfalfa with silage ryelage on predicted milk yield and IOFC was greater for this farm. The study also suggests that increasing the proportion of corn silage replacing alfalfa silage or ryelage was beneficial.
LITERATURE CITED
Goering, H.K. and Van Soest, P.J. (1990). Forage Fiber Analysis (Apparatus, Reagents, Procedures and Some Applications). Agric. Handbook No 379. ARS-USDA, Washington, DC.
Laboski, C.A.M. and Peters, J.B. (2012). Nutrient application guidelines for field, vegetable, and fruit crops in Wisconsin. Retrieved from http://learningstore.uwex.edu/assets/pdfs/A2809.pdf. University of Wisconsin-Madison Division of Extension publication.
LeMahieu, P.J. and Brinkman, M.A. (1990). Double-cropping soybean after harvesting small grains as forage in North Central USA. J. Prod. Agric. 3:385-389.
Plastina, A. (2019). Estimated Costs of Crop Production in Iowa - 2019. Iowa State University publication. Retrieved from https://www.extension.iastate.edu/agdm/crops/pdf/a1-20.pdf.
Plastina, A. and Johanns, A. (2019). 2018 Iowa Farm Custom Rate Survey. Iowa State University Extension publication. Retrieved from https://www.extension.iastate.edu/agdm/crops/pdf/a3-10.pdf.
ACKNOWLEDGEMENTS
This project could not be accomplished without the collaboration and unique cooperation between extension, campus-based specialists and graduate research student, along with field nutritionists and dairy farmers. Funding for forage analysis was supported by the National Institute of Food and Agriculture, U.S. Department of Agriculture, through the North Central Region SARE program. USDA is an equal opportunity employer and service provider. Any opinions, findings, conclusions, or recommendations expressed in this publication are those of the author(s) and do not necessarily reflect the view of the U.S. Department of Agriculture.