Journal of the NACAA
ISSN 2158-9429
Volume 12, Issue 1 - June, 2019
Using Crop Water Demand-Based Irrigation Scheduling to Improve Cabbage Irrigation Management in Georgia
- da Silva, A.L.B.R., Assistant Professor / Extension Specialist, University of Georgia
Krupek, F.S., Research Assistant, University of Georgia
Coolong, T., Associate Professor / Extension Specialist, University of Georgia
Carlson, D. S., County Extension Agent, University of Georgia Cooperative Extension Service Southwest District
Gay, W., County Extension Agent, University of Georgia Cooperative Extension Service Southwest District
Shealey, J., County Extension Agent, University of Georgia Cooperative Extension Service Southwest District
ABSTRACT
In Georgia, cabbage is grown during the spring and fall seasons with the distinct weather conditions of these seasons leading to large differences in crop water demand. The objective of this study was to use the crop water demand method of irrigation scheduling to estimate irrigation management of cabbage for four planting dates in the spring and fall in eight locations in southwest Georgia. Crop water demand was estimated for cabbage transplanted on January 15, February 1 and 15, and March 1 in the spring and August 15, September 1 and 15, and October 1 in the fall. Eighteen years of weather data from eight locations in Georgia were compiled to estimate water demand for cabbage. Crop water demand was the highest for late planting dates in the spring. Conversely, late planting dates in the fall required less water compared to early planting dates to produce a mature crop of fresh cabbage. Cabbage planted on January 15 required 5.0 inches less water than on March 1, while cabbage planted on August 15 required 4.4 inches more water compared to a crop planted on October 1. Overall, the crop water demand method can guide growers to determine irrigation management, but the low water holding capacity of the coarse-textured soils in the Coastal Plain of Georgia should be accounted for in determining the frequency of irrigation events.
Introduction
In Georgia, most cabbage (Brassica oleraceae) is grown using overhead, center-pivot irrigation, although some acreage is produced on plastic mulch with drip irrigation. The use of a strategy for irrigation scheduling is important to ensure crops are receiving water in the “right” amount at the “right” time in order to avoid crop water stresses and maximize yield (Dukes et al., 2010). The crop water demand method of irrigation scheduling is one of six commonly utilized irrigation scheduling methods used in vegetable production (Simmone et al., 2004, da Silva et al., 2019). The crop water demand method is a calendar-based schedule of irrigation events, where the average daily crop evapotranspiration (ETc) of previous day, week, or years are determined to estimate the average volume of water required for a specific crop for each day during crop development. Once the daily average ETc is estimated based on a historic weather data set, the volume of water required by the crop within a week can be split over seven days of the week, or over 2-3 larger irrigation events during the week.
Annually, cabbage is planted in 8,577 acres in Georgia, and was valued at more than $53 million in 2017 (Wolfe and Stubbs, 2018). Cabbage is planted in the spring and fall growing seasons in Georgia. During the spring, cabbage is planted in January/February and harvested in April/May. In the fall growing season, cabbage is planted in August/September and harvested in November/December. The majority of Georgia cabbage production is located in the southwest portion of the state, where growers typically apply water on a time or volume-based schedule (Simmone et al., 2004, da Silva et al., 2019). In this system of irrigation scheduling, water is applied every day for the same period of time or in the same amount and time, regardless of crop growth stage. For example, irrigation may be applied daily for 2 hours to supply ¼ acre-inch of water. This system of irrigation scheduling often avoids crop water deficits because water will be applied daily; however, excessive irrigation may result in waterlogging, nutrient leaching, and increased diseases pressure since weather conditions or crop growth stages are not accounted for (da Silva et al., 2019). Currently, there is a need to provide Georgia cabbage growers with improved recommendations for irrigation scheduling based on the crop water demand. The objective of this study was to use the crop water demand method of irrigation scheduling to estimate the irrigation management of cabbage for different planting dates in the spring and fall Georgia growing seasons.
Materials and Methods
Soil and weather conditions of southwest Georgia
Vegetable production areas in the southwest Georgia are classified as Tifton loamy sand soils with low water holding capacities (USDA, 2017), which require frequent irrigation events to maintain soil water availability for plants to uptake, particularly, for the shallow root zone of cabbage. According to the Koppen climate classification, the region is located in a humid subtropical climate called Cfa, which is characterized by high temperatures with an accumulation of rainfall events during the summer and dry periods during the winter (Koppen, 1931). Historical weather data estimate an average rainfall accumulation of 15.8 inches for cabbage production during the spring season (January to May), and 10.7 inches for the fall season (August to December).
Crop water demand method and data collection
The crop water demand method consists of determining irrigation water demand based on the daily ETc for each stage of crop development. The ETc is calculated by multiplying the daily reference evapotranspiration (ETo) by a crop coefficient (Kc):
ETc = ETo * Kc (Equation 1)
where the daily ETo represents the rate at which readily available soil water evaporates and is transpired from soil covered with a reference crop (Jensen et al., 1990), and the Kc represents the crop coefficient for a particular stage of growth for a given crop (Allen et al., 1998).
The daily ETo was collected for eight locations in southwest Georgia matching regions with significant cabbage production (Fig. 1). For each location, historical ETo data sets from 2000 to 2017 (18 years) were obtained from the Georgia Automated Environmental Monitoring Network (http://www.georgiaweather.net/), which estimates ETo using the Penman-Monteith method (Allen et al., 1998).
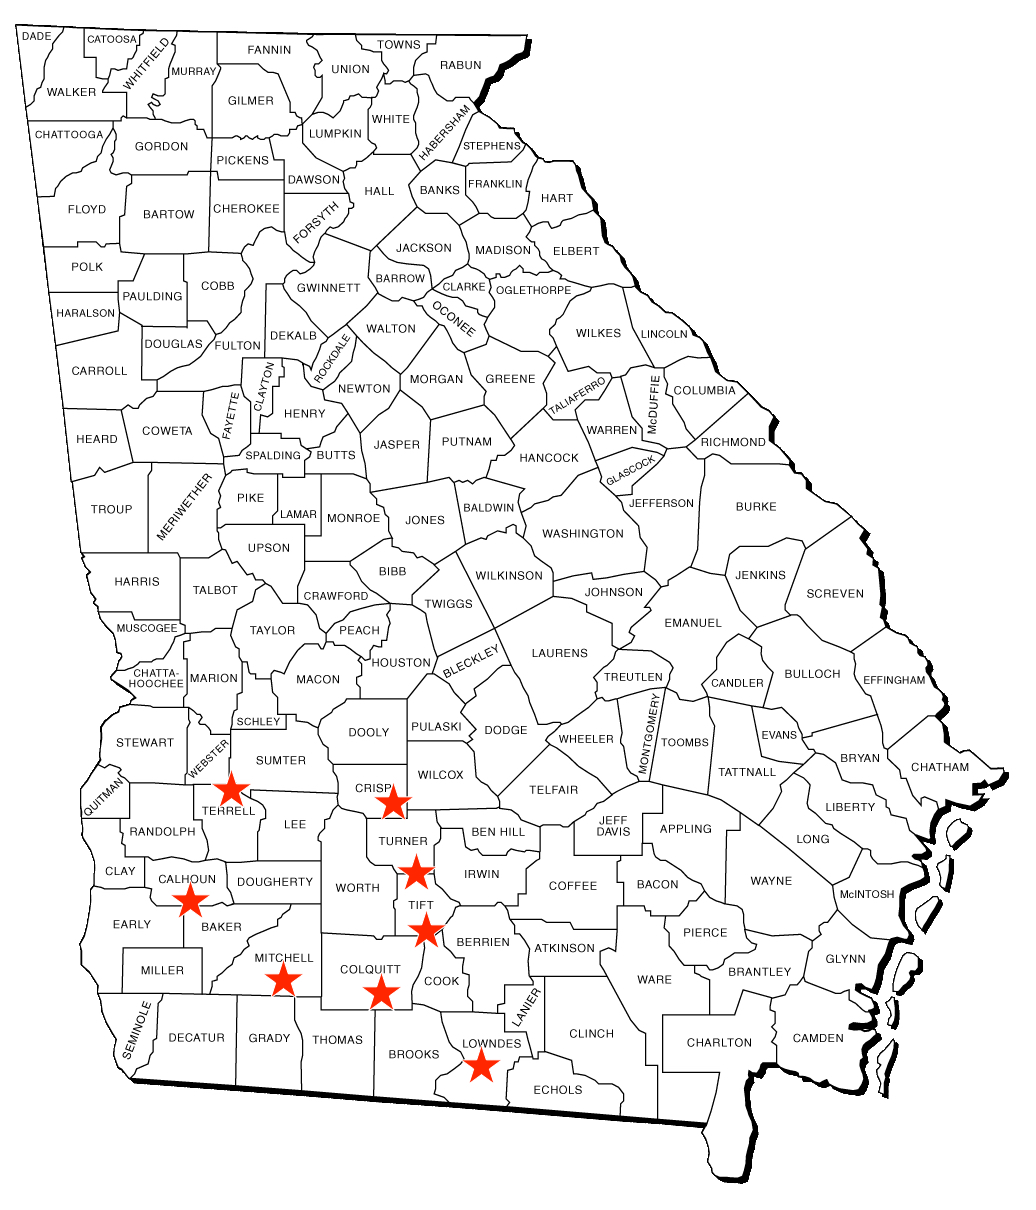
Figure 1. Locations of the weather stations used for data collection in the southwest Georgia.
The cabbage Kc used in the early season (Kcini.), middle season (Kcmid.), and end season (Kcend) were 0.7, 1.05, and 0.95, respectively (Allen et al., 1998). The Kcini. (0.7) was assumed from transplanting to plant establishment (4 weeks after seedling). After establishment (Fig. 2A), cabbage is in a rapid vegetative growth stage, when leaf area expansion occurs (Fig. 2B), and the Kcmid. (1.05) was assumed. This period of high crop water demand can last up to 12 weeks after planting, and proper irrigation scheduling is critical to ensure water deficit is not limiting yield. A week or two prior to harvesting (12 weeks after planting; Fig. 2C), cabbage water demand should be reduced, and the Kcend (0.95) was assumed to calculate the ETc.
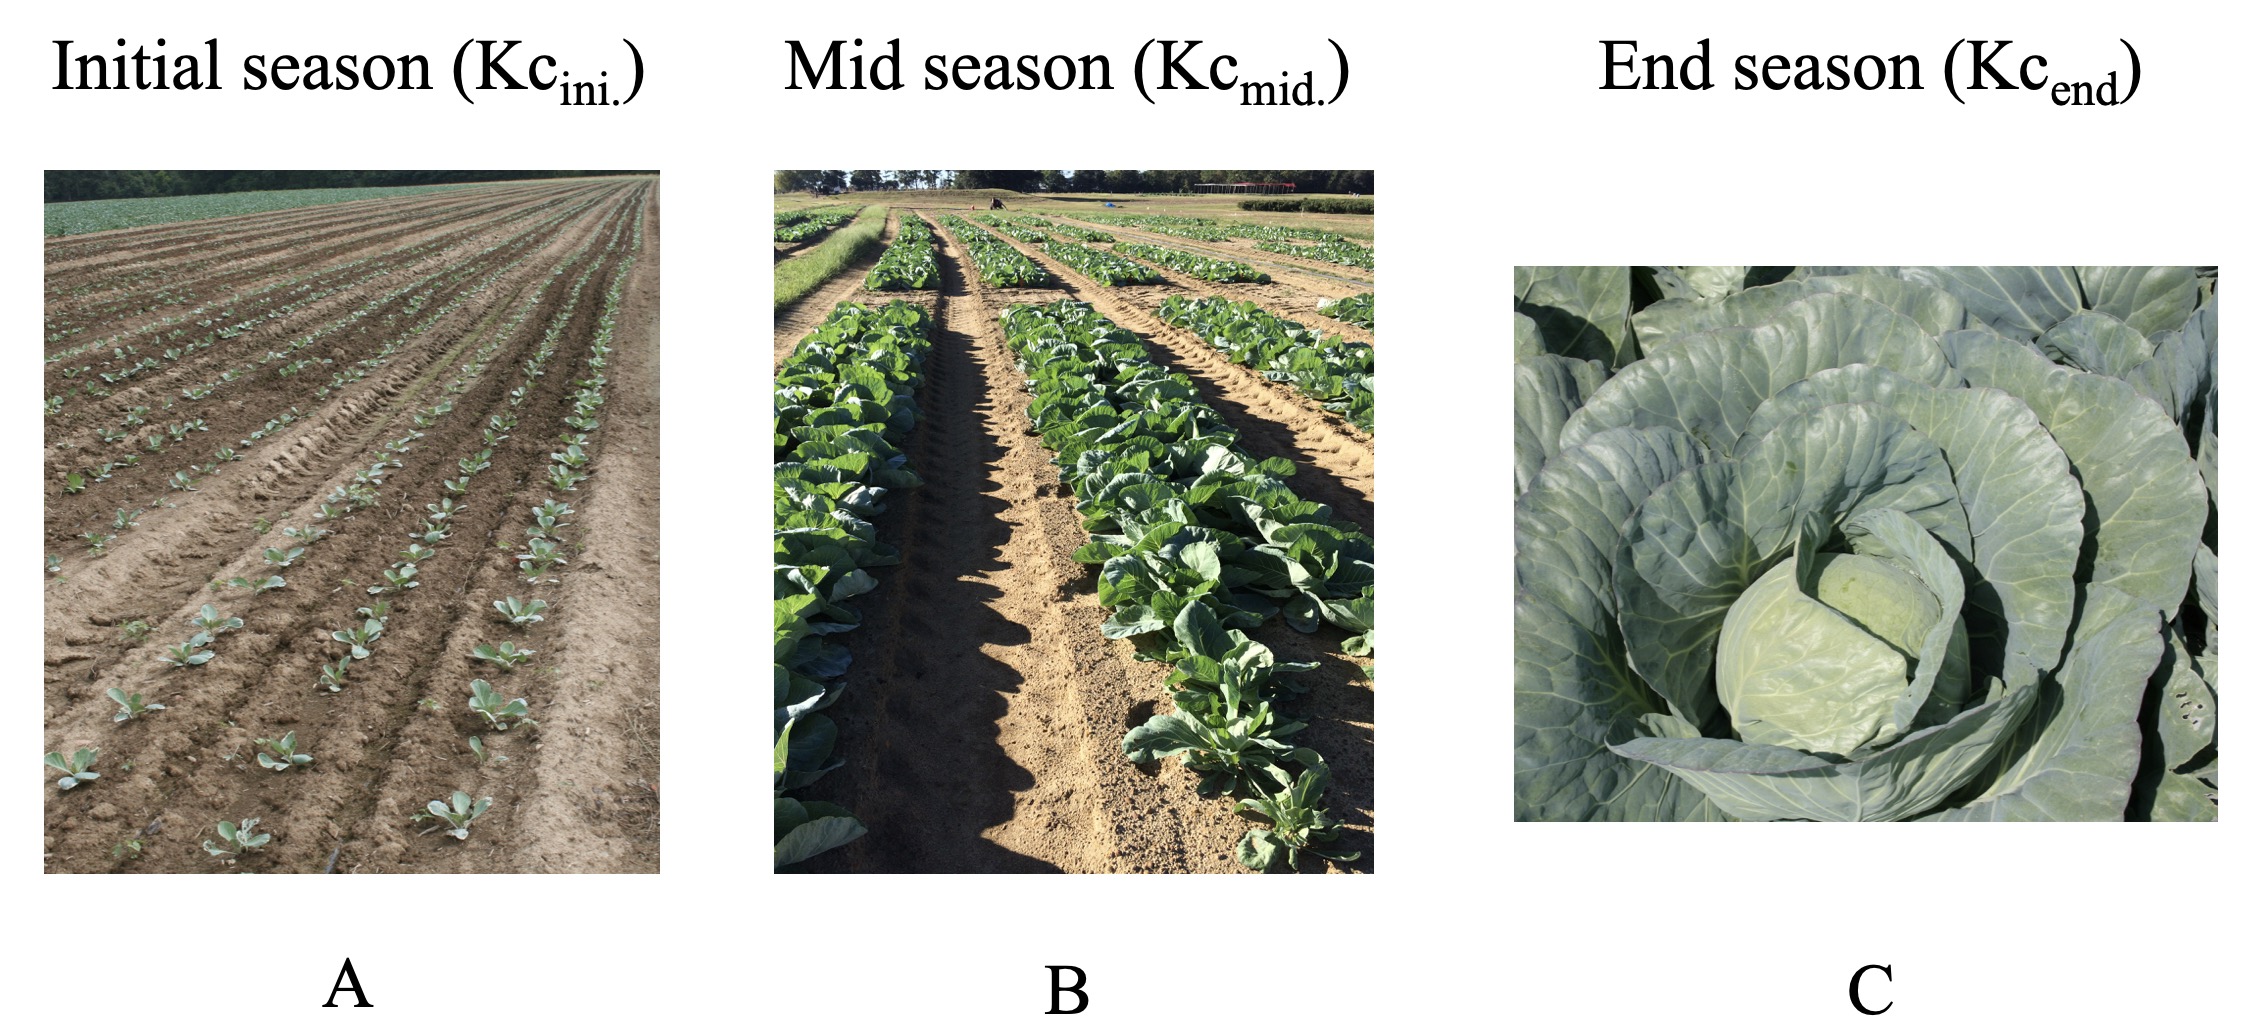
Figure 2. Stages of growth for three crop coefficients (Kc) for cabbage production.
Irrigation scheduling simulation
Four planting dates in each growing season (spring and fall) were used to estimate cabbage water demand for the eight locations in southwest Georgia with18 years of weather data. Planting dates were January 15, February 1 and 15, and March 1 for the spring cabbage season, and August 15, September 1 and 15, and October 1 for the fall cabbage season.
A total of 576 simulations (4 planting dates x 8 locations x 18 years) of daily ETc were performed for each growing season (spring and fall), and weekly irrigation schedules for each cabbage planting date in both growing seasons were determined.
Results and Discussion
During the spring season, cabbage had a gradual increase in water demand throughout crop development. In the initial 4 weeks after transplanting, crop water requirements were low (Fig. 3), and the average estimated ETc using Equation 1 for this period was 0.27, 0.35, 0.47, and 0.59 inches of water per week for the January 15, February 1 and 15, and March 1 planting dates, respectively. Although water requirements were low early in the growing season, daily irrigation events may be required to ensure transplant survival (Smittle et al. 1994). Once the transplant’s root system is established, there is a drastic increase of water demand by cabbage, which is associated with increases in leaf size and transpiration rates per unit of plant material (increases in Kc). During this period, cabbage is more sensitive to water stress than earlier in the growing season (Bruce et al., 1980; Janes, 1950; Nortje and Henrico, 1988: Singh and Alderfer, 1966). Water stress in the mid-season reduces nutrient uptake by plants, particularly, nitrate and ammonium which are the most important source of nitrogen for plants. Consequently, there is a lower biomass accumulation and smaller cabbage heads, which will impact yield (Paranhos et al., 2016). Proper irrigation scheduling during this stage is essential to ensure crop growth and yield (Barrett et al., 2018). Average crop water demand per week from weeks 5 to 10 after planting were 0.69, 0.85, 1.02, and 1.19 inches for planting dates on January 15, February 1 and 15, and March 1, respectively (Fig. 3). Cabbage water demand reduced towards the end of the season (low Kcend) (Fig. 3); however, the Georgia late-spring and early-summer weather conditions, characterized by warm temperatures, still require significant irrigation water to avoid drought stress. Drew (1996) reported that cabbage yield gains can be achieved by applying proper irrigation during the last two weeks of crop development, while early-season irrigation had little effect on yields. Estimated average crop water demand using Equation 1 in the end of the season was 0.93, 1.09, 1.21, and 1.31 inches per week for planting dates on January 15, February 1 and 15, and March 1, respectively.
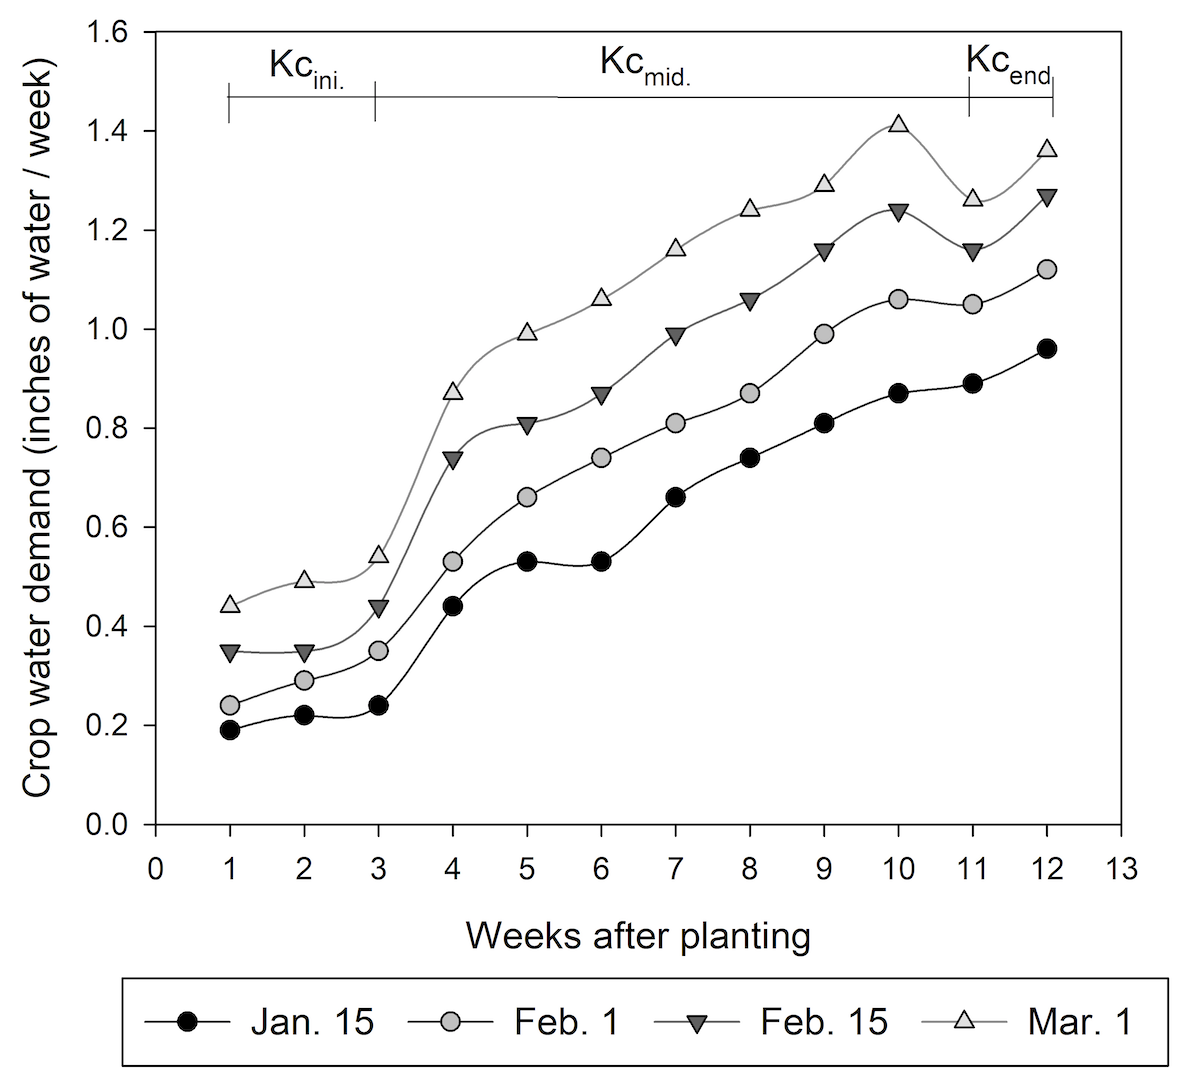
Figure 3. Irrigation water demand per week of cabbage for four planting dates (Jan. 15, Feb. 1 and 15, and March 1) during the spring season in southwest Georgia (gallons of water/acre/week = inches of water/week * 27,154). Average water requirements were calculated from a combination of 18 years of weather data (from 2000 to 2017) and 8 locations.
Regardless of planting date, estimated historical ETc for southwest Georgia obtained from the last 18 years showed a decrease in irrigation water demand for cabbage production during the crop development in the fall growing season (Fig. 4). Reduced temperatures and solar radiation during the fall season decreased soil water evaporation. After transplanting, crop water demand averaged 0.80, 0.69, 0.57, and 0.45 inches of water per week during the first 4 weeks of crop development for planting dates on August 15, September 1 and 15, and October 1, respectively. After this point, there was a peak in the crop water demand (Fig. 4), most likely due to increased leaf area expansion and the beginning of head formation (Paranhos et al., 2016). Estimated crop water requirement using Equation 1 during this growth stage (week 5 to 10) averaged 0.73, 0.58, 0.42, and 0.29 inches of water per week when planting occurred on August 15, September 1 and 15, and October 1, respectively. In the end of the season, cooler temperatures drastically reduced the water loss by evaporation, and crop water demand averaged 0.34, 0.24, 0.15, and 0.08 inches of water per week when planting on August 15, September 1 and 15, and October 1, respectively.
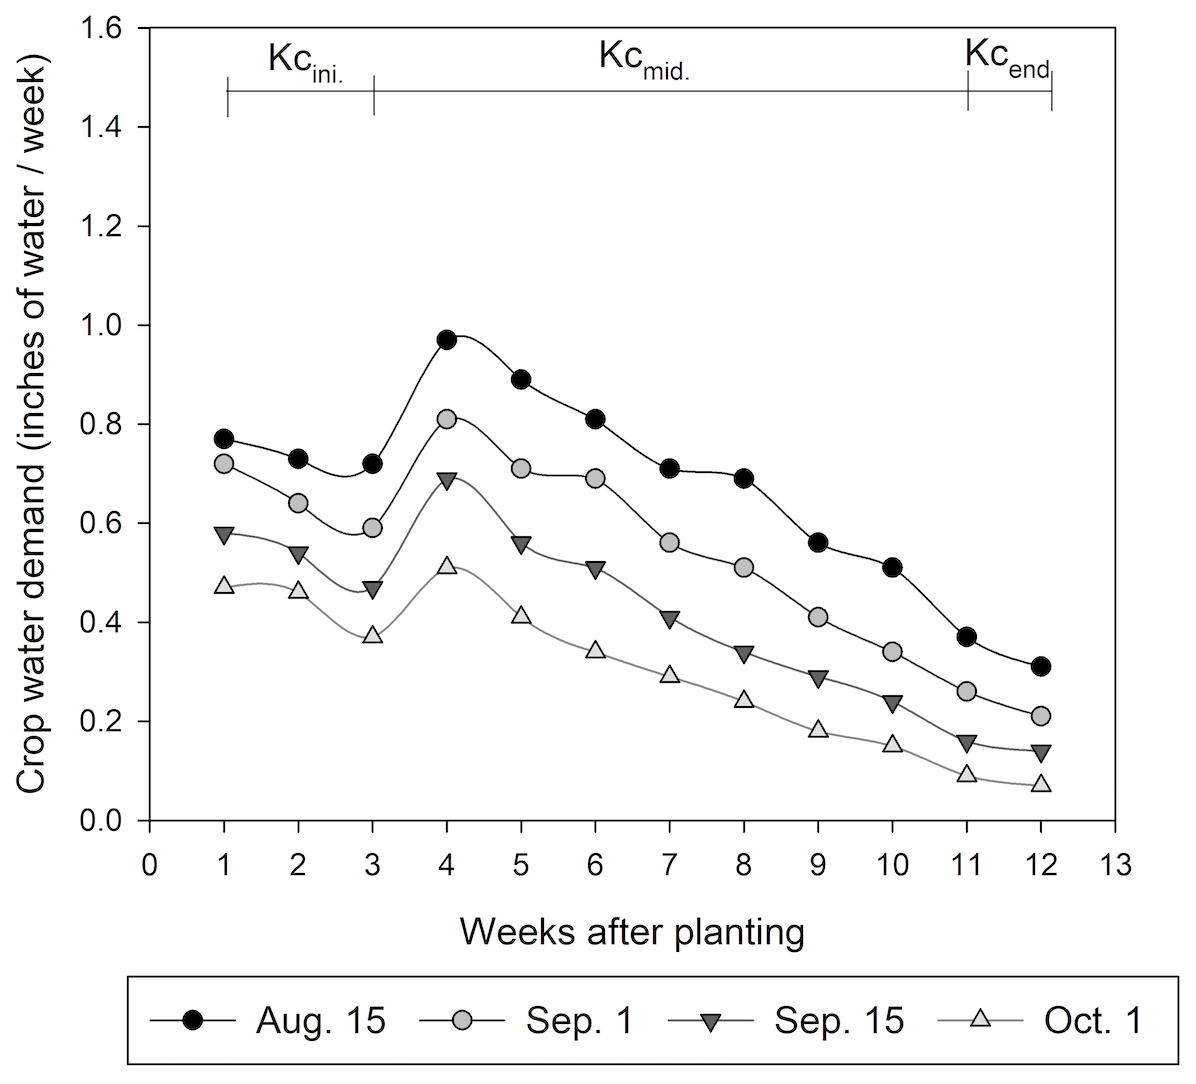
Figure 4. Irrigation water demand per week of cabbage for four planting dates (Aug. 15, Sep. 1 and 15, and Oct. 1) during the fall season in southwest Georgia (gallons of water/acre/week = inches of water/week * 27,154). Average water requirements were calculated from a combination of 18 years of weather data (from 2000 to 2017) and 8 locations.
The irrigation strategy designed to replace the crop water demand varied not only between growing seasons but also among planting dates within the season (Table 1). Cabbage planted on January 15 required 136,421 gallons/acre less water than that planted on March 1 (Table 1). Conversely, cabbage planted early in the Fall, on August 15, required 120,788 gallons/acre more water than that planted on October 1 (Table 1).
Table 1. Average volume of water (gallons/acre) estimated for each planting date evaluated in the spring and fall cabbage growing seasons in southwest Georgia. Water volumes were calculated from a combination of 18 years of weather data (from 2000 to 2017) and 8 locations.
| Planting date | Volume of water (gallons/acre) |
|---|---|
| Spring | |
| 01/15 | 192,028 |
| 02/01 | 236,350 |
| 02/15 | 283,350 |
| 03/01 | 328,449 |
| Fall | |
| 08/15 | 218,270 |
| 09/01 | 175,418 |
| 09/15 | 133,857 |
| 10/01 | 97,482 |
Excessive irrigation combined with the poor water holding capacity of the sandy soils of southwest Georgia has the potential to result in nutrient leaching, raising environmental and economic concerns (Sato et al., 2012; Scholberg et al., 2013). Poor management of irrigation in cabbage can have detrimental effects on yield potential, especially in critical periods when water deficits need to be avoided. Irrigation strategies that consider the crop water demand can potentially avoid unnecessary water stresses, as well as waterlogging, and leaching, all of which can cause losses. The crop water demand estimations determined in this study will be used to support decisions on cabbage irrigation recommendations.
References
Allen, R. G., Pereira, L. S., Raes, D., and Smith, M. (1998). FAO Irrigation and drainage paper No. 56. Rome: Food and Agriculture Organization of the United Nations, 56:97-156.
Barrett, C. E., Zotarelli, L., Paranhos, L. G., Dittmar, P., Fraisse, C. W., and VanSickle, J. (2018). Optimization of irrigation and N-fertilizer strategies for cabbage plasticulture system. Scientia Horticulturae, 234:323-334.
Bruce, R. R., Chesness, J. L., Keisling, T. C., Pallas, J. E., Smittle, D. A., Stansell, J. R., and Thomas, A.W. (1980).Irrigation of crops in the southeastern United States: Principles and practices. U.S. Dept. Agr., Sci. Educ. Admin. Agr. Rev. Man. ARM-S-9.
da Silva, A. L. B. R., Coolong, T., and Diaz-Perez, J. C. (2019). Principles of irrigation scheduling for vegetable crops in Georgia. Bulletin 1511 at the University of Georgia Extension Publications.
Dukes, M. D., Zotarelli, L., and Morgan, K. T. (2010). Use of Irrigation Technologies for Vegetable Crops in Florida. Horttechnology, 20:133-142.
Janes, B.E. (1950). The effect of irrigation, nitrogen level and season on the composition of cabbage. Plant Physiology. 25:441-452.
Jensen, M. E., Burman, R. D., and Allen R. G. (1990). Evapotranspiration and Irrigation Water Requirements. ASCE Manuals and Reports on Engineering Practice No. 70. American Society of Civil Engineers, New York.
Koppen, W.P. (1931). Grundriss der Klimakunde. Walter de Gruyter, Berlin.
Nelson, S. H., and Hwang, K. E. (1976). Water usage by cabbage plants at different stages of growth. Canadian Journal of Plant Science, 56:563-566.
Nortje, P. F., and Henrico, P. J. (1988). The effects of suboptimal irrigation and intra-row spacing on the yield and quality of cabbages. Acta Hort. 228:163-170.
Paranhos, L. G., Barrett, C. E., Zotarelli, L., Darnell, R., Migliaccio, K., and Borisova, T. (2016). Planting date and in-row plant spacing effects on growth and yield of cabbage under plastic mulching. Scientia Horticulturae, 202:49-56.
Simonne, E. H., Dukes, M. D., and Haman, D. Z. (2004). Principles and practices of irrigation management for vegetables. Vegetable Production Guide for Florida. University of Florida, Gainesville, FL, 33-39.
Smittle, D. A., Dickens, W. L., and Stansell, J. R. (1994). Irrigation regimes affect cabbage water use and yield. Journal of the American Society for Horticultural Science, 119:20-23.
Singh, R., and Alderfer, R. B. (1966). Effects of soil-moisture stress at different periods of growth of some vegetable crops. Soil Science. 101:69-80.
USDA (2017). Survey Staff. Natural Resources Conservation Service, United States Department of Agriculture. Web Soil Survey - Soil Survey of Tifton, Georgia. https://soilseries.sc.egov.usda.gov/OSD_Docs/T/TIFTON.html accessed 6 May 2019.
Wolfe, K., and Stubbs, K. (2018). 2017 Georgia Farm Gate Value Report. Center for Agribusiness & Economic Development, University of Georgia, Athens, GA http://www.caes.uga.edu/content/caes-subsite/caed/publications/farm-gate.html