Journal of the NACAA
ISSN 2158-9429
Volume 12, Issue 1 - June, 2019
Market Assessment for Value-Added Frozen Vegetable and Fruit Sales at a Farmers Market
- Bramwell, S. G., Agriculture Extension Faculty, Washington State University
Debien, S., Research Assistant, Washington State University
ABSTRACT
Growth in consumer-direct farm sales in recent decades, such as patronage at farmers markets, has come into competition with enterprises with competing value-propositions, such as large-scale organic operations and natural product lines at chain retailers. This has led some to examine opportunities to augment consumer-direct sales with new value-added products. In this study we evaluated the market for organic, value-added frozen vegetables and fruit at a farmers market in Western Washington. We wanted to determine current purchase habits, potential purchase preferences, and willingness to pay for frozen processed products. Survey results indicated that consumers were interested in purchasing locally processed frozen vegetable and fruit products, with most (47%) motivated to buy local in order to support the economic viability of local farmers. Locally grown, locally processed mixed vegetable products were sought by the most respondents (31%), who indicated they would pay a 36% price premium over non-local products.
Introduction
Rapid growth in consumer-direct sales at farmers markets has created high-value sales opportunities for small, medium, and entry-level farmers in recent decades. Recently, however, the use of ‘local’, ‘natural’, and ‘farm fresh’ branding by retailers, and consumer preference for one-stop shopping may be suppressing this growth (Ujcic, S., Helsing Junction Farm, personal communication, 2018; Vogel and Low, 2015). This has led some communities to invest in value-added processing infrastructure (such as peeling, dicing and freezing capacity) to increase product variety and sales.
Evidence of changes in direct sales is available from market data, agricultural economists, and farmers. For example, sales through venues such as farm stands and vegetable box-subscription programs increased by 8 percent nationally between 2007 and 2012 (1.7% annually), compared to 225% between 1992 and 2012 (11.3% annually; USDA, 1992; USDA, 2007; USDA, 2012a). Similarly, annual farmers market start-up rates decreased from 19 percent between 1994 and 2015 to 1.25 percent between 2015 and 2017 (Ikerd, 2015).
Small to mid-scale vegetable and fruit producers in Western Washington are among other farmers and food system workers who have called for assistance in augmenting direct sales. Proposed strategies include developing value-based supply chains, mid-scale aggregation and distribution systems, local food processing facilities, and others (Day-Farnsworth et al., 2009; Feenstra and Hardesty, 2016; Nelligan et al., 2016). Producers in the South Puget Sound region of Western Washington have identified lack of storage, processing, shared infrastructure, and aggregated distribution as suppressing sales opportunities (Patzek and Rocker, 2015; Bramwell et al., 2017).
To address these trends and needs, a partial Rapid Market Assessment (RMA) was conducted in 2018 at the Olympia Farmers Market to evaluate consumer interest in locally grown and locally processed frozen vegetables and fruit. The goals of this project were to (1) identify purchase habits, (2) identify product preferences, and (3) estimate willingness to pay for frozen processed goods.
Methods
Full RMAs are comprised of dot surveys, attendance counts, and a Constructive Comments and Observations methodology. Employed in part or whole, RMAs allow collection of qualitative and quantitative data at farmers’ markets (Lev and Brewer, 2008). A dot survey can be implemented as part of a full RMA or, as in this study, as a stand-alone exercize. Researchers and market staff conducted a full RMA at the Olympia Farmers Market in 2017 (Donovan and Kinney, 2017).
A dot survey alone was developed for the 2018 study because data regarding market attendance, physical characteristics, and market atmosphere (which are provided by the other two components) were not of interest. The 2018 survey focused on farmers market shopper interest in locally grown and processed goods, namely organic frozen vegetables and fruit. A dot survey was selected over other methodologies, such as interviews or written surveys, due to its ease of implementation and time efficiency in a market setting with substantial foot traffic.
The dot survey was held at the farmers market on Saturday, August 11 from 10:00 AM to 3:00 PM. The survey was set up at the north entrance of the market, next to the primary food vending, stage, and seating area. This location was chosen due to maximum visibility, ease of access, and because the 2017 RMA had identified that location as the highest volume entrance to the market. The team facilitating the survey included Washington State University Thurston County Extension faculty, market staff, and community partners. There were at least two team members at all times encouraging visitors to complete the survey, while a third provided instruction and fielded questions.
Seven multiple choice questions were written on large flip charts and displayed on easels. The seven questions (Table 1) were a subset of questions utilized in related institutional buyer interviews and a survey of vegetable box subscription programs (Bramwell, 2018). An advisory panel of farmers provided input on question design and survey objectives. The survey was reviewed by the WSU Institutional Review Board and determined to be exempt human subjects research.
Table 1. Dot survey questions evaluating purchase habits, purchase preferences, and willingness to pay regarding value-added frozen vegetables and fruit.

Market respondents used a pre-cut strip of seven dot stickers with which to populate response fields on each of the seven flip charts. Sheets for each question were replaced hourly to reduce potential bias, track responses by the hour, and create more space for subsequent responses. A table was located on site for informational materials, and to provide an illustration of locally grown and locally processed product. This included a bag of green beans, and a sample product label that indicated organic practices and local origin.
Results
In total, 546 farmers market shoppers participated in the dot survey. Participation was mostly concentrated between 11:00 am and 2:00 pm, with 64% of responses occurring during that three-hour period, and 13% of responses recorded in the hours prior and following. Response totals were mostly though not completely uniform due to occasional skipped questions by some respondents. The total number of market shoppers the day of the survey was not known, but by comparison the total number of shoppers visiting the market during the 2017 RMA on July 15th was 5,495. Shopper survey completion of the dot survey in 2018 amounted to approximately 10% of total market attendees, assuming attendance was comparable to the 2017 RMA day.
The largest age category of respondents was 60 years and older (29%, Figure 1) and, when combined with those from the next younger group (50-59), the resulting over-50 age block was the largest by a wide margin (47%). Those aged 21-29 years old constituted the second-largest single block (19%). The age distribution of the 2018 survey respondents could not be compared to the overall shopper population as age data was not collected in the 2017 RMA.
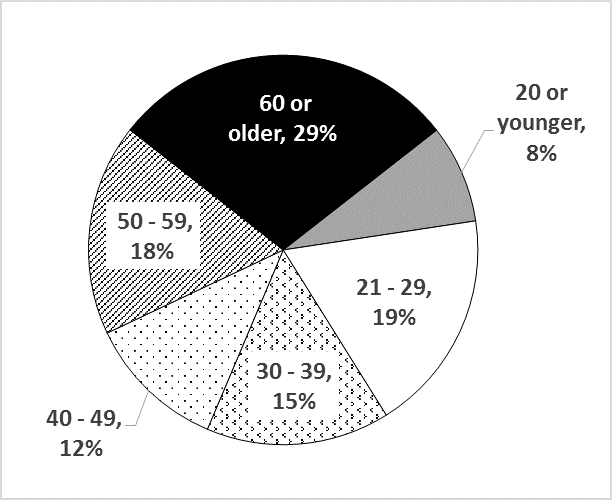
Figure 1. Age distribution of farmers market dot survey respondents.
Market shoppers were motivated to purchase local foods primarily for reasons of freshness/quality (32%), and to support local farmers (27%). When support for local farmers was combined with the third most frequently cited reason to purchase (support the local economy), this combined block focused on supporting the economic viability of local farmers captured nearly half of the responses (47%, Figure 2).
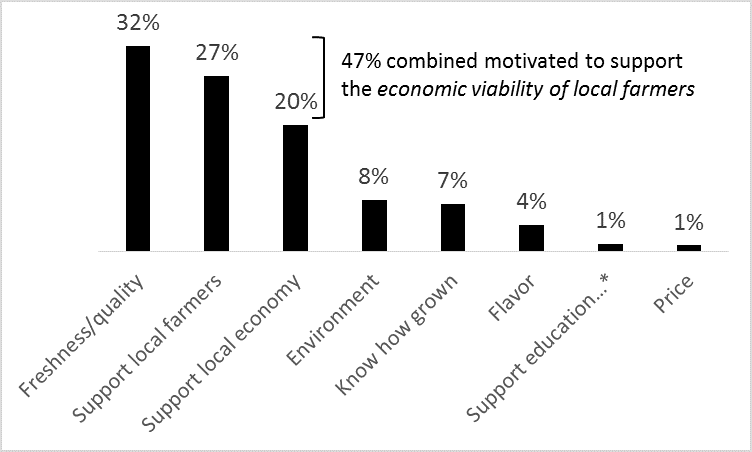
Figure 2. Respondent’s primary reason for buying local foods. *"Support education on how food is grown"
Overall, farmers market shoppers felt strongly that locally-processed foods should use locally-grown ingredients. Forty-one percent rated this to be very important, and 38% rated it as important, for a combined 79 percent who flagged the importance of linking local production and local processing. Eighteen percent of respondents found this to be somewhat important, 2% not important, and 1% had no opinion.
Market shoppers were asked which processed products they buy the most of, though not necessarily at the farmers market, as many products are not currently available there. Frozen fruits and vegetables constituted the largest category of processed products currently purchased by respondents (data not shown). More than two times the number of shoppers (47%) purchased these goods than pickled/fermented vegetables (22%), which was the next most purchased product. Jams or jellies were most purchased by 19% of shoppers, and canned vegetables or fruit by 12%.
Shoppers were next asked which processed product they would most like to buy at the farmers market specifically. Frozen vegetables or fruit were sought after by most shoppers (38%), and pickled/fermented vegetables constituted a fairly close second at 29% (Figure 3).

Figure 3. Value-added processed products that most shoppers most wanted to be able to purchase at the farmers market.
Asked what specific frozen produce shoppers would most like to buy, the two greatest desires were for frozen stir-fry veggie mix and blueberries (Table 2). A mixture of frozen vegetables constituted the only vegetable product among the top three rankings, with the other two being fruit products. Non-mixed vegetables at most received a third of the attention as the mix (peas, 11%), and at least a fraction (carrots, 2 percent). The stir-fry mix may have been distinguished among vegetables as most closely approximating a ready-to-eat product.
Table 2. Frozen product that farmers market shoppers would most like to buy. The flip chart stated “all products are locally grown and locally processed.”

Finally, shoppers were queried on their willingness to pay a price premium for a frozen stir-fry vegetable mix, the ingredients of which were grown and processed locally. Shoppers chose from specific response fields the amount they would pay beyond a proposed baseline price for organic, non-local frozen stir fry vegetable mix of $3.50 per lb from the supermarket. The baseline approximated an average retail frozen vegetable mix price ($3.62, Table 3). Most shoppers were fairly evenly split on $4.50 and $5.00 per lb, with approximately 32.4 and 31.7 percent of shoppers respectively selecting these two price fields (Figure 4).
Notably, a substantial combined block (64%) of shoppers identified this price range of $4.50 to $5.00 per lb as their comfortable willingness to pay for a locally grown and locally processed frozen organic vegetable mix.
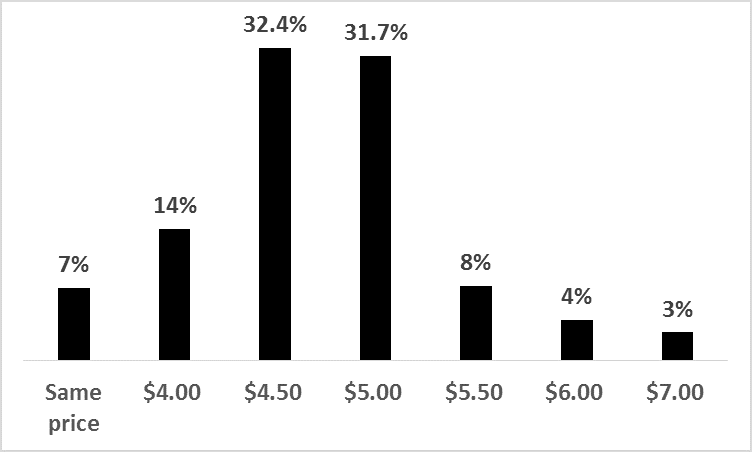
Figure 4. The most that farmers market shoppers would pay per pound for an organic frozen stir fry mix containing locally grown and locally processed vegetables, as compared to organic frozen stir-fry vegetables costing $3.50 per lb from the supermarket.
Discussion
As a result of this study, we were able to reasonably identify the purchase habits, preferences, and to a degree willingness to pay of shoppers at the Olympia Farmers Market regarding value-added frozen produce. It was estimated that survey completion by 546 shoppers amounted to a sizable percentage of total market attendees (10 %), assuming attendance was comparable between the July 2017 RMA and August 2018 dot survey. Survey responses provide reasonable insight into the perspectives of Olympia Farmers Market shoppers generally. However, one shortcoming of this extrapoloation was that the age distribution of the 2018 survey respondents could not be compared to the overall shopper population as age data was not collected in the 2017 RMA.
Shopper purchase habits
Regarding perspectives on local crop production, and vegetable and fruit processing, 79% of shoppers felt the two should be linked. This may have been related to the 47% of shoppers motivated to buy locally in order to support the economic viability of local farmers. In effect, shoppers may view the capacity to process local goods as an additional means of supporting local farmers; in other words, as a way of gaining access to products they could and would purchase. This willingness is good news for farmers in the region where this study was conducted, who have expressed frustration over several market trends. These include stagnated wholesale pricing, monopolies in local and regional wholesale distribution, label confusion (i.e. pollinator friendly, sustainable, natural, etc.), the apparent plateau of or slowing in consumer-direct sales, and increasing difficulty recruiting box-subscription customers.
Shopper purchase preferences
The purchasing preferences of farmers market shoppers leaned mostly towards frozen processed products, in comparison to other processed goods such as pickled/fermented vegetables, canned products, jams or jellies. This conclusion is supported by results that showed frozen processed products were the most preferred product were they to be available at the market. This result was somewhat unexpected, given significant recent attention that fermented vegetables have received due to health benefits. Shopper interest in frozen products may be due to growing enthusiasm for high nutrient retention in properly frozen goods, paired with ease of preparation.
Among value-added frozen vegetable or fruit products, shoppers were most interested in mixed vegetables and fruit. Stir-fry veggie mix was most preferred by most shoppers in every hour of the market, indicating that the visible accumulation of dots in any one category (and consequent respondent bias) was likely not responsible for the outcome.
Willingness to pay
Regarding price points for potential new value-added products, we estimated that farmers market shoppers were willing to pay a premium of approximately 36%, though with qualifications. The largest respondent block would pay on average between $4.50 and $5.00 per lb for the organic stir-fry vegetable mix over a $3.50 per lb baseline cost. By comparison with the average price per pound among ten frozen vegetable products available at three well-known grocery retail chains in Western Washington (Table 3), the baseline cost was less than the highest retail price ($4.78), greater than the lowest ($3.19), and slightly lower than the average ($3.62). At one extreme, shoppers' willingness to pay a premium ranged from none to at most 4.6 percent over the highest retail priced frozen vegetable product ($4.78). This illustrates one difficulty of identifying willingness to pay, as different baseline prices produce very different premium estimations.
Table 3. Prices of frozen vegetable products available in retail outlets.

Consumer interest in purchasing value-added frozen vegetable and fruit products as observed in this study suggests there is potential for these products to increase sales for farmers at farmers markets. Given the relatively unchanging percentage of sales nationally through consumer direct channels in recent years (approximately 0.3 to 2.2 percent depending on whether sales to retailers and local institutions are included in addition to those to consumers; USDA ERS, 2017; USDA, 2012b), it may be that additional product offerings will be critical to expanding these sales.
Results from this study will be combined with results from assessments of other consumer-direct market assessments, namely box-subscription programs and institutional buyer surveys, as part of a feasibility assessment for a frozen food processing facility in Western Washington. The farmers market dot survey garnered interest among participants, and results will be presented back to market shoppers in 2019 at tabling events. One weakness of the dot survey noted by the research team was the inability to relate and compare responses between questions, as for example significant relationships between respondent age and subsequent questions.
References
Bramwell, S.G., Moorehead, S., Meade, A., Sero, R., Gray, S., and Nowlin, M. (2017). South Puget Sound agricultural producer needs assessment. Washington State University Extension. Retrieved from: http://extension.wsu.edu/thurston/agriculture/.
Bramwell, S.G. (2018). Value-added fruit and vegetable production. Washington State University Extension. Retrieved from: https://extension.wsu.edu/thurston/value-add-fruit-veg/.
Day-Farnsworth, L., McCown, B., Miller, M., and Pfieffer, A. (2009). Scaling up: Meeting the demand for local food. University of Wisconsin-Extension Ag Innovation Center and UW-Madison Center for Integrated Agricultural Systems, Madison, WI.
Donovan, C., and Kinney, K. (2017). Olympia Farmers Market 2017 Rapid Market Assessment Report. Retrieved from: http://www.wafarmersmarkettoolkit-org.wafarmersmarkets.org/wp-content/uploads/2017/11/Olympia-FM-RMA-Report-9-30-2017.pdf.
Feenstra, G., and Hardesty, S. (2016). Values-based supply chains as a strategy for supporting small and mid-scale producers in the United States. Agriculture 6(39).
Ikerd, J. (2015). The status and future of local foods. Retrieved from: http://johnikerd.com/the-status-and-future-of-local-foods/.
Lev, L., and Brewer, L.J. (2008). Tools for Rapid Market Assessments. Oregon State University Extension Service Publication SR 1088. Oregon State University. Retreived from: https://catalog.extension.oregonstate.edu/sr1088.
Nelligan, D., Cameron, N., MacKinnon, B.L., and Vance, C. (2016). Bridging gaps: A framework for developing regional food systems. Journal of Agriculture, Food Systems, and Community Development 7(1): 49-69.
Patzek, L, and Rocker, S. (2015). Produce farm-to-market trends: A case study of South Puget Sound. Washington State University Extension Publication EM094E. Washington State University. Retrieved from: http://pubs.cahnrs.wsu.edu/publications/pubs/em094e/.
USDA. (1992). 1992 Census of Agriculture. United States Department of Agriculture National Agricultural Statistics Service. Retrieved from: https://www.agcensus.usda.gov/Publications/.
USDA. (2007). 2007 Census of Agriculture. United States Department of Agriculture National Agricultural Statistics Service. Retrieved from: https://www.agcensus.usda.gov/Publications/.
USDA. (2012a). 2012 Census of Agriculture. United States Department of Agriculture National Agricultural Statistics Service. Retrieved from: https://www.agcensus.usda.gov/Publications/.
USDA. (2012b). Direct Farm Sales of Food; Results from the 2015 Local Food Marketing Practices Survey. Report ACH12-35. United States Department of Agriculture Census of Agriculture Highlights. Retrieved from: https://www.nass.usda.gov/Publications/Highlights/2016/LocalFoodsMarketingPractices_Highlights.pdf.
USDA-ERS. (2017). Ag and Food Statistics, Charting the Essentials. United States Department of Agriculture Economic Research Services. Administrative Publication Number 075. Retrieved from: https://www.ers.usda.gov/webdocs/publications/83344/ap-075.pdf?v=42853.
Vogel, S. and Low, S. (2015). The size and scope of locally marketed food production. Retrieved from: https://www.ers.usda.gov/amber-waves/2015/januaryfebruary/the-size-and-scope-of-locally-marketed-food-production/